Using KernelShark to analyze the real-time scheduler【转】
转自:https://lwn.net/Articles/425583/
This article brought to you by LWN subscribers
Subscribers to LWN.net made this article — and everything that surrounds it — possible. If you appreciate our content, please buy a subscription and make the next set of articles possible.
February 2, 2011
This article was contributed by Steven Rostedt
The last LWN article on Ftrace described trace-cmd, which is a front end tool to interface with Ftrace. trace-cmd is all command line based, and works well for embedded devices or tracing on a remote system. But reading the output in a text format may be a bit overwhelming, and make it hard to see the bigger picture. To be able to understand how processes interact, a GUI can help humans see what is happening at a global scale. KernelShark has been written to fulfill this requirement. It is a GUI front end to trace-cmd.
KernelShark is distributed in the same repository that trace-cmd is:
git://git.kernel.org/pub/scm/linux/kernel/git/rostedt/trace-cmd.git
To build it, you just need to type make gui, as just typing make will only build trace-cmd. These two tools have been kept separate since a lot of embedded devices do not have the libraries needed to build KernelShark. A full HTML help is included in the repository and is installed with make install_doc. After installing the documentation, you can access the help directly from KernelShark from the "Help" menu.
This article is not a tutorial on using KernelShark, as everything you need to know about the tool is kept up-to-date in the KernelShark repository. Instead, this article will describe a use case that KernelShark was instrumental in helping to solve.
Analyzing the real-time scheduler
Some time ago, when the push/pull algorithm of the real-time scheduler in Linux was being developed, a decision had to be made about what to do when a high priority process wakes up on a CPU running a lower real-time priority process, where both processes have multiple CPU affinity, and both can be migrated to a CPU running a non-real-time task. One would think that the proper thing to do would be to simply wake up the high priority process on that CPU which would cause the lower priority process to be pushed off the running CPU. But a theory was that by doing so, we move a cache hot real-time process onto a cache cold CPU and possibly replace it with a cache cold process.
After some debate, the decision was made to migrate the high priority process to the CPU running the lowest priority task (or no task at all) and wake it there. Some time later, after the code was incorporated into mainline, I started to question this decision even though I was the one that fought for it. With the introduction of Ftrace, we now have a utility to truly examine the impact that decision has made.
The decision to move the higher priority task was based on an assumption that if the task was waking up, that it is more likely to be cache cold than a task that is already running. Thinking more about this case, one must think about what would cause a high priority task to wake up in the first place. If it is woken up periodically to do some work, then it can very well be the case that it will be cache cold. Any task that was scheduled in between can easily push out the cache of this high priority task. But what if the high priority task was blocked on a mutex? If the task was blocked on a mutex and another RT task was scheduled in its place then when the high priority task wakes up again, there is a good chance that the task will be cache hot.
A mutex in most real-time programs will usually be held for a short period of time. The PREEMPT_RT patch, which this code was developed from, converts spinlocks into mutexes, and those mutexes are held for very small code segments, as all spinlocks should be. Migrating a task simply because it blocked on a mutex increases the impact these locks have on the throughput. Why punish the high priority task even more because it blocked and had to wait for another task to run?
Before making any decision to change the code, I needed to have a test case that can show that the moving of a high priority task instead of preempting the lower priority task will cause the high priority task to ping pong around the CPUs when there is lock contention. A high priority task should not be punished (migrated) if it simply encounters lock contention with lower priority real-time tasks. It would also be helpful to know how changing this decision affects the total number of migrations for all the tasks under lock contention.
First try
Having a 4 processor box to play with, I started writing a test case that would possibly cause this scenario, and use Ftrace to analyze the result. The first test case to try was to create five threads (one more than CPUs) and four pthread mutex locks. Have all threads wake up from a barrier wait and then loop 50 times grabbing each lock in sequence and do a small busy loop. The name of this test is called migrate.c.
The test application uses trace_marker as explained in previous articles to write what is happening inside the application to synchronize with kernel tracing.
Running the following with trace-cmd:
   # trace-cmd record -e 'sched_wakeup*' -e sched_switch -e 'sched_migrate*' migrate

   # kernelshark
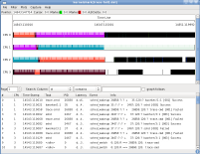 Like trace-cmd report, KernelShark will, by default, read the file trace.dat. You can specify another file by naming it as the first argument to KernelShark. While the KernelShark display images may be difficult to read fully in the article, clicking any of them will bring up a full-resolution version.
Since all tasks have been recorded, even trace-cmd itself, we want to filter out any tasks that we do not care about. Selecting Filter->Tasks from the KernelShark menu, and then choosing only the migrate threads will remove the extraneous tasks. Note that events that involve two tasks, like sched_switch or sched_wakeup, will not be filtered out if one of the tasks should be displayed.
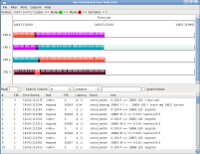
In the default graph view, each on-line CPU is represented by a plot line. Each task is represented by a different color. The color is determined by running the process ID through a hash function and then parsing that number into a RGB format.
- The purple ( ) colored bar represents thread 4, the highest priority task.
- The orange(ish) ( ) colored bar represents thread 3.
- The turquoise ( ) colored bar represents thread 2.
- The brown ( ) colored bar represents thread 1.
- The light blue ( ) colored bar represents thread 0, the lowest priority task.
The lines sticking out of the top of the bars represent events that appear in the list below the graph.
By examining the graph we can see that the test case was quite naive. The lowest priority task, thread 0, never got to run until the other four tasks were finished. This makes sense as the machine only had four CPUs and there were four higher priority tasks running. The four running tasks were running in lock step, taking the locks in sequence. From this view it looks like the tasks went out of sequence, but if we zoom in to where the migrations happened, we see something different.
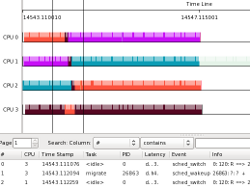
To zoom into the graph, press and hold the left mouse button. A line will appear, then drag the mouse to the right. As the mouse moves off the line, another line will appear that follows the mouse. When you let go of the mouse button, the view will zoom in making the locations of the two lines the width of the new window.
Repeating the above procedure, we can get down to the details of the migration of thread 3. Double clicking on the graph brings the list view to the event that was clicked on. A green line appears at the location of that was clicked.
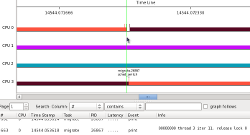
On CPU 0, thread 3 was preempted by the watchdog/0 kernel thread. Because we filtered out all threads but the migration test tasks, we see a small blank on the CPU 0 line. This would have been filled in with a colored bar representing the watchdog/0 thread if the filters were not enabled. The watchdog/0 thread runs at priority 99, which we can see from the sched_switch event as the priority of the tasks is between the two colons. The priority shown is represented by the kernel's view of priority, which is inverse to what user-space uses (user space priority 99 is kernel priority zero).
When the watchdog/0 thread preempted thread 3, the push/pull algorithm of the scheduler pushed it off to CPU 3, which had the lowest priority running task. Zooming into the other migrations that happened on the other CPUs, show that the watchdog kernel thread was responsible for them as well. If it wasn't for the watchdog kernel threads, this test would not have had any migrations.
Test two, second failure
The first test took the naive approach of just setting up four locks and having the tasks grab them in order. But this just kept the tasks in sync. The next approach is to try to mix things up a little more. The concern about the real-time scheduler is how it affects the highest priority task. The next test creates the four locks again (as there are four CPUs) and five tasks each of increasing priority. This time, only the highest priority task grabs all the locks in sequence. The other four tasks will grab a single lock. Each lock will have a single task and the highest priority task grabbing that lock. To try to force contention, pthread barriers are used. For those unfamiliar with pthread barriers, they are synchronization methods to serialize threads. A barrier is first initialized with a number and all threads that hit the barrier will block until that number of threads have hit the barrier, then all the threads are released.
This test case creates two barriers for each lock (lock_wait and lock_go) each initialized with the number 2, for the two tasks (the unique low priority task and the high priority task) that will take the lock. The low priority task will take the lock and wait on a barrier (lock_wait). The high priority task will hit that barrier before it takes the corresponding lock. Because the low priority task is already waiting on the barrier, the high priority task will trigger the barrier to release both tasks because the barrier has a task limit of two. The high priority task will most likely try to take the mutex while the low priority task aleady has it. The low priority task will release the mutex and then wait on the other barrier (lock_go) letting the high priority task take the mutex.
Running this test under trace-cmd yields the following from KernelShark after filtering out all but the migrate test tasks.
As the colors of the tasks are determined by their process IDs, this run has the following: 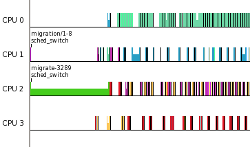
- The initial green ( ) bar is the main thread that is setting up all the locks and barriers.
- The light purple ( ) bar is the lowest priority thread 0.
- The red ( ) bar is the next-higher priority thread 1.
- The yellow(ish) ( ) bar is the next-higher priority thread 2.
- The blue ( ) bar is the next-higher priority thread 3.
- The light turquoise ( ) bar is the highest priority thread 4.
Looking at the graph it seems that the highest priority thread stayed on the same CPU, and was not affected by the contention. Considering that the scheduler is set to migrate a waking real-time task if it is woken on a CPU that is running 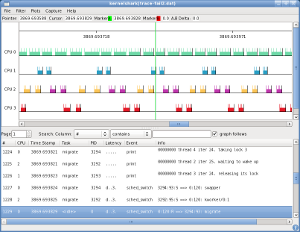 another real-time task, regardless of the priorities, one would think the high priority task would have migrated a bit more. Zooming in on the graph brings to light a bit more details to what is occurring.
What we can see from the graph, and from the list, is that the high priority thread did have contention on the lock. But because all threads are waiting for the high priority process to come around to its lock, the other threads are sleeping when the high priority process wakes up. The high priority process is only contending with a single thread at a time. Threads 0 and 2 share CPU 2 without issue, while threads 1 and 3 each still have a CPU for themselves.
The test to force migration
The second test was on the right track. It was able to produce a contention but failed to have the CPUs busy enough to cause the highest priority task to wake up on a CPU running another real-time task. What is needed is to have more tasks. The final test adds twice as many running threads as there are CPUs.
This test goes back to all tasks grabbing all locks in sequence. To prevent the synchronization that has happened before, each thread will hold a lock a different amount of time. The higher the priority of a thread, the shorter time it will hold the lock. Not only that, but the threads will now sleep after they release a lock. The higher the priority of a task, the longer it will sleep:
   lock_held  = 1 ms * ((nr_threads - thread_id) + 1)

   sleep_time = 1 ms * thread_id
The lowest priority thread will never sleep and it will hold the lock for the longest time. To make things even more interesting, the mutexes have been given the PTHREAD_PRIO_INHERIT attribute. When a higher priority thread blocks on a mutex held by a lower priority thread, the lower priority thread will inherit the priority of the thread it blocks.
The test records the number of times each task voluntarily schedules, the number of times it is preempted, the number of times it migrates, and the number of times it successfully acquired all locks. When the test finishes, it gives an output of these for each thread. The higher the task number the higher the priority of the thread it represents.
Task vol nonvol migrated iterations 0 43 3007 1571 108 1 621 1334 1247 108 2 777 769 1072 108 3 775 17 701 108 4 783 50 699 108 5 788 2 610 109 6 801 89 680 109 7 813 0 693 110 Total 5401 5268 7273 868
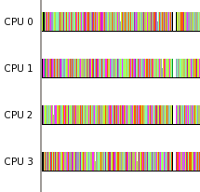 Running this test under trace-cmd and viewing it with KernelShark yields a graph with lots of pretty colors, which means we likely succeeded in our goal. To prove that the highest priority thread did indeed migrate, we can plot the thread itself.
Using the "Plots" menu and choosing "Tasks" brings up the same type of dialog as the task filter that was described earlier. I selected the highest priority thread (migrate-2158), and zoomed in to get a better view. The colors on a task plot are determined by the CPU number it was running on. When a task migrates, the colors of the plot changes.
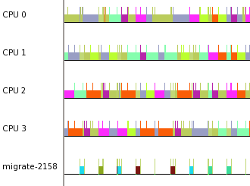
This test now demonstrates how a high priority task can migrate substantially when other RT tasks are running on the system. Changes to the real-time scheduler can now be tested. The commit changes the decision on which thread migrates when an real-time task wakes up on a CPU running another real-time task. The original way was to always move the task that is waking up if there is a CPU available that is running a task that is lower in priority than both tasks. Instead, the commit changes this to just wake up the real-time task on its CPU if it is higher priority than the real-time task that is currently running.
The migrate test now shows:
Task vol nonvol migrated iterations 0: 52 2923 2268 108 1: 569 1529 1457 109 2: 801 1961 2194 109 3: 808 789 1274 109 4: 810 61 155 109 5: 813 10 57 109 6: 827 35 81 110 7: 824 0 4 110 total: 5504 7308 7490 873
The total number of migrations has stayed around the same (several runs will yield a fluctuation of a few hundred), but the number of migrations for the highest priority task has dropped substantially, as it will not migrate simply because it woke up on a CPU running another real-time task. Note, the reason that the highest priority task migrated at all was because it woke up on a CPU that was running the task that owned the mutex that it was blocked on. As these are priority inheritance mutexes, the owner would have the same priority as the highest priority process that it is blocking. The wake up will not preempt a real-time task of equal priority. Perhaps that can be the next change to the real-time scheduler: have the wake up be aware of priority mutexes.
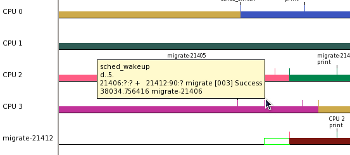
The highest priority thread (migrate-21412) was woken on CPU 3, which was running thread 1 (migrate-21406) which is the task that thread 7 originally blocked on. CPU 2 happened to be running thread 0 (migrate-21405) which was the lowest priority thread running at the time. Note that the empty green box that is at the start of the task plot represents the time between when a task was woken and the time it actually was scheduled in.
Using KernelShark allowed me to analyze each of my tests to see if they were doing what I expected them to do. The final test was able to force a common scenario where a high priority process is woken on a CPU running another real-time task, and cause the decision to be made, whether to migrate the waking task or not. This test allowed me to see how the changes to that decision affected the results.
This article demonstrates a simple use case for KernelShark, but there are a lot more features that aren't explained here. To find out more, download KernelShark and try it out. It is still in beta and is constantly being worked on. Soon there will be plugins that will allow it to read other file formats and even change the way it displays the graph. All the code is available and under the GPL, so you can add your own features as well (hint hint).
(Log in to post comments)
Using KernelShark to analyze the real-time scheduler
Posted Feb 3, 2011 2:32 UTC (Thu) by mhelsley (guest, #11324) [Link]
This looks excellent
Posted Feb 3, 2011 15:03 UTC (Thu) by robert_s (subscriber, #42402)
[Link]
doing realtime programming and I'm so glad to know it exists.
This looks excellent
Posted Feb 10, 2011 21:56 UTC (Thu) by oak (guest, #2786)
[Link]
http://en.wikipedia.org/wiki/LTTng
?
(It's UI has some usability issues, but otherwise LTT has been used for this kind of stuff on Linux for the past decade.)
RT bandwidth causing gaps in the test
Posted Feb 4, 2011 3:36 UTC (Fri) by nevets (subscriber, #11875)
[Link]
An interesting note:
Those gaps you see in the last test run are caused by the RT bandwidth kicking in. If I perform the following:
# echo -1 > /proc/sys/kernel/sched_rt_runtime_us
Those gaps disappear.
Using KernelShark to analyze the real-time scheduler
Posted Feb 5, 2011 11:58 UTC (Sat) by tardyp (subscriber, #58715) [Link]
I wish we could more easily put our efforts in common and put the best
of pytimechart (great graphical display), and kernelshark (great textual
display and filtering capabilities) into the same tool.
I guess the choice of toolkit and programming language does not help.
Pierre
Using KernelShark to analyze the real-time scheduler
Posted Feb 6, 2011 20:55 UTC (Sun) by nevets (subscriber, #11875)
[Link]
I thought gtk and python work well together. There's even python plugins
for kernelshark. The filter capability is separated out and would be
easy to make into a library that python could read. As the parse-events
library is already separate, and I'm working on getting perf to use it
too.
I'm all for reuse of code, and would love to help in any effort to share capabilities between the tools.
Using KernelShark to analyze the real-time scheduler【转】的更多相关文章
- AndroidStudio3.0无法打开Android Device Monitor的解决办法(An error has occurred on Android Device Monitor)
---恢复内容开始--- 打开monitor时出现 An error has occurred. See the log file... ------------------------------- ...
- Pair Project: Elevator Scheduler [电梯调度算法的实现和测试]
作业提交时间:10月9日上课前. Design and implement an Elevator Scheduler to aim for both correctness and performa ...
- How to Analyze "Deadlocked Schedulers" Dumps?---WINDBG
https://blogs.msdn.microsoft.com/karthick_pk/2010/06/22/how-to-analyze-deadlocked-schedulers-dumps/ ...
- 从scheduler is shutted down看程序员的英文水平
我有个windows服务程序,今天重点在测试系统逻辑.部署后,在看系统日志时,不经意看到一行:scheduler is shutted down. 2016-12-29 09:40:24.175 {& ...
- Spring 4 + Quartz 2.2.1 Scheduler Integration Example
In this post we will see how to schedule Jobs using Quartz Scheduler with Spring. Spring provides co ...
- VMware中CPU分配不合理以及License限制引起的SQL Scheduler不能用于查询处理
有一台SQL Server(SQL Server 2014 标准版)服务器中的scheduler_count与cpu_count不一致,如下截图所示: SELECT cpu_count , ...
- Oracle索引梳理系列(十)- 直方图使用技巧及analyze table操作对直方图统计的影响(谨慎使用)
版权声明:本文发布于http://www.cnblogs.com/yumiko/,版权由Yumiko_sunny所有,欢迎转载.转载时,请在文章明显位置注明原文链接.若在未经作者同意的情况下,将本文内 ...
- Windows Task Scheduler Fails With Error Code 2147943785
Problem: Windows Task Scheduler Fails With Error Code 2147943785 Solution: This is usually due to a ...
- 通过LoadRunner - Analyze详细分析页面元素请求
众所周知LoadRunner录制某个链接,包括动态请求与js.css.jpg等静态请求. web_custom_request("动态请求", "URL=http://w ...
随机推荐
- NOIP2011
DAY1 铺地毯 (carpet.cpp/c/pas) 模拟 倒序离线处理 program carpet; var l,w:..,..] of longint; n,i,a,b,g,k,x,y:lon ...
- Python 自动补全(vim)
一.vim python自动补全插件:pydiction 可以实现下面python代码的自动补全: 1.简单python关键词补全 2.python 函数补全带括号 3.python 模块补全 4.p ...
- spring接收json字符串的两种方式
一.前言 前几天遇到一个问题,前端H5调用我的springboot一个接口(post方式,@RequestParameter接收参数),传入的参数接收不到.自己测试接口时使用postman的form- ...
- C++ STL 常用遍历算法
C++ STL 常用遍历算法 STL的容器算法迭代器的设计理念 1) STL的容器通过类模板技术,实现数据类型和容器模型的分离 2) STL的迭代器技术实现了遍历容器的统一方法:也为STL的算法提供了 ...
- SAM
后缀自动机能识别字符串S的所有子串,是一个DAG. http://blog.csdn.net/huanghongxun/article/details/51112764 https://blog.xe ...
- Navicat使用教程:获取MySQL中的行数(第1部分)
下载Navicat Premium最新版本 Navicat Premium是一个可连接多种数据库的管理工具,它可以让你以单一程序同时连接到MySQL.Oracle及PostgreSQL数据库,让管理不 ...
- 【uoj33】 UR #2—树上GCD
http://uoj.ac/problem/33 (题目链接) 题意 给出一棵${n}$个节点的有根树,${f_{u,v}=gcd(dis(u,lca(u,v)),dis(v,lca(u,v)))}$ ...
- 解题:CF570D Tree Requests
题面 DSU on tree确实很厉害,然后这变成了一道裸题(逃 还是稍微说一下流程吧,虽然我那个模板汇总里写过 DSU on tree可以以$O(n\log n)$的复杂度解决树上子树统计问题,它这 ...
- html视频背景
视频作为网页背景的限制因素 在动手编码实现前,视频作为网页背景的有些问题我们要先考虑清楚: 并不是因为技术上可行你就可以任意使用:作为背景的视频内容必须能增强页面内容的感染力,而不是因为漂亮或技术上很 ...
- .net mvc 一个Action的 HttpGet 和 HttpPost
http://www.cnblogs.com/freeliver54/p/3747836.html 本文转自:http://stackoverflow.com/questions/11767911/m ...
