Prometheus学习笔记(3)什么是node_exporter???
Node_exporter安装配置启动
node_exporter安装在被监控端,安装方式也比较简单,直接下载解压安装即可,默认启动后监听9100端口。
# 下载

[root@node02 ~]# wget https://github.com/prometheus/node_exporter/releases/download/v0.18.1/node_exporter-0.18.1.linux-amd64.tar.gz

# 二进制解压式安装

[root@node02 ~]# tar -zxf node_exporter-0.18.1.linux-amd64.tar.gz -C /usr/local/

[root@node02 ~]# mv /usr/local/node_exporter-0.18.1.linux-amd64 /usr/local/node_exporter-0.18.1

[root@node02 ~]# ln -sv /usr/local/node_exporter-0.18.1 /usr/local/node_exporter

# 启动

[root@node02 ~]# cd /usr/local/node_exporter

[root@node02 node_exporter]# ./node_exporter &

[root@node02 node_exporter]# netstat -tulnp |grep 9100

tcp6       0      0 :::9100                 :::*                    LISTEN      6433/./node_exporte
node_exporter默认监听9100端口,在服务端增加被监控的目标主机,即可通过客户端的node_exporter采集数据,如下:
[root@prometheus prometheus]# cat prometheus.yml

global:

  scrape_interval:     15s

  evaluation_interval: 15s

  external_labels:

    monitor: 'codelab-monitor'

# Alertmanager configuration

alerting:

  alertmanagers:

  - static_configs:

    - targets:

      # - alertmanager:9093

rule_files:

  # - "first_rules.yml"

  # - "second_rules.yml"

scrape_configs:

  # The job name is added as a label `job=<job_name>` to any timeseries scraped from this config.

  - job_name: 'prometheus'

    scrape_interval: 5s

    static_configs:

    - targets: ['localhost:9090','192.168.0.128:9100']    #目标targets是一个列表,用逗号分隔,添加目标监控主机的ip和端口,也可以通过主机名,但是需要在hosts进行解析

重启prometheus后生效!!!
可以通过访问目标主机的ip+端口进行获取数据测试,如下:
[root@prometheus ~]# curl 192.168.0.128:9100/metrics    # 可以看到一系列的系统指标,如cpu的1,5,15分钟的负载值

...

# HELP node_load1 1m load average.

# TYPE node_load1 gauge

node_load1 0.08

# HELP node_load15 15m load average.

# TYPE node_load15 gauge

node_load15 0.05

# HELP node_load5 5m load average.

# TYPE node_load5 gauge

node_load5 0.04

# HELP node_memory_Active_anon_bytes Memory information field Active_anon_bytes.

# TYPE node_memory_Active_anon_bytes gauge

node_memory_Active_anon_bytes 2.45653504e+08

# HELP node_memory_Active_bytes Memory information field Active_bytes.

# TYPE node_memory_Active_bytes gauge

node_memory_Active_bytes 3.42388736e+08

...
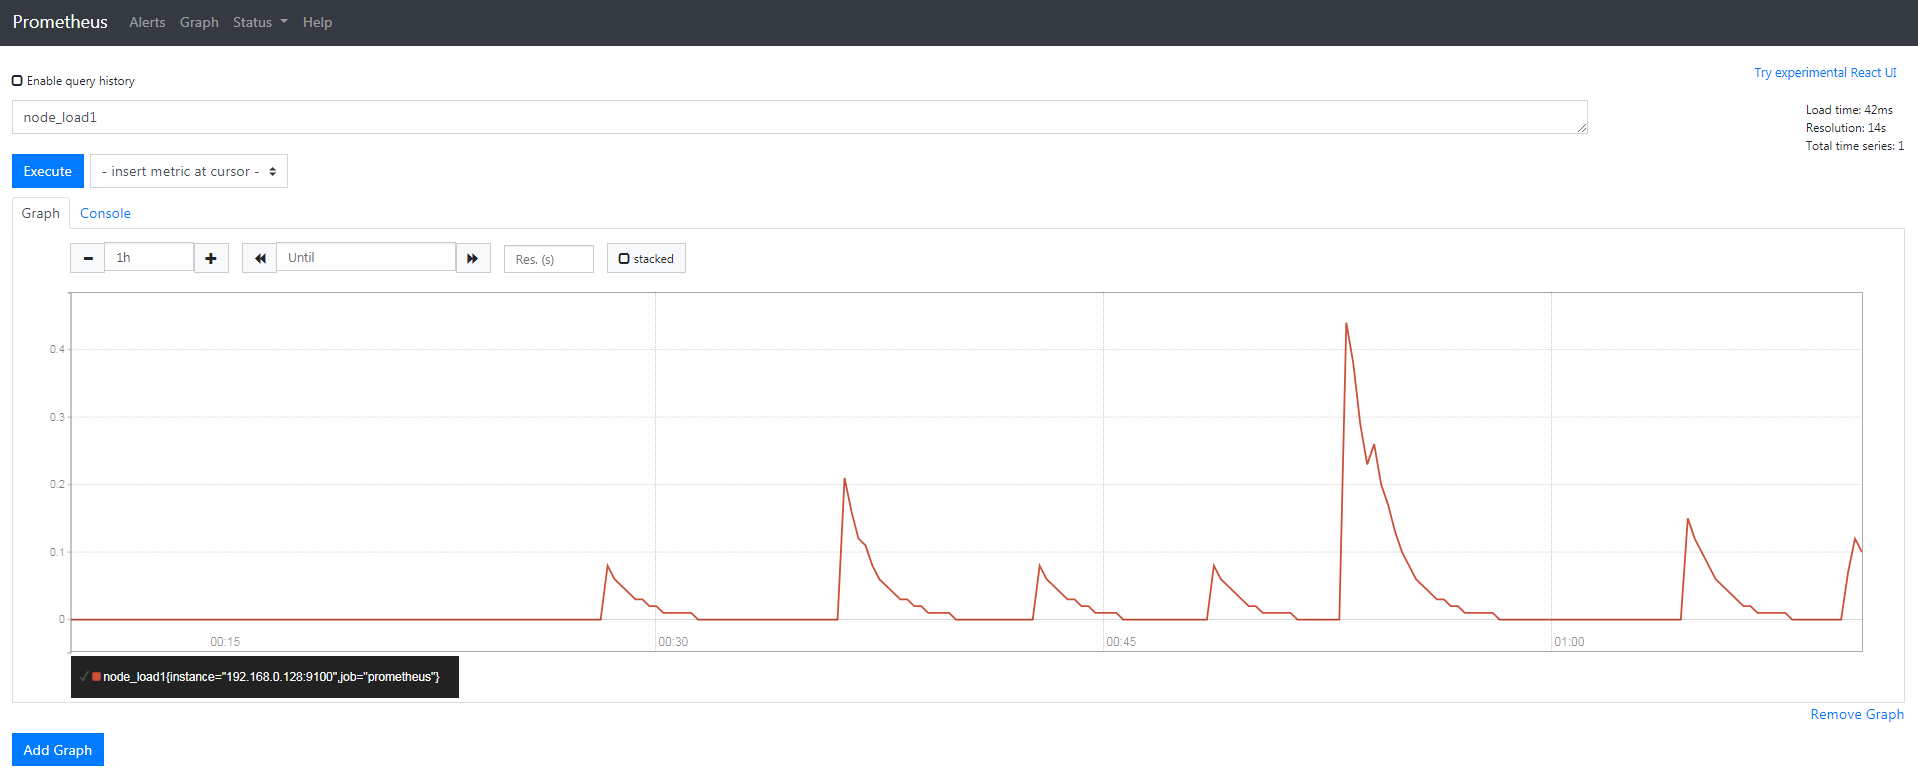
在Prometheus的web端可以通过192.168.0.143/graph上的查询搜索框进行查询对应监控节点的负载值,如图:
同理,默认没有守护进程管理node_exporter,实在太麻烦了,来一份node_exporter.service,安排!!!
[root@node02 ~]# vim /usr/lib/systemd/system/node_exporter.service

[Unit]

Description=node_exporter

Documentation=https://prometheus.io/docs/introduction/overview

After=network-online.target remote-fs.target nss-lookup.target

Wants=network-online.target

[Service]

Type=simple

PIDFile==/var/run/node_exporter.pid

ExecStart=/usr/local/node_exporter/node_exporter

ExecReload=/bin/kill -s HUP $MAINPID

ExecStop=/bin/kill -s TERM $MAINPID

[Install]

WantedBy=multi-user.target

[root@node02 ~]# systemctl daemon-reload

[root@node02 ~]# systemctl start node_exporter

[root@node02 ~]# ps -ef |grep node_exporter

root     15574     1  7 16:49 ?        00:00:00 /usr/local/node_exporter/node_exporter

root     15578  6373  0 16:49 pts/0    00:00:00 grep --color=auto node_exporter

[root@node02 ~]# netstat -tulnp |grep 9100

tcp6       0      0 :::9100                 :::*                    LISTEN      15574/node_exporter

[root@node02 ~]# systemctl restart node_exporter
Prometheus学习笔记(3)什么是node_exporter???的更多相关文章
- 【Prometheus学习笔记】主机监控 -node_exporter
Exporter for machine metrics prometheus/node_exporter 安装 Prometheus sudo tar -zxvf prometheus-*.tar. ...
- Prometheus学习笔记(7)PromQL玩法入门
目录 1.什么是PromQL??? 2.如何查询??? 1.什么是PromQL??? PromQL是Prometheus内置的数据查询语言,其提供对时间序列数据丰富的查询,聚合以及逻辑运算能力的支持. ...
- Prometheus学习笔记(6)Alertmanager告警
目录 一.Alertmanager简介 二.Alertmanager部署 三.Alertmanager配置 四.自定义告警规则和发送 五.自定义告警模板 一.Alertmanager简介 Promet ...
- Prometheus学习笔记(4)什么是pushgateway???
目录 一.pushgateway介绍 二.pushgateway的安装运行和配置 三.自定义脚本发送pushgateway 四.使用pushgateway的优缺点 一.pushgateway介绍 pu ...
- Prometheus学习笔记之教程推荐
最近学习K8S和基于容器的监控,发现了如下的教程质量不错,记录下来以备参考 K8S最佳实战(包括了K8S的Prometheus监控和EFK日志搜集) https://jimmysong.io/kube ...
- Prometheus学习笔记(5)Grafana可视化展示
目录 一.Grafana安装和启动 二.配置数据源 三.配置dashboard 四.配置grafana告警 一.Grafana安装和启动 Grafana支持查询Prometheus.从Grafana ...
- Prometheus学习笔记(2)Prometheus部署
目录 Prometheus的安装配置启动 Prometheus的安装配置启动 1.Prometheus二进制安装 Prometheus下载链接:https://prometheus.io/downlo ...
- Prometheus学习笔记(1)Prometheus架构简介
Prometheus简介和架构 Prometheus 是由 SoundCloud 开源监控告警解决方案.架构图如下: 如上图,Prometheus主要由以下部分组成: Prometheus Serve ...
- Contour 学习笔记(一):使用 Contour 接管 Kubernetes 的南北流量
原文链接:Contour 学习笔记(一):使用 Contour 接管 Kubernetes 的南北流量 在 Kubernetes 中运行大规模以 Web 为中心的工作负载,最关键的需求之一就是在 L7 ...
随机推荐
- jQuery的核心对象、原型对象、静态方法、动态方法
什么叫jQuery的核心对象? $ $===jQuery 什么叫jQuery的原型对象? $.fn $.fn===$.prototype 什么叫静态方法? 在构造函树上定义的方法,静态方法通过构造函数 ...
- P1553 数字反转(升级版)
Emma,关于这道题,我..不想说啥子,也就做了它一个下午左右吧(原由:本人太菜) 补充一个知识点goto语句: 这个东西特别的好用,可以直接无条件调到冒号后面的语句,进行操作. 举个例子: #inc ...
- 第10组 Alpha事后诸葛亮
一.组长博客链接 组长博客 二.总结思考 设想和目标 我们的软件要解决什么问题?是否定义得很清楚?是否对典型用户和典型场景有清晰的描述? 我们的APP主要解决大学生闲置物品处理问题,定义的很清楚,用户 ...
- ros使用pppoe拨号获取ipv6,并且下发IPV6的dns到客户机win7
原文: https://www.mobile01.com/topicdetail.php?f=110&t=3405680 http://forum.mikrotik.com/viewtopic ...
- elasticsearch 常用命令 一直红色 重启不稳定 不停的宕机
persistent (重启后设置也会存在) or transient (整个集群重启后会消失的设置). 查看集群状态和每个indices状态.搜索到red的,没用就删除 GET /_cluster/ ...
- 039 RabbitMq及数据同步01
1.RabbitMq (1)问题引出 目前我们已经完成了商品详情和搜索系统的开发.我们思考一下,是否存在问题? 商品的原始数据保存在数据库中,增删改查都在数据库中完成. 搜索服务数据来源是索引库,如果 ...
- [转帖]聊聊Web App、Hybrid App与Native App的设计差异
聊聊Web App.Hybrid App与Native App的设计差异 https://www.cnblogs.com/zhuiluoyu/p/6056672.html 编者按:这3类主流应用你都了 ...
- Zookeeper简单入门
官网地址https://zookeeper.apache.org/releases.html 下载https://mirrors.tuna.tsinghua.edu.cn/apache/zookeep ...
- SpringCloud 基础
目录 SpringCloud 基础 一.概述 二.服务发现组件 Eureka 1. 介绍 2. 搭建 Maven 父工程 3. 创建 Eureka 集群 4. 创建服务提供方集群 5. 创建服务消费方 ...
- go get 命令
示例: go get github.com/jinzhu/gorm 下载并安装gorm包. 远程代码库有github,GitLlab,Gogs 命令介绍说明: -fix : 比如,我的代码是一年前1. ...