PSi-Population Stability Index (PSI)
python信用评分卡(附代码,博主录制)
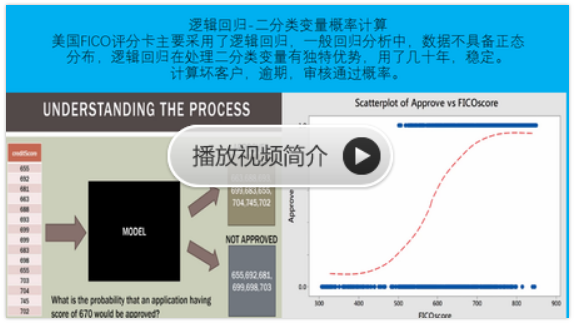
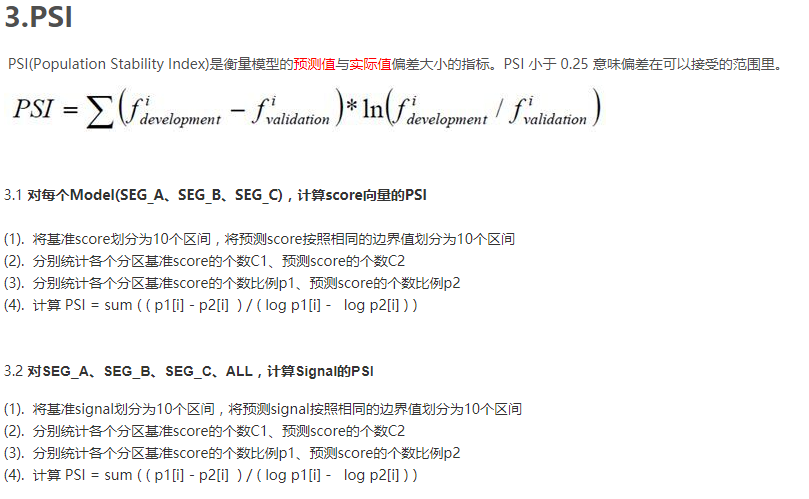
由于模型是以特定时期的样本所开发的,此模型是否适用于开发样本之外的族群,必须经过稳定性测试才能得知。稳定度指标(population stability index ,PSI)可衡量测试样本及模型开发样本评分的的分布差异,为最常见的模型稳定度评估指针。其实PSI表示的就是按分数分档后,针对不同样本,或者不同时间的样本,population分布是否有变化,就是看各个分数区间内人数占总人数的占比是否有显著变化。公式如下:
PSI实际应用范例:
1)样本外测试
针对不同的样本测试一下模型稳定度,比如训练集与测试集,也能看出模型的训练情况,我理解是看出模型的方差情况。
2)时间外测试
测试基准日与建模基准日相隔越远,测试样本的风险特征和建模样本的差异可能就越大,因此PSI值通常较高。至此也可以看出模型建的时间太长了,是不是需要重新用新样本建模了。
http://ucanalytics.com/blogs/population-stability-index-psi-banking-case-study/

This is a continuation of the banking case study for the creation of application risk scorecards we have discussed in some previous articles. You could find the previous parts of the series at the following links (Part 1), (Part 2), (Part 3)and (Part 4).
In this article, we will discuss the Population Stability Index (PSI), an important metric to identify a shift in population for retail credit scorecards. Before we delve deeper into the calculation of the population stability index (PSI) and its utility, let’s try to understand the overall purpose of the PSI and similar indexes by connecting a few dots between..
Dictators and Credit Crisis
What is similar between Napoleon’s and then Hitler’s attempts to invade Russia and financial crisis of 2007-08?
Napoleon tried to invade Russia in 1812 and Hitler repeated Napoleon’s misdeeds in 1941 – both invasions ended with severe defeats for the armies of the dictators. The armies of both Napoleon and Hitler were far superior to the Russians. It was the conditions in which the battles were fought that resulted in these defeats. Russian winters are often held responsible for the fate of these armies. In reality, it was the ill-preparedness and bad judgment of both Napoleon’s and Hitler’s men that caused them the humiliating defeats. They were very well trained men but they were trained in benevolent conditions of France and Germany. This time, the battle was in completely different and extreme conditions, and they could not cope with it.
The failure of credit risk models during the financial crisis 0f 2007-08 could be related to the fate of both the French and German armies. The models were built and trained in a benevolent economic environment and were ill-prepared to deal with extreme economic conditions at the time. Additionally, there were series of bad judgments by the executives at the financial firms that resulted in total economic collapse.
The moral of the above stories is that one has to keep a close tab on a change in conditions in the currently prevalent environment and training environment. The Basel III accord has paid a significant attention towards monitoring portfolio on a regular basis for a good reason. The population stability index (PSI) is one such index that helps risk managers in performing this task for retail credit scorecards.
Population Stability Index (PSI) – Our Banking Case Continues
You are the chief-risk-officer at CyndiCat bank. It’s been a couple of years since your team, in your supervision, has built the auto-loans credit scorecard. Since then the overall risk assessment process for the bank has improved significantly. Though being a prudent risk manager you have asked your team to regularly compare the population for which the scorecard was built and the existing through-the-door population (applicants for auto loans). A good place to start this comparison is by checking how two populations are distributed across the risk bands created through the scorecard. The following is a representation for the latest quarterly comparison your team has performed against the benchmark sample. Here Actual %’ is the population distribution for the latest quarter and ‘Expected %’ is the population distribution for the validation sample (a.k.a. benchmark sample).

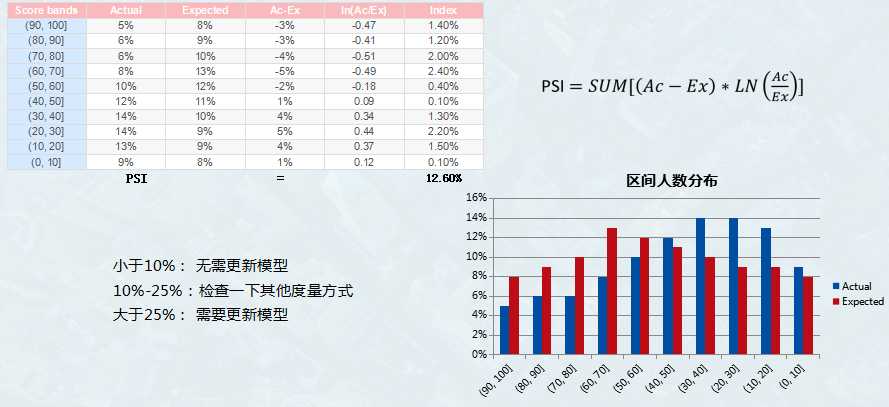
Comparing two populations visually is a good place to start. The current population seems to have shifted towards the right side of the graph. To a small extent, this is expected since scorecards often influence the through-the-door population as the market starts reacting to the approval strategies of the bank. However, the question we need to ask is whether this a major shift in the population? Essentially, you are comparing two different distributions and could use any goodness-of-fit measure such as Chi-square test. However, the population stability index is an industry-accepted metric that presents some convenient rules of thumb for the same. The population stability index (PSI) formula is displayed below (refer to ‘Credit Risk Scorecards’ by Naeem Siddiqui)

Again like the weight of evidence and the information value, PSI seems to have it’s root in information theory. Let’s calculate the population stability index (PSI) for our population (we have already seen a histogram for this above).
| Score bands | Actual % | Expected % | Ac-Ex | ln(Ac/Ex) | Index |
| < 251 | 5% | 8% | -3% | -0.47 | 0.014 |
| 251–290 | 6% | 9% | -3% | -0.41 | 0.012 |
| 291–320 | 6% | 10% | -4% | -0.51 | 0.020 |
| 321–350 | 8% | 13% | -5% | -0.49 | 0.024 |
| 351–380 | 10% | 12% | -2% | -0.18 | 0.004 |
| 381–410 | 12% | 11% | 1% | 0.09 | 0.001 |
| 411–440 | 14% | 10% | 4% | 0.34 | 0.013 |
| 441–470 | 14% | 9% | 5% | 0.44 | 0.022 |
| 471–520 | 13% | 9% | 4% | 0.37 | 0.015 |
| 520 < | 9% | 8% | 1% | 0.12 | 0.001 |
| Population Stability Index (PSI)= | 0.1269 | ||||
The last column in the above table is what we care for. Let us consider the score band 251-290 and calculate the index value for this row.

The final value for the PSI i.e. 0.13 is the sum of all the values of the last column. Now the question is how to interpret this value? The rule of thumb for the PSI is displayed below
| PSI Value | Inference | Action |
| Less than 0.1 | Insignificant change | No action required |
| 0.1 – 0.25 | Some minor change | Check other scorecard monitoring metrics |
| Greater than 0.25 | Major shift in population | Need to delve deeper |
The value of 0.13 falls in the second bucket which indicates a minor shift in population from the validation or benchmark sample. These are handy rules to have. However, one must ask, how is this population shift going to make any difference in the scorecard? Actually, it may or may not make any difference. Each score band of a scorecard has an associated bad rate or probability of customers not paying off their loans. For instance, score band 251-290 in our scorecard has a bad rate of 10% or one customer out of the population of 10 in this score band won’t service his/her loan. The population stability index simply indicates changes in the population of loan applicants. However, this may or may not result in deterioration in performance of the scorecard to predict risk. Nevertheless, the PSI indicates changes in the environment which need to be further investigated through analyzing the change in macroeconomic conditions and overall lending policies of the bank.
Sign-off Note
The population stability index is one of the metrics to keep a check on changing conditions – however, the idea is clear that one has to capture robust metrics to keep a close look on the ever changing economic winds to prevent a crash landing. On the other side, Russian winters did change the history of the planet for better – I guess change is not always for bad.
This was a bit of a detour from our previous article on books to learn probability and Bayesian statistics. Hopefully, you have got a chance to check out some of the books mentioned in the earlier article, see you soon with the second part of that article.

PSi-Population Stability Index (PSI)的更多相关文章
- 模型稳定度指标PSI与IV
由于模型是以特定时期的样本所开发的,此模型是否适用于开发样本之外的族群,必须经过稳定性测试才能得知.稳定度指标(population stability index ,PSI)可衡量测试样本及模型开发 ...
- 模型稳定性指标—PSI
由于模型是以特定时期的样本所开发的,此模型是否适用于开发样本之外的族群,必须经过稳定性测试才能得知.稳定度指标(population stability index ,PSI)可衡量测试样本及模型开发 ...
- 【转】风控中的特征评价指标(二)——PSI
转自:https://zhuanlan.zhihu.com/p/79682292 风控业务背景 在风控中,稳定性压倒一切.原因在于,一套风控模型正式上线运行后往往需要很久(通常一年以上)才会被替换下线 ...
- SQL->Python->PySpark计算KS,AUC及PSI
KS,AUC 和 PSI 是风控算法中最常计算的几个指标,本文记录了多种工具计算这些指标的方法. 生成本文的测试数据: import pandas as pd import numpy as np i ...
- python机器学习-sklearn挖掘乳腺癌细胞(一)
python机器学习-sklearn挖掘乳腺癌细胞( 博主亲自录制) 网易云观看地址 https://study.163.com/course/introduction.htm?courseId=10 ...
- Data Visualization – Banking Case Study Example (Part 1-6)
python信用评分卡(附代码,博主录制) https://study.163.com/course/introduction.htm?courseId=1005214003&utm_camp ...
- Scoring and Modeling—— Underwriting and Loan Approval Process
https://www.fdic.gov/regulations/examinations/credit_card/ch8.html Types of Scoring FICO Scores V ...
- Deformity ASP/ASPX Webshell、Webshell Hidden Learning
catalog . Active Server Page(ASP) . ASP.NET . ASP WEBSHELL变形方式 . ASPX WEBSHELL变形方式 . webshell中常见的编码转 ...
- C#--API
C#中调用API 介绍 API( Application Programming Interface ),我想大家不会陌生,它是我们Windows编程的常客,虽然基于.Net平台的C#有了强大的类库, ...
随机推荐
- hdu-2717(基础搜索bfs)
题意:给你n和k,问你n最少花费多少代价能得到k: 有两种变换:1.n++或者n--: 2.n=n*2: 两种代价每次的花费都是1: 思路:一维的bfs,每次入队三个点,一个是n+1,一个是n-1,一 ...
- GLSL 变量属性
1. attribute变量为这个attribute变量指定一个位置(用无符号值表示):glBindAttribLocation利用这个“位置”来指定需要传给shader里的attribue变量的数据 ...
- Deepfakes:AI换脸技术自制明星XX片
ps:亮瞎狗眼 去年开始就在国外网站上比较火的项目了,通过Deepfakes技术可以将视频中的人脸换成自己喜欢的明星, 当时就有不少人制作了换脸视频,其中大部分是替换了XX片的女主角. 国外网站Red ...
- Cent OS安装使用ffmpeg(完整版)
Cent OS安装使用ffmpeg centos作为主流后台linux 系统,ffmpeg作为视频流解析的主力,尤其是ffmpeg配合opencv使用,则是视觉操作的基础 版本: ffmpeg3.1 ...
- Git——简说.git目录【五】
我们都知道初始化项目时,会生成一个.git的隐藏目录,那么这个目录究竟放了那些东西呢,又有什么作用呢?现在我们就来看看. HEAD HEAD指向的是当前工作所在的分支 $ cat HEAD ref: ...
- P1064 金明的预算方案
思路:就是一个背包问题 因为数据范围小,所以不把 1个带附着物的东西 拆成 带1个带2个或不带 #include<bits/stdc++.h> using namespace std; ...
- ConnectionAbortedError: [WinError 10053] 您的主机中的软件中止了一个已建立的连接
socket服务端在接收socket客户端时抛出异常 ConnectionAbortedError: [WinError 10053] 您的主机中的软件中止了一个已建立的连接. socket服务端代码 ...
- 自学华为IoT物联网_12 Huawei LiteOS基础架构
点击返回自学华为IoT物流网 自学华为IoT物联网_12 Huawei LiteOS基础架构 一.1个Huawei LiteOS Kernel 1.1 huawei LiteOS Kernel基本框架 ...
- 对于rqy今天讲座的一些理解和看法吧
其实我本来以为今天晚上要学高数的,但是听到任大佬要来讲课,我自然是很开心. 其实真正接触到他和照片给我的感觉完全不一样,rqy是一个非常单一的,没有在意其他过多的事情的人,包括从他的讲座来看,大佬把自 ...
- [BOI2007]Mokia 摩基亚(CDQ分治)
upd:\((x1,y1)(x2,y2)\)表示以\((x1,y1)\)为左上端点 \((x2,y2)\)为右下端点的矩形 本来以为是一道二位树状数组的模板,但是看数据范围之后就放弃了,边界既然到了2 ...