Netflix Recommendations
by Xavier Amatriain and Justin Basilico (Personalization Science and Engineering)
In part one of this blog post, we detailed the different components of Netflix personalization. We also explained how Netflix personalization, and the service as a whole, have changed from the time we announced the Netflix Prize.The $1M Prize delivered a great
return on investment for us, not only in algorithmic innovation, but also in brand awareness and attracting stars (no pun intended) to join our team. Predicting movie ratings accurately is just one aspect of our world-class recommender system. In this second
part of the blog post, we will give more insight into our broader personalization technology. We will discuss some of our current models, data, and the approaches we follow to lead innovation and research in this space.
Ranking
The goal of recommender systems is to present a number of attractive items for a person to choose from. This is usually accomplished by selecting some items and sorting them in the order of expected
enjoyment (or utility). Since the most common way of presenting recommended items is in some form of list, such as the various rows on Netflix, we need an appropriate ranking model that can use a wide variety of information to come up with an optimal ranking
of the items for each of our members.
If you are looking for a ranking function that optimizes consumption, an obvious baseline is item popularity. The reason is clear: on average, a member is most likely to watch what most others are watching. However, popularity is the opposite of personalization:
it will produce the same ordering of items for every member. Thus, the goal becomes to find a personalized ranking function that is better than item popularity, so we can better satisfy members with varying tastes.
Recall that our goal is to recommend the titles that each member is most likely toplay and
enjoy. One obvious way to approach this is to use the member's predicted rating of each item as an adjunct to item popularity. Using predicted ratings on their own as a ranking function can lead to items that are too niche or unfamiliar being recommended,
and can exclude items that the member would want to watch even though they may not rate them highly. To compensate for this, rather than using either popularity or predicted rating on their own, we would like to produce rankings that balance both of these
aspects. At this point, we are ready to build a ranking prediction model using these twofeatures.
There are many ways one could construct a ranking function ranging from simple scoring methods, to pairwise preferences, to optimization over the entire ranking. For the purposes of illustration, let us start with a very simple scoring approach by choosing
our ranking function to be a linear combination of popularity and predicted rating. This gives an equation of the form
frank(u,v) = w1 p(v) + w2 r(u,v) + b,
where u=user, v=video item, p=popularity and r=predicted rating. This equation defines a two-dimensional space like the one depicted below.
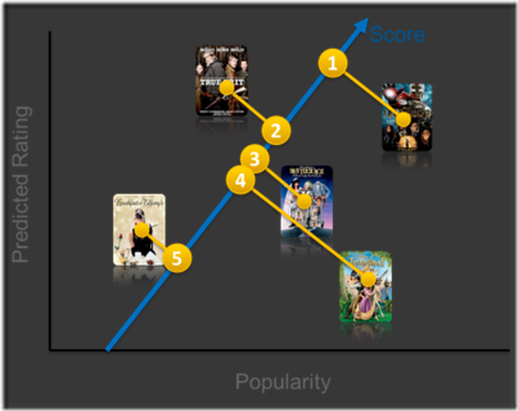
Once we have such a function, we can pass a set of videos through our function and sort them in descending order according to the score. You might be wondering how we can set the weights w1
and w2 in our model (the bias b is constant and thus ends up not affecting the final ordering). In other words, in our simple two-dimensional model, how do we determine whether popularity is more or less important than predicted rating? There are
at least two possible approaches to this. You could sample the space of possible weights and let the members decide what makes sense after many A/B tests. This procedure might be time consuming and not very cost effective. Another possible answer involves
formulating this as a machine learning problem: select positive and negative examples from your historical data and let a machine learning algorithm learn the weights that optimize your goal. This family of machine learning problems is known as "Learning
to rank" and is central to application scenarios such as search engines or ad targeting. Note though that a crucial difference in the case of ranked recommendations is the importance of personalization: we do not expect a global notion ofrelevance,
but rather look for ways of optimizing a personalized model.
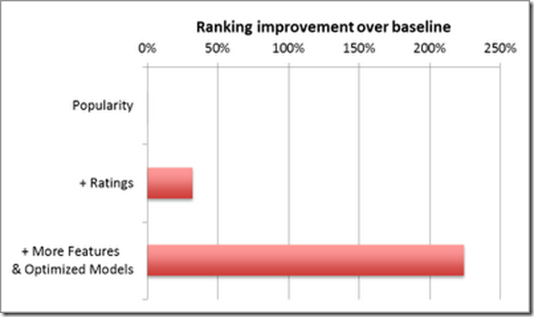
As you might guess, apart from popularity and rating prediction, we have tried many other features at Netflix. Some have shown no positive effect while others have improved our ranking accuracy tremendously. The graph below shows the ranking improvement we
have obtained by adding different features and optimizing the machine learning algorithm.
Many supervised classification methods can be used for ranking. Typical choices include Logistic Regression, Support Vector Machines, Neural Networks, or Decision Tree-based methods such as Gradient
Boosted Decision Trees (GBDT). On the other hand, a great number of algorithms specifically designed for learning to rank have appeared in recent years such as RankSVM or RankBoost. There is no easy answer to choose which model will perform best in a given
ranking problem. The simpler your feature space is, the simpler your model can be. But it is easy to get trapped in a situation where a new feature does not show value because the model cannot learn it. Or, the other way around, to conclude that a more powerful
model is not useful simply because you don't have the feature space that exploits its benefits.
Data and Models
The previous discussion on the ranking algorithms highlights the importance of bothdata and
models in creating an optimal personalized experience for our members. At Netflix, we are fortunate to have many relevant data sources and smart people who can select optimal algorithms to turn data into product features. Here are some of the
data sources we can use to optimize our recommendations:
- We have several billion itemratings from members. And we receive millions of new ratings a day.
- We already mentioned itempopularity as a baseline. But, there are many ways to compute popularity. We can compute it over various time ranges, for instance hourly, daily, or weekly.
Or, we can group members by region or other similarity metrics and compute popularity within that group. - We receive several million streamplays each day, which include context such as duration, time of day and device type.
- Our members add millions of items to theirqueues each day.
- Each item in our catalog has richmetadata: actors, director, genre, parental rating, and reviews.
- Presentations: We know what items we have recommended and where we have shown them, and can look at how that decision has affected the member's actions. We can also observe the member's
interactions with the recommendations: scrolls, mouse-overs, clicks, or the time spent on a given page. - Social data has become our latest source of personalization features; we can process what connected friends have watched or rated.
- Our members directly enter millions ofsearch terms in the Netflix service each day.
- All the data we have mentioned above comes from internal sources. We can also tap intoexternal data to improve our features. For example, we can add external item data features such
as box office performance or critic reviews. - Of course, that is not all: there are manyother features such as demographics, location, language, or temporal data that can be used in our predictive models.
So, what about the models? One thing we have found at Netflix is that with the great availability of data, both in quantity and types, a thoughtful approach is required to model selection, training,
and testing. We use all sorts of machine learning approaches: From unsupervised methods such as clustering algorithms to a number of supervised classifiers that have shown optimal results in various contexts. This is an incomplete list of methods you should
probably know about if you are working in machine learning for personalization:
- Linear regression
- Logistic regression
- Elastic nets
- Singular Value Decomposition
- Restricted Boltzmann Machines
- Markov Chains
- Latent Dirichlet Allocation
- Association Rules
- Gradient Boosted Decision Trees
- Random Forests
- Clustering techniques from the simple k-means to novel graphical approaches such as Affinity Propagation
- Matrix factorization
Consumer Data Science
The abundance of source data, measurements and associated experiments allow us to operate a data-driven organization. Netflix has embedded this approach into its culture since the company was founded,
and we have come to call it Consumer (Data) Science. Broadly speaking, the main goal of our Consumer Science approach is to innovate for members effectively. The only real failure is the failure to innovate; or as Thomas Watson Sr, founder of IBM, put it:
“If you want to increase your success rate, double your failure rate.” We strive for an innovation culture that allows us to evaluate ideas rapidly, inexpensively, and objectively. And, once we test something we want to understand why it failed or
succeeded. This lets us focus on the central goal of improving our service for our members.
So, how does this work in practice? It is a slight variation over the traditional scientific process called A/B testing (or bucket testing):
1. Start with a hypothesis
- Algorithm/feature/design X will increase member engagement with our service andultimately member retention
2. Design a test
- Develop a solution or prototype. Ideal execution can be 2X as effective as a prototype, but not 10X.
- Think about dependent & independent variables, control, significance…
3. Execute the test
4. Let data speak for itself
When we execute A/B tests, we track many different metrics. But we ultimately trust member engagement (e.g. hours of play) and retention. Tests usually have thousands of members and anywhere from 2 to 20 cells exploring variations of a base idea. We typically
have scores of A/B tests running in parallel. A/B tests let us try radical ideas or test many approaches at the same time, but the key advantage is that they allow our decisions to be data-driven. You can read more about our approach to A/B Testing in thisprevious
tech blog post or in some of the Quora answers by our Chief Product Officer Neil Hunt.
An interesting follow-up question that we have faced is how to integrate our machine learning approaches into this data-driven A/B test culture at Netflix. We have done this with an offline-online testing process that tries to combine the best of both worlds.
The offline testing cycle is a step where we test and optimize our algorithms prior to performing online A/B testing. To measure model performance offline we track multiple metrics used in the machine learning community: from ranking measures such as normalized
discounted cumulative gain, mean reciprocal rank, or fraction of concordant pairs, to classification metrics such as accuracy, precision, recall, or F-score. We also use the famous RMSE from the Netflix Prize or other moreexotic metrics to track different
aspects like diversity. We keep track of how well those metrics correlate to measurable online gains in our A/B tests. However, since the mapping is not perfect, offline performance is used only as an indication to make informed decisions on follow up tests.
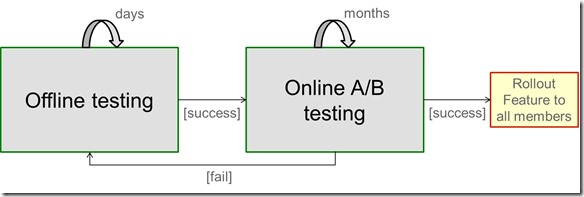
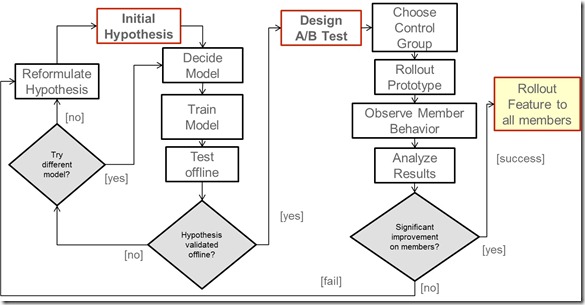
Once offline testing has validated a hypothesis, we are ready to design and launch the A/B test that will prove the new feature valid from a member perspective. If it does, we will be ready to roll
out in our continuous pursuit of the better product for our members. The diagram below illustrates the details of this process.
An extreme example of this innovation cycle is what we called the Top10 Marathon. This was a focused, 10-week effort to quickly test dozens of algorithmic ideas related to improving our Top10 row.
Think of it as a 2-month hackathon with metrics. Different teams and individuals were invited to contribute ideas and code in this effort. We rolled out 6 different ideas as A/B tests each week and kept track of the offline and online metrics. The winning
results are already part of our production system.
Conclusion
The Netflix Prize abstracted the recommendation problem to a proxy question of predicting ratings. But member ratings are only one of the many data sources we have and rating predictions are only part
of our solution. Over time we have reformulated the recommendation problem to the question of optimizing the probability a member chooses to watch a title and enjoys it enough to come back to the service. More data availability enables better results. But
in order to get those results, we need to have optimized approaches, appropriate metrics and rapid experimentation.
To excel at innovating personalization, it is insufficient to be methodical in our research; the space to explore is virtually infinite. At Netflix, we love choosing and watching movies and TV shows. We focus our research by translating this passion into strong
intuitions about fruitful directions to pursue; under-utilized data sources, better feature representations, more appropriate models and metrics, and missed opportunities to personalize. We use data mining and other experimental approaches to incrementally
inform our intuition, and so prioritize investment of effort. As with any scientific pursuit, there’s always a contribution from Lady Luck, but as the adage goes, luck favors the prepared mind. Finally, above all, we look to our members as the final judges
of the quality of our recommendation approach, because this is all ultimately about increasing our members' enjoyment in their own Netflix experience. We are always looking for more people to join our team of "prepared minds". Make sure you take a look at
our jobs page.
Tags: Xavier Amatriain,Netflix Prize,Netflix,Recommendations,Beyond,Part 2
Netflix Recommendations的更多相关文章
- 转:netflix推荐系统竞赛
原文链接:Netflix recommendations: beyond the 5 stars (Part 1), (Part 2) 原文作者:Xavier Amatriain and Justin ...
- Netflix推荐系统:从评分预测到消费者法则
http://in.sdo.com/?p=11 原文链接:Netflix recommendations: beyond the 5 stars (Part 1), (Part 2) 原文作者:Xav ...
- Building microservices with Spring Cloud and Netflix OSS, part 2
In Part 1 we used core components in Spring Cloud and Netflix OSS, i.e. Eureka, Ribbon and Zuul, to ...
- 基于Spring Cloud和Netflix OSS 构建微服务-Part 1
前一篇文章<微服务操作模型>中,我们定义了微服务使用的操作模型.这篇文章中,我们将开始使用Spring Cloud和Netflix OSS实现这一模型,包含核心部分:服务发现(Servic ...
- 基于Spring Cloud和Netflix OSS构建微服务,Part 2
在上一篇文章中,我们已使用Spring Cloud和Netflix OSS中的核心组件,如Eureka.Ribbon和Zuul,部分实现了操作模型(operations model),允许单独部署的微 ...
- 【RS】Amazon.com recommendations: item-to-item collaborative filtering - 亚马逊推荐:基于物品的协同过滤
[论文标题]Amazon.com recommendations: item-to-item collaborative filtering (2003,Published by the IEEE C ...
- 转 Netflix OSS、Spring Cloud还是Kubernetes? 都要吧!
Netflix OSS.Spring Cloud还是Kubernetes? 都要吧! http://www.infoq.com/cn/articles/netflix-oss-spring-cloud ...
- Spring-cloud & Netflix 源码解析:Eureka 服务注册发现接口 ****
http://www.idouba.net/spring-cloud-source-eureka-client-api/?utm_source=tuicool&utm_medium=refer ...
- netflix:Conductor微服务编排引擎
项目地址: https://github.com/Netflix/conductor Conductor 是 Netflix 受需要运行全球流媒体业务流程的启发,构建的基于云的微服务编排引擎. Con ...
随机推荐
- ROS(indigo) 语音工具 科大讯飞 百度 pocketsphinx julius rospeex 16.11.22更新 ROS中文语音
ROS语音工具汇总,目前先给出链接,只用过一些简单的命令. 中文语音: 参考链接:使用科大讯飞库 1 http://www.ncnynl.com/archives/201611/1069.html 2 ...
- cassandra 监控方案评估
摘要 最开始做cassandra monitor 方案的选型时,主要是从cassandra 本身入手,后来发现cassandra运行在JVM上,所有的metrics都是通过JMX 暴露出来.所以又可以 ...
- POI操作excel中的日期格式处理
转载:http://blog.csdn.net/fuxiaohui/article/details/6239925 7.3.3 POI中Excel文件Cell的类型 在读取每一个Cell的值的时候,通 ...
- 15 Actionbar的显示和隐藏
ActionBar 显示隐藏方法: 在布局文件中设置 theme主题 <?xml version="1.0" encoding="utf-8"?> ...
- sublime text3空格和tab的显示
最近在使用sublime text3修改shell文件时,明明看着相同的文件,对比却说不一样.最后发现是空格和tab惹的祸. 1.显示空格和tab: 在Preferences→Key Bindings ...
- JAVA之旅(三十一)——JAVA的图形化界面,GUI布局,Frame,GUI事件监听机制,Action事件,鼠标事件
JAVA之旅(三十一)--JAVA的图形化界面,GUI布局,Frame,GUI事件监听机制,Action事件,鼠标事件 有段时间没有更新JAVA了,我们今天来说一下JAVA中的图形化界面,也就是GUI ...
- numpy教程:快速傅里叶变换模块numpy.fft
http://blog.csdn.net/pipisorry/article/details/51050297 快速傅里叶变换 NumPy中,fft模块提供了快速傅里叶变换的功能.在这个模块中,许多函 ...
- Java-IO之CharArrayReader
CharArrayReader是字符数组输入流,CharArrayReader用于读取字符数组,继承于Reader操作的数据是以字符为单位. (1)CharArrayReader实际上是通过字符数组去 ...
- (九十)使用多个storyboard+代码实现控制器的分开管理
使用单个storyboard会使得项目难与管理,使用纯代码又会过于麻烦,因此如果能将二者结合起来,并且使用多个storyboard,会使得项目简单简单.方便许多. 下面以一个简单的视图关系为例,介绍多 ...
- StarUML中InteractionOperation的画法
StarUML画InteractionOperation的方法:http://stackoverflow.com/questions/16152278/using-alt-in-sequence-di ...