机器学习作业(八)异常检测与推荐系统——Matlab实现
题目下载【传送门】
第1题
简述:对于一组网络数据进行异常检测.
第1步:读取数据文件,使用高斯分布计算 μ 和 σ²:
- % The following command loads the dataset. You should now have the
- % variables X, Xval, yval in your environment
- load('ex8data1.mat');
- % Estimate my and sigma2
- [mu sigma2] = estimateGaussian(X);
其中高斯分布计算函数estimateGaussian:
- function [mu sigma2] = estimateGaussian(X)
- % Useful variables
- [m, n] = size(X);
- % You should return these values correctly
- mu = zeros(n, 1);
- sigma2 = zeros(n, 1);
- mu = mean(X);
- sigma2 = var(X, 1);
- % mu = mu';
- % sigma2 = sigma2';
- end
第2步:计算概率p(x):
- % Returns the density of the multivariate normal at each data point (row)
- % of X
- p = multivariateGaussian(X, mu, sigma2);
其中概率计算函数
- function p = multivariateGaussian(X, mu, Sigma2)
- k = length(mu);
- if (size(Sigma2, 2) == 1) || (size(Sigma2, 1) == 1)
- Sigma2 = diag(Sigma2);
- end
- X = bsxfun(@minus, X, mu(:)');
- p = (2 * pi) ^ (- k / 2) * det(Sigma2) ^ (-0.5) * ...
- exp(-0.5 * sum(bsxfun(@times, X * pinv(Sigma2), X), 2));
- end
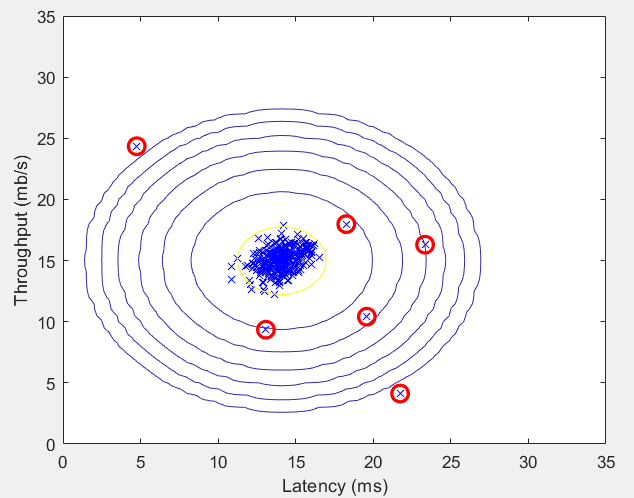
第3步:可视化数据,并绘制概率等高线:
- % Visualize the fit
- visualizeFit(X, mu, sigma2);
- xlabel('Latency (ms)');
- ylabel('Throughput (mb/s)');
其中visualizeFit函数:
- function visualizeFit(X, mu, sigma2)
- [X1,X2] = meshgrid(0:.5:35);
- Z = multivariateGaussian([X1(:) X2(:)],mu,sigma2);
- Z = reshape(Z,size(X1));
- plot(X(:, 1), X(:, 2),'bx');
- hold on;
- % Do not plot if there are infinities
- if (sum(isinf(Z)) == 0)
- contour(X1, X2, Z, 10.^(-20:3:0)');
- end
- hold off;
- end
运行结果:

第4步:使用交叉验证集选出最佳参数 ε:
- pval = multivariateGaussian(Xval, mu, sigma2);
- [epsilon F1] = selectThreshold(yval, pval);
- fprintf('Best epsilon found using cross-validation: %e\n', epsilon);
- fprintf('Best F1 on Cross Validation Set: %f\n', F1);
其中selectThreshold函数:
- function [bestEpsilon bestF1] = selectThreshold(yval, pval)
- bestEpsilon = 0;
- bestF1 = 0;
- F1 = 0;
- stepsize = (max(pval) - min(pval)) / 1000;
- for epsilon = min(pval):stepsize:max(pval)
- predictions = pval < epsilon;
- tp = sum(predictions .* yval);
- prec = tp / sum(predictions);
- rec = tp / sum(yval);
- F1 = 2 * prec * rec / (prec + rec);
- if F1 > bestF1
- bestF1 = F1;
- bestEpsilon = epsilon;
- end
- end
- end
运行结果:
第5步:找出异常点,并可视化标记:
- % Find the outliers in the training set and plot the
- outliers = find(p < epsilon);
- % Draw a red circle around those outliers
- hold on
- plot(X(outliers, 1), X(outliers, 2), 'ro', 'LineWidth', 2, 'MarkerSize', 10);
- hold off
运行结果:
第2题
简述:实现电影推荐系统
第1步:读取数据文件(截取较少的数据):
- % Load data
- load ('ex8_movies.mat');
- % Y is a 1682x943 matrix, containing ratings (1-5) of 1682 movies on
- % 943 users
- %
- % R is a 1682x943 matrix, where R(i,j) = 1 if and only if user j gave a
- % rating to movie i
- % Load pre-trained weights (X, Theta, num_users, num_movies, num_features)
- load ('ex8_movieParams.mat');
- % Reduce the data set size so that this runs faster
- num_users = 4; num_movies = 5; num_features = 3;
- X = X(1:num_movies, 1:num_features);
- Theta = Theta(1:num_users, 1:num_features);
- Y = Y(1:num_movies, 1:num_users);
- R = R(1:num_movies, 1:num_users);
第2步:计算代价函数和梯度:
- J = cofiCostFunc([X(:) ; Theta(:)], Y, R, num_users, num_movies, ...
- num_features, 1.5);
其中cofiCostFunc函数:
- function [J, grad] = cofiCostFunc(params, Y, R, num_users, num_movies, ...
- num_features, lambda)
- % Unfold the U and W matrices from params
- X = reshape(params(1:num_movies*num_features), num_movies, num_features);
- Theta = reshape(params(num_movies*num_features+1:end), ...
- num_users, num_features);
- % You need to return the following values correctly
- J = 0;
- X_grad = zeros(size(X));
- Theta_grad = zeros(size(Theta));
- cost = (X * Theta' - Y) .* R;
- J = 1 / 2 * sum(sum(cost .^ 2));
- J = J + lambda / 2 * (sum(sum(Theta .^ 2)) + sum(sum(X .^ 2)));
- X_grad = cost * Theta;
- X_grad = X_grad + lambda * X;
- Theta_grad = X' * cost;
- Theta_grad = Theta_grad' + lambda * Theta;
- grad = [X_grad(:); Theta_grad(:)];
- end
第3步:进行梯度检测:
- % Check gradients by running checkNNGradients
- checkCostFunction(1.5);
其中checkCostFunction函数:
- function checkCostFunction(lambda)
- % Set lambda
- if ~exist('lambda', 'var') || isempty(lambda)
- lambda = 0;
- end
- %% Create small problem
- X_t = rand(4, 3);
- Theta_t = rand(5, 3);
- % Zap out most entries
- Y = X_t * Theta_t';
- Y(rand(size(Y)) > 0.5) = 0;
- R = zeros(size(Y));
- R(Y ~= 0) = 1;
- %% Run Gradient Checking
- X = randn(size(X_t));
- Theta = randn(size(Theta_t));
- num_users = size(Y, 2);
- num_movies = size(Y, 1);
- num_features = size(Theta_t, 2);
- numgrad = computeNumericalGradient( ...
- @(t) cofiCostFunc(t, Y, R, num_users, num_movies, ...
- num_features, lambda), [X(:); Theta(:)]);
- [cost, grad] = cofiCostFunc([X(:); Theta(:)], Y, R, num_users, ...
- num_movies, num_features, lambda);
- disp([numgrad grad]);
- fprintf(['The above two columns you get should be very similar.\n' ...
- '(Left-Your Numerical Gradient, Right-Analytical Gradient)\n\n']);
- diff = norm(numgrad-grad)/norm(numgrad+grad);
- fprintf(['If your cost function implementation is correct, then \n' ...
- 'the relative difference will be small (less than 1e-9). \n' ...
- '\nRelative Difference: %g\n'], diff);
- end
其中computeNumericalGradient函数:
- function numgrad = computeNumericalGradient(J, theta)
- numgrad = zeros(size(theta));
- perturb = zeros(size(theta));
- e = 1e-4;
- for p = 1:numel(theta)
- % Set perturbation vector
- perturb(p) = e;
- loss1 = J(theta - perturb);
- loss2 = J(theta + perturb);
- % Compute Numerical Gradient
- numgrad(p) = (loss2 - loss1) / (2*e);
- perturb(p) = 0;
- end
- end
第4步:对某一用户进行预测,初始化用户的信息:
- movieList = loadMovieList();
- % Initialize my ratings
- my_ratings = zeros(1682, 1);
- my_ratings(1) = 4;
- my_ratings(98) = 2;
- my_ratings(7) = 3;
- my_ratings(12)= 5;
- my_ratings(54) = 4;
- my_ratings(64)= 5;
- my_ratings(66)= 3;
- my_ratings(69) = 5;
- my_ratings(183) = 4;
- my_ratings(226) = 5;
- my_ratings(355)= 5;
其中loadMovieList函数:
- function movieList = loadMovieList()
- %% Read the fixed movieulary list
- fid = fopen('movie_ids.txt');
- % Store all movies in cell array movie{}
- n = 1682; % Total number of movies
- movieList = cell(n, 1);
- for i = 1:n
- % Read line
- line = fgets(fid);
- % Word Index (can ignore since it will be = i)
- [idx, movieName] = strtok(line, ' ');
- % Actual Word
- movieList{i} = strtrim(movieName);
- end
- fclose(fid);
- end
第5步:将新用户增加到数据集中:
- % Load data
- load('ex8_movies.mat');
- % Y is a 1682x943 matrix, containing ratings (1-5) of 1682 movies by
- % 943 users
- %
- % R is a 1682x943 matrix, where R(i,j) = 1 if and only if user j gave a
- % rating to movie i
- % Add our own ratings to the data matrix
- Y = [my_ratings Y];
- R = [(my_ratings ~= 0) R];
第6步:均值归一化:
- % Normalize Ratings
- [Ynorm, Ymean] = normalizeRatings(Y, R);
其中normalizeRatings函数:
- function [Ynorm, Ymean] = normalizeRatings(Y, R)
- [m, n] = size(Y);
- Ymean = zeros(m, 1);
- Ynorm = zeros(size(Y));
- for i = 1:m
- idx = find(R(i, :) == 1);
- Ymean(i) = mean(Y(i, idx));
- Ynorm(i, idx) = Y(i, idx) - Ymean(i);
- end
- end
第7步:实现梯度下降,训练模型:
- % Useful Values
- num_users = size(Y, 2);
- num_movies = size(Y, 1);
- num_features = 10;
- % Set Initial Parameters (Theta, X)
- X = randn(num_movies, num_features);
- Theta = randn(num_users, num_features);
- initial_parameters = [X(:); Theta(:)];
- % Set options for fmincg
- options = optimset('GradObj', 'on', 'MaxIter', 100);
- % Set Regularization
- lambda = 10;
- theta = fmincg (@(t)(cofiCostFunc(t, Ynorm, R, num_users, num_movies, ...
- num_features, lambda)), ...
- initial_parameters, options);
- % Unfold the returned theta back into U and W
- X = reshape(theta(1:num_movies*num_features), num_movies, num_features);
- Theta = reshape(theta(num_movies*num_features+1:end), ...
- num_users, num_features);
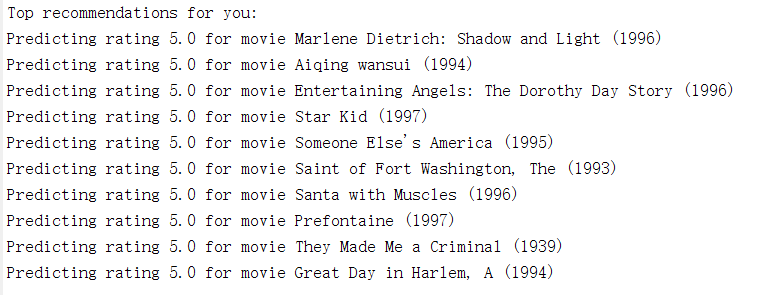
第8步:实现推荐功能:
- p = X * Theta';
- my_predictions = p(:,1) + Ymean;
- movieList = loadMovieList();
- [r, ix] = sort(my_predictions, 'descend');
- fprintf('\nTop recommendations for you:\n');
- for i=1:10
- j = ix(i);
- fprintf('Predicting rating %.1f for movie %s\n', my_predictions(j), ...
- movieList{j});
- end
运行结果:
机器学习作业(八)异常检测与推荐系统——Matlab实现的更多相关文章
- 基于机器学习的web异常检测
基于机器学习的web异常检测 Web防火墙是信息安全的第一道防线.随着网络技术的快速更新,新的黑客技术也层出不穷,为传统规则防火墙带来了挑战.传统web入侵检测技术通过维护规则集对入侵访问进行拦截.一 ...
- 基于机器学习的web异常检测——基于HMM的状态序列建模,将原始数据转化为状态机表示,然后求解概率判断异常与否
基于机器学习的web异常检测 from: https://jaq.alibaba.com/community/art/show?articleid=746 Web防火墙是信息安全的第一道防线.随着网络 ...
- 机器学习作业(七)非监督学习——Matlab实现
题目下载[传送门] 第1题 简述:实现K-means聚类,并应用到图像压缩上. 第1步:实现kMeansInitCentroids函数,初始化聚类中心: function centroids = kM ...
- 机器学习作业(二)逻辑回归——Matlab实现
题目太长啦!文档下载[传送门] 第1题 简述:实现逻辑回归. 第1步:加载数据文件: data = load('ex2data1.txt'); X = data(:, [1, 2]); y = dat ...
- Andrew Ng机器学习课程笔记--week9(上)(异常检测&推荐系统)
本周内容较多,故分为上下两篇文章. 一.内容概要 1. Anomaly Detection Density Estimation Problem Motivation Gaussian Distrib ...
- 【原】Coursera—Andrew Ng机器学习—课程笔记 Lecture 15—Anomaly Detection异常检测
Lecture 15 Anomaly Detection 异常检测 15.1 异常检测问题的动机 Problem Motivation 异常检测(Anomaly detection)问题是机器学习算法 ...
- Stanford机器学习---第十一讲.异常检测
之前一直在看Standford公开课machine learning中Andrew老师的视频讲解https://class.coursera.org/ml/class/index 同时配合csdn知名 ...
- 【原】Coursera—Andrew Ng机器学习—Week 9 习题—异常检测
[1]异常检测 [2]高斯分布 [3]高斯分布 [4] 异常检测 [5]特征选择 [6] [7]多变量高斯分布 Answer: ACD B 错误.需要矩阵Σ可逆,则要求m>n 测验1 Answ ...
- 斯坦福机器学习视频笔记 Week9 异常检测和高斯混合模型 Anomaly Detection
异常检测,广泛用于欺诈检测(例如“此信用卡被盗?”). 给定大量的数据点,我们有时可能想要找出哪些与平均值有显着差异. 例如,在制造中,我们可能想要检测缺陷或异常. 我们展示了如何使用高斯分布来建模数 ...
随机推荐
- java 入门如何设计类
2019/12/24 | 在校大二上学期 | 太原科技大学 初学java后,我们会发现java难点不在于Java语法难学,而是把我们挂在了如何设计类的“吊绳”上了.这恰恰也是小白 ...
- Windows server 2012 出现大量无名已断开连接用户清楚办法
打开cmd命令窗口,执行 taskkill /f /im winlogon.exe /t
- 软链接和硬链接——Linux中的文件共享
硬链接(Hard Link)和软链接也称为符号链接(Symbolic Link)的目的是为了解决文件的共享使用问题.要阐明其原理,必须先理解Linux的文件存储方式. 索引结点 Linux是一个UNI ...
- opencv —— minEnclosingCircle、fitEllipse 寻找包裹轮廓的最小圆、点集拟合椭圆
寻找包裹轮廓的最小圆:minEnclosingCircle 函数 返回圆应满足:① 轮廓上的点均在圆形空间内.② 没有面积更小的满足条件的圆. void minEnclosingCircle(Inpu ...
- Lucene之查询索引
Query子类 TermQuery:根据域和关键词进行搜索 /** * termQuery根据域和关键词进行搜索 */ @Test public void termQuery() throws IOE ...
- 后端跨域的N种方法
简单来说,CORS是一种访问机制,英文全称是Cross-Origin Resource Sharing,即我们常说的跨域资源共享,通过在服务器端设置响应头,把发起跨域的原始域名添加到Access-Co ...
- Mac 下如何判断 WIFI 的极限传输速度还有信号强度?
每当你加入一个无线网络后,按住Option键并点击屏幕右上角的Wi-Fi图标,就会发现除了平常的各种网络外,还出现了关于网络连接技术细节的列表. 比如说,如果想知道信号强度的信息,则需要尤其关注列表中 ...
- ADO.NET事务封装
在数据库工具类编写的过程中,对事务的处理操作想避免各个原子操作的事务对象赋值重复操作,想对外暴露的方法为如下形式 public bool ExecuteTransition(Action Transi ...
- day 9 深浅拷贝
浅copy 现有数据 data = { "name":"alex", "age":18, "scores":{ &quo ...
- EPEL添加与删除
EPEL简介 EPEL的全称叫 Extra Packages for Enterprise Linux,由Fedora社区打造,如它的全称,这是一个为红帽系列及衍生发行版如CentOS.Fedora提 ...