matplotlib画图——条形图
一.单条
import numpy as np

import matplotlib.pyplot as plt

N = 5

y1 = [20, 10, 30, 25, 15]

y2 = [15, 14, 34 ,10,5]

index = np.arange(5)

bar_width = 0.3

plt.bar(index , y1, width=0.3 , color='y')

plt.bar(index , y2, width=0.3 , color='b' ,bottom=y1)

plt.show()

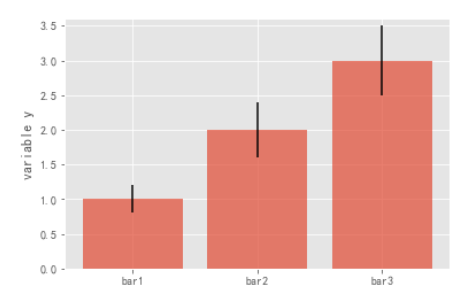
二.误差棒
mean_values = [1,2,3]

#误差范围

variance = [0.2,0.4,0.5]

bar_label = ['bar1','bar2','bar3']

x_pos = list(range(len(bar_label)))

plt.bar(x_pos,mean_values,yerr=variance,alpha=0.7)

max_y = max(zip(mean_values,variance))

plt.ylim([0,max_y[0]+max_y[1]*1.2])

plt.ylabel('variable y')

plt.xticks(x_pos,bar_label)

plt.show()
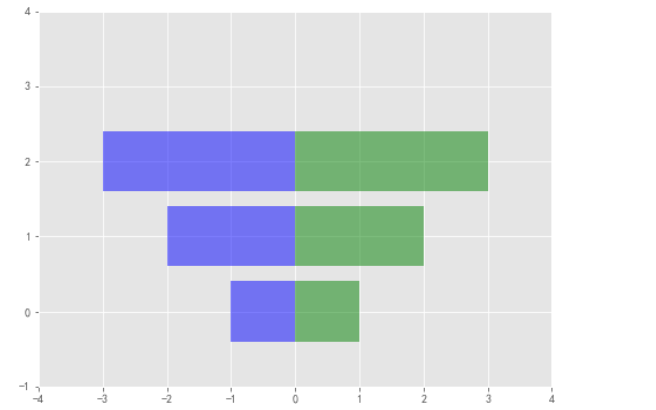
三.背靠背
x1 = np.array([1,2,3])

x2 = np.array([2,2,3])

bar_labels = ['bar1','bar2','bar3']

fig = plt.figure(figsize=(8,6))

y_pos = np.arange(len(x1))

y_pos = [x for x in y_pos]

#bar竖着 barh横着

plt.barh(y_pos,x1,color='g',alpha=0.5)

plt.barh(y_pos,-x1,color='b',alpha=0.5)

#x y轴范围限制

plt.xlim(-max(x2)-1,max(x1)+1)

plt.ylim(-1,len(x1)+1)

plt.show()
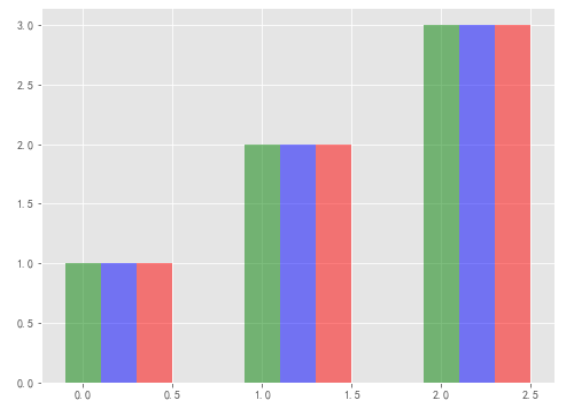
四.三条
green_data = [1,2,3]

blue_data = [3,2,1]

red_data = [2,3,1]

labels = ['group 1','group 2','group 3']

pos = list(range(len(green_data)))

width = 0.2

fig,ax = plt.subplots(figsize=(8,6))

plt.bar(pos, green_data,width,alpha=0.5,color='g',label=labels[0])

plt.bar([p+width for p in pos], green_data,width,alpha=0.5,color='b',label=labels[1])

plt.bar([p+width*2 for p in pos], green_data,width,alpha=0.5,color='r',label=labels[2])

plt.show()
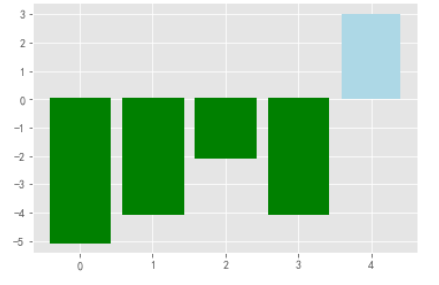
五.正负
x = np.arange(5)

#(-5,5)随机五个数

y = np.random.randint(-5,5,5)

fig,ax = plt.subplots()

v_bars = ax.bar(x,y,color='lightblue')

for bar,height in zip(v_bars,y):

    if height < 0:

        bar.set(edgecolor = 'darkred', color = 'green', linewidth = 3)
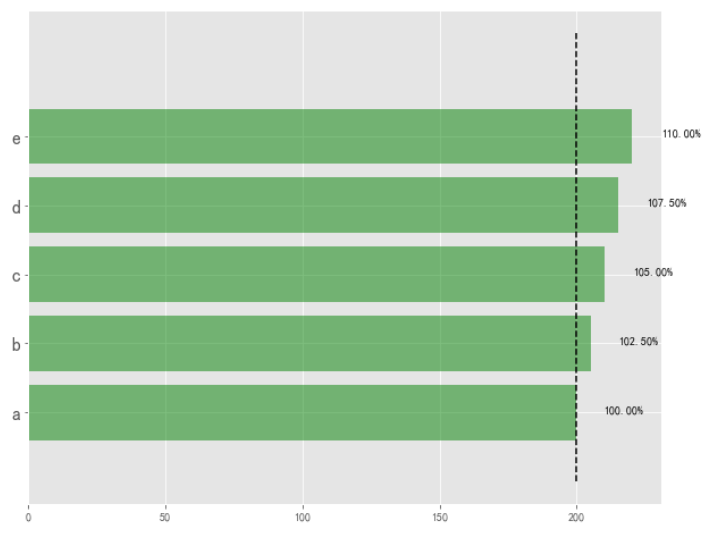
六.标线
#随机五个数

data = range(200,225,5)

#坐标标注

bar_labels = ['a','b','c','d','e']

#条形的长宽

fig = plt.figure(figsize=(10,8))

#5个

y_pos = np.arange(len(data))

plt.yticks(y_pos, bar_labels, fontsize=16)

bars = plt.barh(y_pos,data,alpha = 0.5,color = 'g')

#按照最小值的位置画垂直的竖线

plt.vlines(min(data), -1, len(data)+0.5,linestyles='dashed')

#把值写到后面

for b,d in zip(bars,data):

    plt.text(b.get_width() + b.get_width()*0.05,

             b.get_y()+b.get_height()/2,

             '{0:.2%}'.format(d/min(data)))

plt.show()
另:折线填充
x = np.random.randn(100).cumsum()

y = np.linspace(0,10,100)

fig,ax = plt.subplots()

#折线图填充

ax.fill_between(x,y,color='lightblue')

x = np.linspace(0,10,200)

y1 = 2*x + 1

y2 = 3*x +1.2

y_mean = 0.5*x*np.cos(2*x) + 2.5*x + 1.1

fig,ax = plt.subplots()

ax.fill_between(x,y1,y2,color='red')

ax.plot(x,y_mean,color='black')

matplotlib画图——条形图的更多相关文章
- python matplotlib画图产生的Type 3 fonts字体没有嵌入问题
ScholarOne's 对python matplotlib画图产生的Type 3 fonts字体不兼容,更改措施: 在程序中添加如下语句 import matplotlib matplotlib. ...
- 使用python中的matplotlib 画图,show后关闭窗口,继续运行命令
使用python中的matplotlib 画图,show后关闭窗口,继续运行命令 在用python中的matplotlib 画图时,show()函数总是要放在最后,且它阻止命令继续往下运行,直到1.0 ...
- matplotlib 画图
matplotlib 画图 1. 画曲线图 Tompson = np.array([0, 0, 0, 0, 0.011, 0.051, 0.15, 0.251, 0.35, 0.44, 0 ...
- matplotlib画图
matplotlib画图 import numpy as np import matplotlib.pyplot as plt x1=[20,33,51,79,101,121,132,145,162, ...
- python3 使用matplotlib画图出现中文乱码的情况
python3使用matplotlib画图,因python3默认使用中unicode编码,所以在写代码时不再需要写 plt.xlabel(u’人数’),而是直接写plt.xlabel(‘人数’). 注 ...
- matplotlib画图实例:pyplot、pylab模块及作图參数
http://blog.csdn.net/pipisorry/article/details/40005163 Matplotlib.pyplot画图实例 {使用pyplot模块} matplotli ...
- python使用matplotlib画图
python使用matplotlib画图 matplotlib库是python最著名的画图库.它提供了一整套和matlab类似的命令API.十分适合交互式地进行制图. 先介绍了怎样使用matplotl ...
- matplotlib画图报错This figure includes Axes that are not compatible with tight_layout, so results might be incorrect.
之前用以下代码将实验结果用matplotlib show出来 plt.plot(np.arange(len(aver_reward_list)), aver_reward_list) plt.ylab ...
- matplotlib画图出现乱码情况
python3使用matplotlib画图,因python3默认使用中unicode编码,所以在写代码时不再需要写 plt.xlabel(u’人数’),而是直接写plt.xlabel(‘人数’). 注 ...
随机推荐
- Luogu P1631 序列合并
题目 开一个堆,先把所有\(a[i]+b[1]\)压进优先队列. 然后每次把最小的取出来,把对应的\(a[i]\)的下一个\(b[j]\)拿出来加进去. #include<bits/stdc++ ...
- vim中代码按照行对齐。
在vim下, 用命令v, 然后移动光标,选种你的文本, 然后按下=键, 看看效果如何吧.
- 使用procedump捕获未处理异常的dump
-ma full memory dump, always do this on 2003 as 4gb is not much and it is good to have the heap -mp ...
- vue在组件中使用v-model
<!DOCTYPE html> <html lang="en"> <head> <meta charset="UTF-8&quo ...
- asp.net WebApi WebApiConfig.cs Web API 配置和服务
public static void Register(HttpConfiguration config) { ............................... var jsonSett ...
- [StructLayout(LayoutKind.Sequential) ] 是什么意思
首先介绍一下 结构体和类的区别 :类是按引用传递 结构体是按值传递进入正题:结构体是由若干成员组成的.布局有两种1.Sequential,顺序布局,比如struct S1{int a;int b;}那 ...
- Atcoder Regular 097 相邻球交换目的递增DP
A /*Huyyt*/ #include<bits/stdc++.h> #define mem(a,b) memset(a,b,sizeof(a)) #define pb push_bac ...
- ROPE
#include <ext/rope> using namespace __gnu_cxx; ]; rope<int> x; rope<int> x(a,a + n ...
- 安装kibana可视化平台工具
1.安装kibana 命令: wget https://artifacts.elastic.co/downloads/kibana/kibana-5.5.0-linux-x86_64.tar.gz ...
- DataWorks参数配置
https://help.aliyun.com/document_detail/30281.html?spm=a2c6h.13066369.0.0.7bef69daI5ajKt