vue用echarts 画3d地球 且画线
页面效果如下:

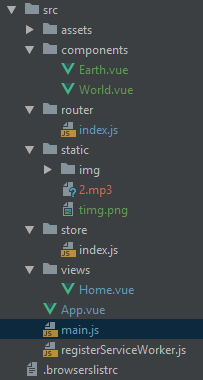
项目结构如下:

引入的包
"dependencies": {

    "core-js": "^3.3.2",

    "register-service-worker": "^1.6.2",

    "vue": "^2.6.10",

    "vue-aplayer": "^1.6.1",

    "vue-router": "^3.1.3",

    "vuex": "^3.0.1",

    "echarts": "^4.4.0",

    "echarts-gl": "^1.1.1",

    "element-ui": "^2.11.1"

  },
地球的页面
<template>

    <div class="earthmap" id="earth">

    </div>

</template>

<script>

    import echarts from 'echarts'

    import 'echarts/map/js/world.js'

    import 'echarts-gl'

    export default {

        data(){

            return{

                mapChart:{},

                //立体球形纹路

                option :{

                    globe: {

                        globeRadius: ,

                        baseTexture: '',//贴图 球形和平面的吻合

                        silent: true,

                        environment: require("../static/img/background.jpg"), //背景

                        heightTexture: require("../static/img/map.jpg"), //地球的整个纹路

                        shading: 'realistic',

                        light: {

                            main: {

                                color: '#fff',

                                intensity: ,

                                shadow: false,

                                shadowQuality: 'high',

                                alpha: ,

                                beta:

                            },

                            ambient: {

                                color: '#fff',

                                intensity:

                            }

                        },

                        postEffect: {

                            enable: false,

                            SSAO: {

                                enable: true,

                                radius:

                            }

                        },

                        //地球是否自己转动 autoRotate为true时自己转动

                        viewControl: {

                            autoRotate: true,

                            animationDurationUpdate: ,

                            targetCoord: ''

                        }

                    },

                    series: [

                       /* {

                            type: 'scatter3D',

                            coordinateSystem: 'globe',

                            blendMode: 'lighter',

                            symbolSize: 20,

                            symbol: 'pin',

                            silent: false,

                            itemStyle: {

                                color: function (params) {

                                    var colorList = ['rgb(246, 153, 180)', 'rgb(118,77,209)'];

                                    if (params.dataIndex % 2 != 0) {

                                        return colorList[0]

                                    } else {

                                        return colorList[1]

                                    }

                                },

                                opacity: 1

                            },

                            label: {

                                show: true,

                                textStyle: {

                                    fontSize: 20

                                },

                                formatter: function (params) {

                                    if (params.dataIndex % 2 != 0) {

                                        return 'Destination:\n' + params.name

                                    } else {

                                        return 'Departure:\n' + params.name

                                    }

                                },

                                position: 'top'

                            }

                        }*/

                        {

                            name: 'lines3D',

                            type: 'lines3D',

                            coordinateSystem: 'globe',

                            effect: {

                                show: true,

                                period: ,

                                trailWidth: ,

                                trailLength: 0.5,

                                trailOpacity: ,

                                trailColor: '#0087f4'

                            },

                            blendMode: 'lighter',

                            lineStyle: {

                                width: ,

                                color: '#0087f4',

                                opacity:

                            },

                            data: [],

                            silent: false,

                        }

                    ]

                },

                //平面地球 主要是设置地球的样式

                mapOption: {

                    backgroundColor: 'rgba(20,104,121,0.71)',//当和立体球形贴图是海洋的颜色

                    visualMap: {

                        show: false,

                        min: ,

                        max:

                    },

                    series: [

                        {

                            type: 'map',

                            map: 'world',

                            left: ,

                            top: ,

                            right: ,

                            bottom: ,

                            environment: 'rgba(0,0,0,0)',

                            boundingCoords: [

                                [-, ],

                                [, -]

                            ],

                            itemStyle: {

                                normal: {

                                    borderWidth: ,

                                    borderColor: 'rgb(0,232,232)',//地球纹路的颜色

                                    areaColor: {

                                        type: 'linear',

                                        x: ,

                                        y: ,

                                        x2: ,

                                        y2: ,

                                        //相邻每个板块 从上到下的颜色变化

                                        colorStops: [{

                                            offset: 0.2, color: 'rgb(0,48,62)' // 0% 处的颜色

                                        }, {

                                            offset: 0.8, color: 'rgba(0,179,188,0.8)' // 100% 处的颜色

                                        }],

                                        global: false // 缺省为 false

                                    },

                                }

                            }

                        }

                    ]

                }

            }

        },

        mounted(){

            this.initMap()

        },

        methods:{

             initMap(){

                 this.mapChart = echarts.init(document.createElement('canvas'), null, {

                     width: ,

                     height:

                 });

                 //获取容器并对其初始化

                 this.myChart = echarts.init(document.getElementById('earth'))

                 //将平面地球和立体球形的纹路重叠

                 this.mapChart.setOption(this.mapOption)

                 this.option.globe.baseTexture = this.mapChart

                 //随机划多条线

                 for (let i = ; i < ; i++) {

                     this.option.series[].data = this.option.series[].data.concat(this.rodamData())

                 }

                 this.myChart.setOption(this.option);

                // this.myChart.setOption(this.mapOption);// 平面展开图

             },

            //调用划线方法

            rodamData() {

                //let name = '随机点' + Math.random().toFixed(5) * 100000

                // let longitude = Math.random() * 62 + 73

                let longitude = 105.18

                let longitude2 = Math.random() *  -

                // let latitude = Math.random() * 50 + 3.52

                let latitude = 37.51

                let latitude2 = Math.random() *  -

                return {

                    coords: [

                        [longitude2, latitude2],

                        [longitude, latitude]

                    ],

                    value: (Math.random() * ).toFixed()

                }

            }

    }

    }

</script>

<style>

    .earthmap{

        width: %;

        height: 700px;

        background: rgba(, , , 0.39);

    }

</style>
统一的页面 home.vue
<template>

    <div class="home">

        <div style="width: 100%;height: 100%">

            <Earth></Earth>

        </div>

    </div>

</template>

<script>

    import Earth from "@/components/Earth";

    export default {

        components: {

            Earth

        },

        data() {

            return {

            }

        }

    };

</script>
首页 App.vue
<template>

    <div id="app">

        <Home/>

        <router-view/>

    </div>

</template>

<script>

    import Home from '@/views/Home'

    export default {

        components: {

            Home

        }

    }

</script>

<style lang="less">

    #app {

        font-family: "Avenir", Helvetica, Arial, sans-serif;

        -webkit-font-smoothing: antialiased;

        -moz-osx-font-smoothing: grayscale;

        text-align: center;

        color: #2c3e50;

        width: %;

        height:%;

    }

</style>
vue用echarts 画3d地球 且画线的更多相关文章
- WPF用SkewTransform画3D柱状图
WPF用SkewTransform画3D柱状图 SkewTransform主要是对控件实现一种2-D扭曲,具体内容可以查看以下链接: http://msdn.microsoft.com/zh-cn/l ...
- Vue+WebSocket+ES6+Canvas 制作「你画我猜」小游戏
Vue+WebSocket+ES6+Canvas 制作「你画我猜」小游戏 转载 来源:jrainlau 链接:https://segmentfault.com/a/1190000005804860 项 ...
- 用ChemDraw画3D图的方法
在绘制化学图形的时候,很多的用户都会发现很多的图形都是三维的,这个时候就需要找一款能够绘制3D图形的化学绘图软件.ChemOffice 15.1是最新的化学绘图工具套件,总共有三个组件,其中ChemD ...
- Css3动画(一) 如何画3D旋转效果或者卫星围绕旋转效果
如何画3D旋转效果或者卫星围绕旋转效果,当然这个也是工作中的一个任务,我在网上翻了一下,并没有找到类似的东西,所以写下来还是费了一番功夫,因此我把它拿出来记录一下,当然替换了一部分内容.好了,话不多说 ...
- python 画3D的高斯曲线
用python画3D的高斯曲线,我想如果有多个峰怎么画? import numpy as npimport matplotlib.pyplot as pltimport mathimport mpl_ ...
- 菱形实现气泡Bubble,菱形画箭头,菱形画三角形
菱形实现气泡Bubble,菱形画箭头,菱形画三角形 >>>>>>>>>>>>>>>>>>&g ...
- WPF 如何画出1像素的线
如何有人告诉你,请你画出1像素的线,是不是觉得很简单,实际上在 WPF 上还是比较难的. 本文告诉大家,如何让画出的线不模糊 画出线的第一个方法,创建一个 Canvas ,添加一个线 界面代码 < ...
- Vue使用Echarts以及Echarts配置分享
一.本篇文章将给大家分享如何在vue中使用echart以及echart各项配置,这些配置都是工作中比较常见以及常用到的,所以给大家分享下,希望对大家有用. 二.vue中使用echart. 1.首先下载 ...
- 用python做数字油画或者从一幅画学习风格,去画另一幅画
1. 用python做数字油画 模块: pillow 2. 从一幅画学习风格,去画另一幅画 http://pytorch.org/tutorials/advanced/neural_style_tut ...
随机推荐
- [Google Guava] 8-区间
原文链接 译文链接 译文:沈义扬 范例 1 List scores; 2 Iterable belowMedian =Iterables.filter(scores,Range.lessThan(me ...
- 类对象传输到jsp页面。需要转换为js的json对象时,这么做。
场景:要从一个列表中选择信息,填写入父页面的表单中,但是字段非常多... 后台查询,得到结果,放在列表中. 效果:点击选择产品.. 弹出页面:点击后面的选择产品 选择产品后:信息自动填充.. 实现:点 ...
- django post请求 403错误解决方法
--摘 第一次用Django做项目,遇到了很多问题. 今天遇到的问题是Django在处理post请求时多次出现403错误. 我先描述一下问题出现的环境:我用Django写了一个web服务端,姑且称它为 ...
- springboot与springcloud区别:
- PostMan的详细介绍
无论是接口调试还是接口测试,postman都算的上很优秀的工具,好多接口测试平台.接口测试工具框架的设计也都能看到postman的影子,我们真正了解了这款工具,才可以在这个基础上进行自己的设计和改造. ...
- MONGODB 数据库回复备份
1.导出工具:mongoexport 1.概念: mongoDB中的mongoexport工具可以把一个collection导出成JSON格式或CSV格式的文件.可以通过参数指 ...
- OAuth2.0的四种授权模式
1.什么是OAuth2 OAuth(开放授权)是一个开放标准,允许用户授权第三方移动应用访问他们存储在另外的服务提供者上的信息,而不需要将用户名和密码提供给第三方移动应用或分享他们数据的所有内容,OA ...
- DQL:查询表中数据
1. 基础查询 (1) 查询整表 SELECT * FROM 表名; -- 不推荐使用"*",不方便阅读 (2) 选择性查询 SELECT 列名,列名,列名 FROM 表名; (3 ...
- 重读APUE(15)-pthread_cond_wait与while循环
即使pthead_cond_wait()和pthread_cond_timewait()没有错误返回,等待的条件也可能是假的:即使pthread_cond_timewait()返回了超时错误,关联的条 ...
- SqlServer自动锁定sa解决代码
ALTER LOGIN sa ENABLE ; GO ALTER LOGIN sa WITH PASSWORD = '' unlock, check_policy = off, check_expir ...
