matplotlib formatters
Tick formatting is controlled by classes derived from Formatter. The formatter
operates on a single tick value and returns a string to the axis. -- matplotlib document
Tips: To control the major and minor tick label formats, use one of the
following methods::
ax.xaxis.set_major_formatter(xmajor_formatter)
ax.xaxis.set_minor_formatter(xminor_formatter)
ax.yaxis.set_major_formatter(ymajor_formatter)
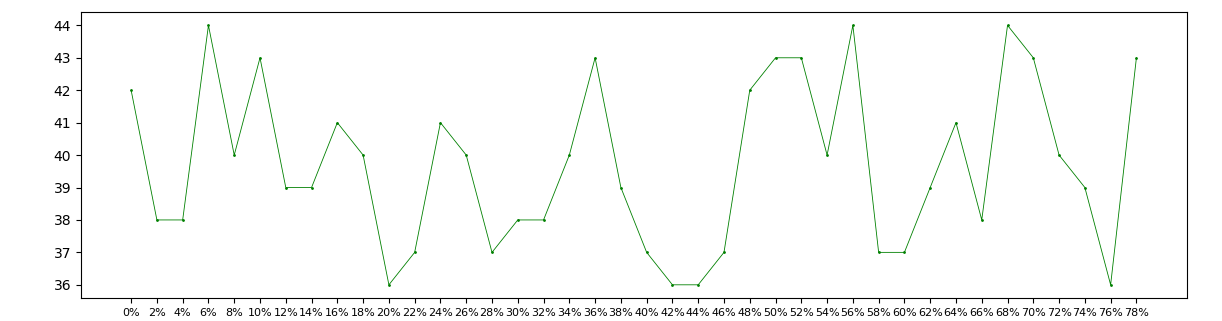
ax.yaxis.set_minor_formatter(yminor_formatter) Figure without formatter:
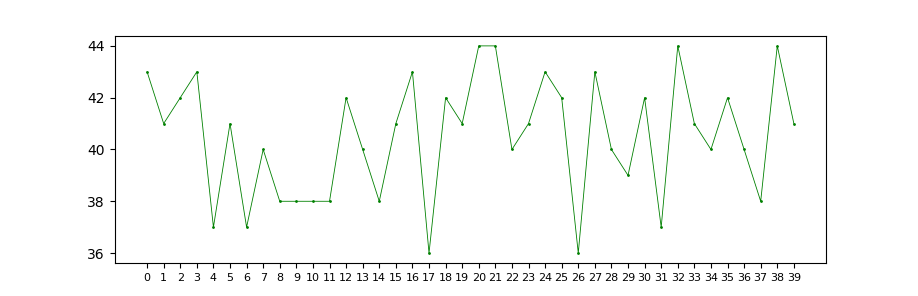
#!/usr/bin/python

# _*_ Coding: Utf-8 _*_

import matplotlib.pyplot as plt

import numpy as np

import random

from matplotlib.ticker import *

t = [str(i) for i in range(40)]

# t = [str(10**i) for i in range(-5, 5)]  # test data for scaler, eng formatter

s = [36 + random.randint(0, 8) for i in range(40)]

fig, axes = plt.subplots()

axes.plot(t, s, 'go-', markersize=1, linewidth=0.6)

axes.tick_params(axis='x', labelsize=8)  # tick_params

axes.set_xticks(t)  # set ticks

fig.tight_layout()

plt.show()
- NullFormatter
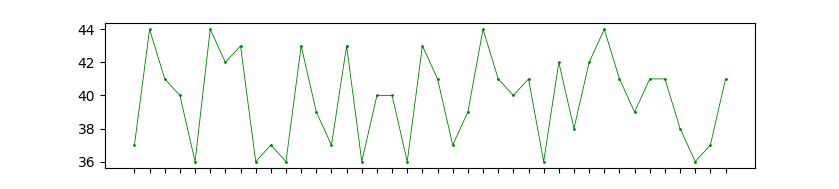
nullFormatter = NullFormatter() # null formatter
FixedFormatter

fixedFormatter = FixedFormatter(['1', 'show', '2', 'to', '3', 'you', '4', 'yeah']) # fixed formatter
IndexFormatter
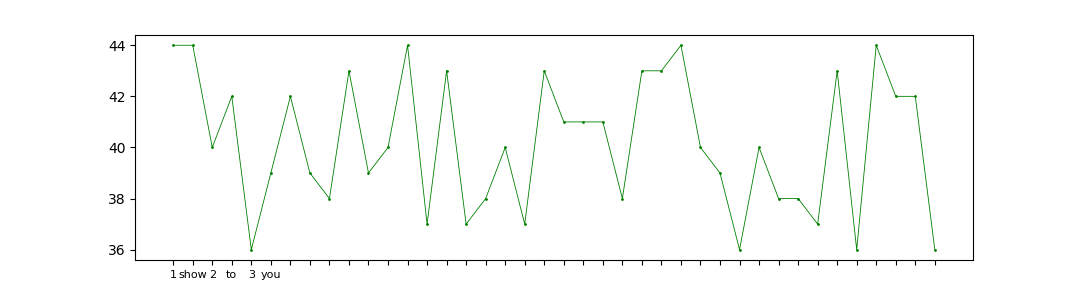
indexFormatter = IndexFormatter(['1', 'show', '2', 'to', '3', 'you']) # index deceid
FormatStrFormatter
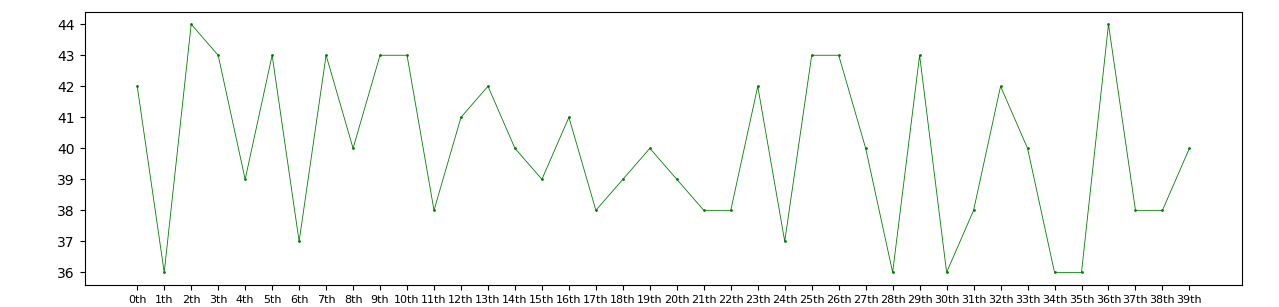
formatStrFormatter = FormatStrFormatter("%dth") # Use an old-style ('%' operator) format string to format the tick.
StrMethodFormatter

strMethodFormatter = StrMethodFormatter("{x}|{pos}") # `x` and `pos` are passed to `str.format` as keyword arguments
PercentFormatter
percentFormatter = PercentFormatter(xmax=50, decimals=None, symbol='%', is_latex=False) # Format numbers as a percentage
funcFormatter
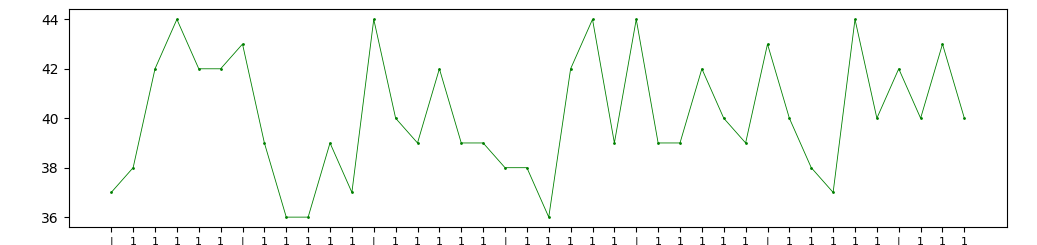
def my_formatter_func(x, pos = None):

    if x % 6 == 0:

        return "|"

    else:

        return "1"

funcFormatter = FuncFormatter(func=my_formatter_func)  # user-defined func
matplotlib formatters的更多相关文章
- 【Python】一份非常好的Matplotlib教程
Matplotlib 教程 本文为译文,原文载于此,译文原载于此.本文欢迎转载,但请保留本段文字,尊重作者和译者的权益.谢谢.: ) 介绍 Matplotlib 可能是 Python 2D-绘图领域使 ...
- python3绘图示例6-2(基于matplotlib,绘图流程介绍及设置等)
#!/usr/bin/env python# -*- coding:utf-8 -*- import os import numpy as npimport matplotlib as mpltfro ...
- python3绘图示例6-1(基于matplotlib,绘图流程介绍及设置等)
#!/usr/bin/env python# -*- coding:utf-8 -*- import os import pylab as pyimport numpy as npfrom matpl ...
- logging,numpy,pandas,matplotlib模块
logging模块 日志总共分为以下五个级别,这五个级别自下而上进行匹配debug->info->warning->error->critical,默认的最低级别warning ...
- Python 绘图与可视化 matplotlib(下)
详细的参考链接:更详细的:https://www.cnblogs.com/zhizhan/p/5615947.html 图像.子图.坐标轴以及记号 Matplotlib中图像的意思是打开的整个画图窗口 ...
- python安装numpy、scipy和matplotlib等whl包的方法
最近装了python和PyCharm开发环境,但是在安装numpy和matplotlib等包时出现了问题,现总结一下在windows平台下的安装方法. 由于现在找不到了工具包新版本的exe文件,所以采 ...
- matplotlib 高级用法实例--共享x轴
http://localhost:8888/notebooks/duanqs/matplotlib_advanced_example.ipynb 我不会弄呀, 刚才从matplotlib文档里吧示例用 ...
- Python matplotlib笔记
可视化的工具有很多,如Tableau,各种JS框架,我个人感觉应该是学JS最好,因为JS不需要环境,每个电脑都有浏览器,而像matplotlib需要Python这样的开发环境,还是比较麻烦的,但是毕竟 ...
- Matplotlib——第一章轻松画个图
首先安装matplotlib,使用pip install matplotlib.安装完成后在python的命令行敲入import matplotlib,如果没问题,说明安装成功可以开始画图了. 看好了 ...
随机推荐
- XiaoQi.Study项目(一)
项目地址:https://github.com/xiaoqiyaozou1/XiaoQi.Study 感谢:“老张的哲学”.“晓晨”.“杨旭”等大佬的知识分享 一.项目创建 vs 2019 创建 as ...
- SpringCloud微服务:Sentinel哨兵组件,管理服务限流和降级
源码地址:GitHub·点这里||GitEE·点这里 一.基本简介 1.概念描述 Sentinel 以流量为切入点,从流量控制.熔断降级.系统负载保护等多个维度保护服务的稳定性.包括核心的独立类库,监 ...
- 从零开始学习R语言(五)——数据结构之“列表(List)”
本文首发于知乎专栏:https://zhuanlan.zhihu.com/p/60141740 也同步更新于我的个人博客:https://www.cnblogs.com/nickwu/p/125678 ...
- Java循环和数组练习题:打印素数升级版
前两天一个小伙伴问了我一个数组的练习题,我一看思路很清晰,就是打印素数加了个数组.没想到写的时候啪啪打脸,终究还是没逃过眼高手低.本来不打算发出来了,因为发出来愈发显得我很菜,最后还是打算分享出来,一 ...
- hdu2087kmp模板练习
题目网址:http://icpc.njust.edu.cn/Problem/Hdu/2087/ 代码: #include<bits/stdc++.h> using namespace st ...
- 两片74门实现的双边沿D触发器
最近一个项目需要时钟上升沿和下降沿都可以触发的D触发器,但并没有找到符合要求的商品IC.也去看了一些文献,但都是给的示意图然后用分立元件实现的(应该是准备做成IC).这里给出一种最少2个IC就能搭出来 ...
- 5L-链表导论心法
链表是比数组稍微复杂一点的数据结构,也是两个非常重要与基本的数据结构.如果说数组是纪律严明排列整齐的「正规军」那么链表就是灵活多变的「地下党」. 关注公众号 MageByte,有你想要的精彩内容. 链 ...
- vim-1-window,buffer and tab
Summary:A buffer is the in-memory text of a file. A window is a viewport on a buffer. A tab page is ...
- 使用Keras进行深度学习:(一)Keras 入门
欢迎大家关注我们的网站和系列教程:http://www.tensorflownews.com/,学习更多的机器学习.深度学习的知识! Keras是Python中以CNTK.Tensorflow或者Th ...
- PyTorch专栏(一)
专栏目录: 第一章:PyTorch之简介与下载 PyTorch简介 PyTorch环境搭建 第二章:PyTorch之60min入门 PyTorch 入门 PyTorch 自动微分 PyTorch 神经 ...