Prometheus 安装
简介
prometheus存储的是
时序数据,即按相同时序(相同名称和标签),以时间维度存储连续的数据的集合。
时序(
time series)是由名字(Metric)以及一组key/value标签定义的,具有相同的名字以及标签属于相同时序。
Metric类型:
Counter: 一种累加的metric,如请求的个数,结束的任务数,出现的错误数等Gauge: 常规的metric,如温度,可任意加减。其为瞬时的,与时间没有关系的,可以任意变化的数据。Histogram: 柱状图,用于观察结果采样,分组及统计,如:请求持续时间,响应大小。其主要用于表示一段时间内对数据的采样,并能够对其指定区间及总数进行统计。根据统计区间计算Summary: 类似Histogram,用于表示一段时间内数据采样结果,其直接存储quantile数据,而不是根据统计区间计算出来的。不需要计算,直接存储结果
PromQL:
PromQL (Prometheus Query Language) 是 Prometheus 自己开发的数据查询 DSL 语言。
查询结果类型:
- 瞬时数据 (
Instant vector): 包含一组时序,每个时序只有一个点,例如:http_requests_total - 区间数据 (
Range vector): 包含一组时序,每个时序有多个点,例如:http_requests_total[5m] - 纯量数据 (
Scalar): 纯量只有一个数字,没有时序,例如:count(http_requests_total)
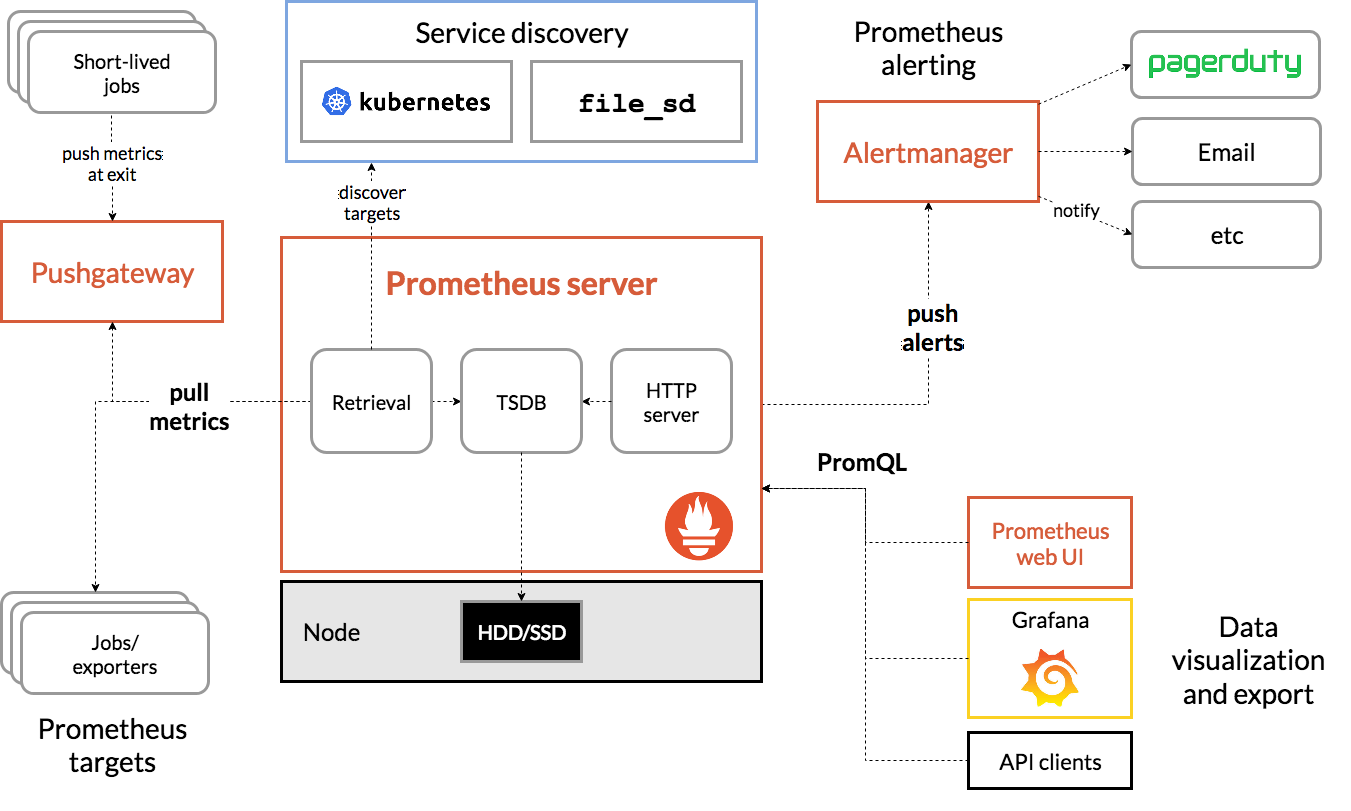
架构图
安装部署
环境准备
| 主机名 | 角色 | IP | 系统版本 | 内核版本 |
|---|---|---|---|---|
| es01.k8s.com | node01 | 10.0.20.11 | CentOS 7.5 | 5.1.4-1.el7.elrepo.x86_64 |
官网: prometheus.io
prometheus 下载地址: https://github.com/prometheus/prometheus/releases/download/v2.14.0/prometheus-2.14.0.linux-amd64.tar.gz
安装
prometheus 安装使用二进制安装,解压后即可直接启动。
[root@es01 soft]# ls -l prometheus-2.14.0.linux-amd64.tar.gz

-rw-r--r-- 1 root root 58625125 Nov 12 00:21 prometheus-2.14.0.linux-amd64.tar.gz

[root@es01 soft]# tar xf prometheus-2.14.0.linux-amd64.tar.gz

[root@es01 soft]# ls prometheus-2.14.0.linux-amd64

console_libraries  consoles  LICENSE  NOTICE  prometheus  prometheus.yml  promtool  tsdb

[root@es01 soft]# mv prometheus-2.14.0.linux-amd64 /opt/prometheus-2.14

[root@es01 soft]# mkdir /opt/prometheus-2.14/{bin,config,data,logs}

[root@es01 soft]# cd /opt/prometheus-2.14/

[root@es01 prometheus-2.14]# mv prometheus  promtool  tsdb bin/

[root@es01 prometheus-2.14]# mv prometheus.yml config/

[root@es01 prometheus-2.14]# ll

total 20

drwxr-xr-x  2 root root    52 Nov 21 16:43 bin

drwxr-xr-x  4 root root   151 Nov 25 09:30 config

drwxr-xr-x  2 3434 3434    38 Nov 12 00:17 console_libraries

drwxr-xr-x  2 3434 3434   173 Nov 12 00:17 consoles

drwxr-xr-x 12 root root  4096 Nov 25 09:00 data

-rw-r--r--  1 3434 3434 11357 Nov 12 00:17 LICENSE

drwxr-xr-x  2 root root    23 Nov 21 16:49 logs

-rw-r--r--  1 3434 3434  3184 Nov 12 00:17 NOTICE
配置环境变量
[root@es01 prometheus-2.14]# echo '/opt/prometheus-2.14/bin:$PATH' >> /etc/profile

[root@es01 prometheus-2.14]# source /etc/profile

[root@es01 prometheus-2.14]# prometheus --version

prometheus, version 2.14.0 (branch: HEAD, revision: edeb7a44cbf745f1d8be4ea6f215e79e651bfe19)

  build user:       root@df2327081015

  build date:       20191111-14:27:12

  go version:       go1.13.4
能输出以上内容,及表示配置完成。
配置
默认的配置文件,既可以直接启动
[root@es01 prometheus-2.14]# egrep -v '^#' prometheus.yml

global:

  scrape_interval:     15s # Set the scrape interval to every 15 seconds. Default is every 1 minute.

  evaluation_interval: 15s # Evaluate rules every 15 seconds. The default is every 1 minute.

  # scrape_timeout is set to the global default (10s).

alerting:

  alertmanagers:

  - static_configs:

    - targets:

      # - alertmanager:9093

rule_files:

  # - "first_rules.yml"

  # - "second_rules.yml"

scrape_configs:

  # The job name is added as a label `job=<job_name>` to any timeseries scraped from this config.

  - job_name: 'prometheus'

    # metrics_path defaults to '/metrics'

    # scheme defaults to 'http'.

    static_configs:

    - targets: ['localhost:9090']
启动
直接使用 nohub 把进程放到后台运行
[root@es01 config]# nohup /opt/prometheus-2.14/bin/prometheus --config.file=/opt/prometheus-2.14/config/prometheus.yml --web.enable-lifecycle --storage.tsdb.path=/opt/prometheus-2.14/data/ --log.level=info --log.format=json &>> /opt/prometheus-2.14/logs/prometheus.log &
--config.file指定配置文件目录--web.enable-lifecycle开启通过 http://prometheus:port/-/reload 访问重新加载配置文件--storage.tsdb.path配置prometheus数据保存目录--log.level配置输出日志级别--log.format配置日志输出格式
更多启动参数,请使用 prometheus -h 进行查看。
[root@es01 config]# netstat -lntup | grep 9090

tcp6       0      0 :::9090                 :::*                    LISTEN      25469/prometheus
安装完成
Prometheus 安装的更多相关文章
- Prometheus安装
Prometheus安装 下载地址: https://prometheus.io/download/ 现在时间是: 2019.09.07 安装环境: Linux centos7 minimal 虚拟机 ...
- Prometheus 安装Alertmanager集成
Prometheus 安装Alertmanager集成 # 下载地址 地址1:https://prometheus.io/download/ 地址2:https://github.com/promet ...
- Prometheus 安装Grafana与Prometheus集成
Prometheus 安装Grafana与Prometheus集成 Grafana是一个开源的度量分析和可视化系统. 下载地址:https://grafana.com/grafana/download ...
- Prometheus 安装部署
Prometheus 安装部署 安装版本:prometheus-2.6.1 百度云下载:https://pan.baidu.com/s/1w16lQZKw8PCHqlRuSK2i7A 提取码:lw1q ...
- Prometheus安装教程
Prometheus安装教程 欢迎关注H寻梦人公众号 参考目录 docker安装Prometheus 基于docker 搭建Prometheus+Grafana prometheus官方文档 dock ...
- Prometheus安装和配置node_exporter监控主机
Node_exporter是可以在* Nix和Linux系统上运行的计算机度量标准的导出器. Node_exporter 主要用于暴露 metrics 给 Prometheus,其中 metrics ...
- prometheus安装、使用
本文主要参考https://songjiayang.gitbooks.io/prometheus/introduction/what.html 二进制包安装 我们可以到 Prometheus 二进制下 ...
- Prometheus安装部署说明
本文主要介绍了如何二进制安装Prometheus.使用 Node Exporter 采集主机信息并使用Grafana来进行图形化的展示. 1. 安装Prometheus Server Promethe ...
- prometheus学习系列二: Prometheus安装
下载 在prometheus的官网的download页面,可以找到prometheus的下载二进制包. [root@node00 src]# cd /usr/src/ [root@node00 src ...
随机推荐
- 【MySQL】MySQL 8.0.X的安装与卸载命令
1.请读者自行下载MySQL Server https://dev.mysql.com/downloads/mysql/ 2.解压.zip文件 将mysql-8.0.12-winx64.zip解压到 ...
- Java 生成在线二维码 以Base64返回前端、或者写入到本地磁盘
思路 现阶段遇到这样一个问题,在原有的产品上加入线下优惠券模式,用户领取优惠券以后,获取到一个唯一的ID作为领取凭证,但是在线下用扫码枪进行扫码的时候,总不能让人手动输入吧 于是乎就想出了一个办法,后 ...
- 使用uni-app开发微信小程序
uni-app 开发微信小程序 前言 9月份,开始开发微信小程序,也曾调研过wepy/mpvue,考虑到后期跨端的需求,最终选择使用了uni-app,本文主要介绍如何使用uni-app搭建小程序项目, ...
- js实现的几种继承方式
他山之石,可以攻玉,本人一直以谦虚的态度学他人之所长,补自己之所短,望各位老师指正! 拜谢 js几种继承方式,学习中的总结: 所谓的继承是为了继承共有的属性,减少不必要代码的书写 第一种:借用构造函数 ...
- mock和axios常见的传参方式
第一次接手项目,传参方式还有些吃力,因此做一下总结. 首先我们需要会看swagger中的接口.里面写了某个接口需要接收什么样的值,前端怎么传递这个值 在mock中的传参方式: mock中传参的方式有两 ...
- windows下同时装了Python3和Python2,如何区分使用?
1.前言 想学习Python3,但是暂时又离不开Python2.在Windows上如何让它们共存呢? 目前国内网站经常会让大家把其中一个python.exe改个名字,这样区分开两个可执行文件的名字,但 ...
- python购物车练习题
# 购物车练习# 1.启动程序后,让用户输入工资,打印商品列表# 2.允许用户根据商品编号购买商品# 3.用户选择商品后,检测余额是否够,够就直接扣款,不够就提醒# 4.可随时退出,退出时,打印已购买 ...
- Spring Boot 2.X(十六):应用监控之 Spring Boot Actuator 使用及配置
Actuator 简介 Actuator 是 Spring Boot 提供的对应用系统的自省和监控功能.通过 Actuator,可以使用数据化的指标去度量应用的运行情况,比如查看服务器的磁盘.内存.C ...
- linux shell脚本语法笔记
1.&,&&,|,|| &:除了最后一个cmd,前面的cmd均已后台方式静默执行,执行结果显示在终端上,个别的cmd错误不影响整个命令的执行,全部的cmd同时执行 &a ...
- 部署django
添加uwagi配置文件 在你项目的根目录中创建mysite.xml(名字无所谓),或者创建mysite.ini,输入以下内容: <uwsgi> <socket>127.0.0. ...