wxpython绘制折线图
environment:win10 + eclipse + pydev + python2.7.11 + wxpython3.0.2
code sample:
- #!/usr/bin/env python
- # -*- coding: UTF-8 -*-
- import wx
- import wx.lib.plot as plot
- class MyFrame(wx.Frame):
- def __init__(self):
- self.frame1 = wx.Frame(None, title="test", id=-1, size=(500, 300))
- self.panel1 = wx.Panel(self.frame1)
- self.panel1.SetBackgroundColour("white")
- Button1 = wx.Button(self.panel1, -1, "Update", (200,220))
- Button1.Bind(wx.EVT_BUTTON, self.redraw)
- plotter = plot.PlotCanvas(self.panel1)
- plotter.SetInitialSize(size=(500, 200))
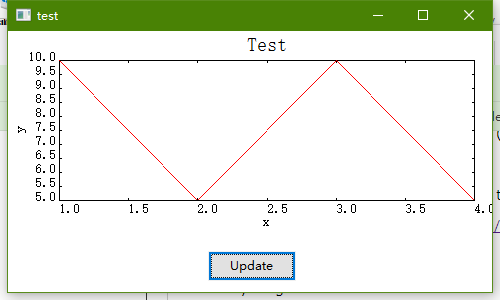
- data= [[1, 10], [2, 5], [3,10], [4, 5]]
- line= plot.PolyLine(data, colour='red', width=1)
- gc= plot.PlotGraphics([line], 'Test', 'x', 'y')
- plotter.Draw(gc)
- self.frame1.Show(True)
- def redraw(self, event):
- plotter = plot.PlotCanvas(self.panel1)
- plotter.SetInitialSize(size=(500, 200))
- data2= [[1, 20], [2, 15], [3,20], [4, -10]]
- line= plot.PolyLine(data2, colour='red', width=1)
- gc= plot.PlotGraphics([line], 'Test', 'x', 'y')
- plotter.Draw(gc)
- app = wx.PySimpleApp()
- f = MyFrame()
- app.MainLoop()
error 1:raise ImportError("NumPy not found.\n" + msg)
solution: run console with"cmd", and run 'pip install numpy'.
error 2:TypeError: Required argument 'type' (pos 2) not found
solution:that's A BUG with wx3.0.2!
patch the latest wx.lib.plot can totally solve that.
url:https://github.com/wxWidgets/wxPython/commit/30bc07d80ae1c81d70b4de2daac62ecd7996d703
now everything is fine!
转载注明出处:http://www.cnblogs.com/ityoung/
github: https://github.com/ityoung
wxpython绘制折线图的更多相关文章
- 用canvas绘制折线图
<!DOCTYPE html> <html lang="en"> <head> <meta charset="UTF-8&quo ...
- php中用GD绘制折线图
php中用GD绘制折线图,代码如下: Class Chart{ private $image; // 定义图像 private $title; // 定义标题 private $ydata; // 定 ...
- UUChart的使用--iOS绘制折线图
UUChart是一个用于绘制图表的第三方,尤其适合去绘制折线图. 二.下载地址: https://github.com/ZhipingYang/UUChartView 三.使用 第一步.首先我们将下载 ...
- html5绘制折线图
html5绘制折线图详细代码 <html> <canvas id="a_canvas" width="1000" height="7 ...
- Android自己定义组件系列【9】——Canvas绘制折线图
有时候我们在项目中会遇到使用折线图等图形,Android的开源项目中为我们提供了非常多插件,可是非常多时候我们须要依据详细项目自己定义这些图表,这一篇文章我们一起来看看怎样在Android中使用Can ...
- JFreeChart绘制折线图实例
JFreeChart是JAVA平台上的一个开放的第三方图表绘制类库.只要下载JFreeChart的类库,导入项目即可使用.下面是一个绘制折线图的实例.各处注释都已经写的比较清晰了. package c ...
- 【带着canvas去流浪】(2)绘制折线图
目录 一. 任务说明 二. 重点提示 三. 示例代码 3.1 一般折线图 3.2 用贝塞尔曲线绘制平滑折线图 四. 大数据量场景 示例代码托管在:https://github.com/dashnowo ...
- python使用matplotlib绘制折线图教程
Matplotlib是一个Python工具箱,用于科学计算的数据可视化.借助它,Python可以绘制如Matlab和Octave多种多样的数据图形.下面这篇文章主要介绍了python使用matplot ...
- 用PNChart绘制折线图
写在前面 上一篇文章已经介绍过用PNChart绘制饼状图了,绘制折线图的步骤和饼状图的步骤是相似的,按照中的准备做好准备工作后就可以绘制折线图了. 开始使用 1.在view中声明一个PNLineCha ...
随机推荐
- Linux下安装JDK和Eclipse
安装步骤: (1)下载JDK (jdk-8u20-linux-x64.tar.gz) (2)卸载系统自带的开源JDK rpm -qa |grep java rpm –e java (3) ...
- 文件缓存(配合JSON数组)
1. 写入缓存:建立文件夹,把list集合里面的数组转换为JSON数组,存入文件夹2. 读取缓存:把JSON数组从文件夹里面读取出来,然后放入list集合,返回list集合 private fin ...
- iOS 性能调试
性能调优的方式: 1.通过专门的性能调优工具 2.通过代码优化 1. 性能调优工具: 下面针对iOS的性能调优工具进行一个介绍: 1.1 静态分析工具–Analyze 相信iOS开发者在App进行Bu ...
- Angularjs-项目搭建
开发工具采用WebStorm,没破解,使用了过期策略:安装之后不着急打开程序,先设置系统日期为未来的某个日期,比如2020年.然后再打开程序,试用.然后再改回来系统日期.虽然每次打开WebStorm都 ...
- Git命令
1. 检出项目到本地 git clone git@github.com:michaelliao/gitskills.git 2. 查看当前工作区状态 git status 3. 添加文件或文件夹至版本 ...
- 阿里云yum源安装
1.先清理掉yum.repos.d下面的所有repo文件 [root@localhost yum.repos.d]# rm -rf * 2.下载repo文件 wget http://mirror ...
- Ajax语法浅析
Ajax是目前很普遍的一门技术,也是很值得探讨和研究的一门技术.本文将针对Ajax的发展过程并结合其在不同库框架中的使用方式来和大家分享下Ajax的那些新老语法. Ajax简介 Ajax全称为“Asy ...
- /var/log/messages
messages 该日志文件是许多进程日志文件的汇总,从该文件可以看出任何入侵企图或成功的入侵,包括整体系统信息,是系统最核心的日志.它包含了系统启动时的引导消息,以及系统运行时的其他状态消息.IO ...
- [LeetCode] The Skyline Problem 天际线问题
A city's skyline is the outer contour of the silhouette formed by all the buildings in that city whe ...
- Suspend to RAM和Suspend to Idle分析,以及在HiKey上性能对比
Linux内核suspend状态 Linux内核支持多种类型的睡眠状态,通过设置不同的模块进入低功耗模式来达到省电功能.目前存在四种模式:suspend to idle.power-on standb ...