自学Zabbix3.5.3-监控项item-key
1. 温习
Zabbix server是Zabbix软件的中心进程。
Server执行polling和trapping来采集数据,评估是否触发触发器,发送报警给用户。它是Zabbix agent和proxy用来报告关于系统可用性和完整性数据的中心组件,Server也可以通过简单服务检查(simple service check)来完成远程网络服务检测。
Server是所有配置、统计和操作数据的中心存储仓库,也是在所有的监控系统中扮演故障发生时通知管理员的角色
基础Zabbix server依据功能不同划分为三个部分,分别为: Zabbix server、web前端及数据库。
由于Zabbix的所有的配置信息保存在数据库中,server和web前端可以直接进行操作。比如,通过web前端(或者API)创建一个新的监控项时,它将创建的数据插入数据库。一分钟左右Zabbix server会查询监控项数据表,并将查询的监控项 列表保存在自己的缓存(cache)中。这也是为什么通过Zabbix前端进行的变更将在两分钟左右生效。
Zabbix agent部署在被监控机器上用来监控本地资源和应用(如硬盘、内存、处理器统计等).
Zabbix agent聚合本地的运行信息并将数据发送给Zabbix server以进一步处理. 一旦出现异常(如硬盘空间满的情况或者服务进行宕掉),Zabbix server将会发送告警给管理员报告本次异常.
Zabbix agent利用本地系统调用完成统计信息收集,因此它非常的高效。
被动(passive)和主动(active)检查
Zabbix agent提供被动和主动检查方式:
被动检查模式中agent应答数据请求,Zabbix server或者proxy询问agent数据,如CPU load, 然后Zabbix agent回送结果给server.
主动检查模式处理过程将相对复杂. agent必须首先进行一次请求Zabbix server索取监控项列表,然后发送对应的值给server.
选择是被动还是主动检查,需要在监控性类型中选择’Zabbix agent’或者’Zabbix agent (active)’
被动:zabbix server向zabbix agent讨要数据。
主动:zabbix agent提交数据给zabbix server。
Zabbix代理(proxy)
通常用于替代server完成对多个监控设备收集监控信息并将数据发送给Zabbix server. 所有的收集数据会先存储在代理本地缓存中然后传送给Zabbix server.
代理是可选的,不过使用它可以有效的降低在分布式环境中单一的Zabbix server负载. 通过代理去收集收集,server可以有效降低CPU和磁盘I/O消耗.
Zabbix代理可以出色的完成远程区域、分支机构、没有本地管理员的网络的集中监控.
Zabbix代理使用独立的数据库
2. 监控项item 所有的key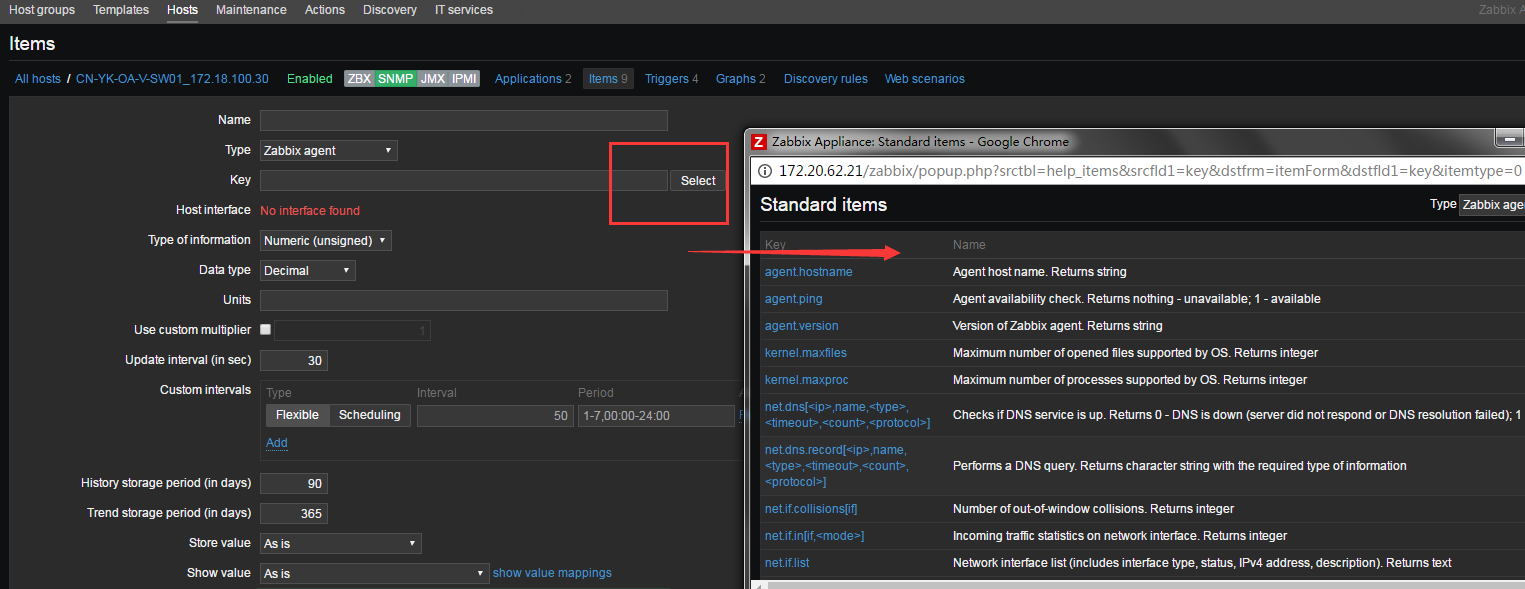
| Key | Name |
|---|---|
| agent.hostname | Agent host name. Returns string |
| agent.ping | Agent availability check. Returns nothing - unavailable; 1 - available |
| agent.version | Version of Zabbix agent. Returns string |
| kernel.maxfiles | Maximum number of opened files supported by OS. Returns integer |
| kernel.maxproc | Maximum number of processes supported by OS. Returns integer |
| net.dns[<ip>,name,<type>,<timeout>,<count>,<protocol>] | Checks if DNS service is up. Returns 0 - DNS is down (server did not respond or DNS resolution failed); 1 - DNS is up |
| net.dns.record[<ip>,name,<type>,<timeout>,<count>,<protocol>] | Performs a DNS query. Returns character string with the required type of information |
| net.if.collisions[if] | Number of out-of-window collisions. Returns integer |
| net.if.in[if,<mode>] | Incoming traffic statistics on network interface. Returns integer |
| net.if.list | Network interface list (includes interface type, status, IPv4 address, description). Returns text |
| net.if.out[if,<mode>] | Outgoing traffic statistics on network interface. Returns integer |
| net.if.total[if,<mode>] | Sum of incoming and outgoing traffic statistics on network interface. Returns integer |
| net.tcp.listen[port] | Checks if this TCP port is in LISTEN state. Returns 0 - it is not in LISTEN state; 1 - it is in LISTEN state |
| net.tcp.port[<ip>,port] | Checks if it is possible to make TCP connection to specified port. Returns 0 - cannot connect; 1 - can connect |
| net.tcp.service[service,<ip>,<port>] | Checks if service is running and accepting TCP connections. Returns 0 - service is down; 1 - service is running |
| net.tcp.service.perf[service,<ip>,<port>] | Checks performance of TCP service. Returns 0 - service is down; seconds - the number of seconds spent while connecting to the service |
| net.udp.listen[port] | Checks if this UDP port is in LISTEN state. Returns 0 - it is not in LISTEN state; 1 - it is in LISTEN state |
| net.udp.service[service,<ip>,<port>] | Checks if service is running and responding to UDP requests. Returns 0 - service is down; 1 - service is running |
| net.udp.service.perf[service,<ip>,<port>] | Checks performance of UDP service. Returns 0 - service is down; seconds - the number of seconds spent waiting for response from the service |
| perf_counter[counter,<interval>] | Value of any Windows performance counter. Returns integer, float, string or text (depending on the request) |
| proc.cpu.util[<name>,<user>,<type>,<cmdline>,<mode>,<zone>] | Process CPU utilisation percentage. Returns float |
| proc.mem[<name>,<user>,<mode>,<cmdline>,<memtype>] | Memory used by process in bytes. Returns integer |
| proc.num[<name>,<user>,<state>,<cmdline>] | The number of processes. Returns integer |
| proc_info[process,<attribute>,<type>] | Different information about specific process(es). Returns float |
| sensor[device,sensor,<mode>] | Hardware sensor reading. Returns float |
| service.info[service,<param>] | Information about a service. Returns integer with param as state, startup; string - with param as displayname, path, user; text - with param as description; Specifically for state: 0 - running, 1 - paused, 2 - start pending, 3 - pause pending, 4 - continue pending, 5 - stop pending, 6 - stopped, 7 - unknown, 255 - no such service; Specifically for startup: 0 - automatic, 1 - automatic delayed, 2 - manual, 3 - disabled, 4 - unknown |
| services[<type>,<state>,<exclude>] | Listing of services. Returns 0 - if empty; text - list of services separated by a newline |
| system.boottime | System boot time. Returns integer (Unix timestamp) |
| system.cpu.intr | Device interrupts. Returns integer |
| system.cpu.load[<cpu>,<mode>] | CPU load. Returns float |
| system.cpu.num[<type>] | Number of CPUs. Returns integer |
| system.cpu.switches | Count of context switches. Returns integer |
| system.cpu.util[<cpu>,<type>,<mode>] | CPU utilisation percentage. Returns float |
| system.hostname[<type>] | System host name. Returns string |
| system.hw.chassis[<info>] | Chassis information. Returns string |
| system.hw.cpu[<cpu>,<info>] | CPU information. Returns string or integer |
| system.hw.devices[<type>] | Listing of PCI or USB devices. Returns text |
| system.hw.macaddr[<interface>,<format>] | Listing of MAC addresses. Returns string |
| system.localtime[<type>] | System time. Returns integer with type as utc; string - with type as local |
| system.run[command,<mode>] | Run specified command on the host. Returns text result of the command; 1 - with mode as nowait (regardless of command result) |
| system.stat[resource,<type>] | System statistics. Returns integer or float |
| system.sw.arch | Software architecture information. Returns string |
| system.sw.os[<info>] | Operating system information. Returns string |
| system.sw.packages[<package>,<manager>,<format>] | Listing of installed packages. Returns text |
| system.swap.in[<device>,<type>] | Swap in (from device into memory) statistics. Returns integer |
| system.swap.out[<device>,<type>] | Swap out (from memory onto device) statistics. Returns integer |
| system.swap.size[<device>,<type>] | Swap space size in bytes or in percentage from total. Returns integer for bytes; float for percentage |
| system.uname | Identification of the system. Returns string |
| system.uptime | System uptime in seconds. Returns integer |
| system.users.num | Number of users logged in. Returns integer |
| vfs.dev.read[<device>,<type>,<mode>] | Disk read statistics. Returns integer with type in sectors, operations, bytes; float with type in sps, ops, bps |
| vfs.dev.write[<device>,<type>,<mode>] | Disk write statistics. Returns integer with type in sectors, operations, bytes; float with type in sps, ops, bps |
| vfs.file.cksum[file] | File checksum, calculated by the UNIX cksum algorithm. Returns integer |
| vfs.file.contents[file,<encoding>] | Retrieving contents of a file. Returns text |
| vfs.file.exists[file] | Checks if file exists. Returns 0 - not found; 1 - regular file or a link (symbolic or hard) to regular file exists |
| vfs.file.md5sum[file] | MD5 checksum of file. Returns character string (MD5 hash of the file) |
| vfs.file.regexp[file,regexp,<encoding>,<start line>,<end line>,<output>] | Find string in a file. Returns the line containing the matched string, or as specified by the optional output parameter |
| vfs.file.regmatch[file,regexp,<encoding>,<start line>,<end line>] | Find string in a file. Returns 0 - match not found; 1 - found |
| vfs.file.size[file] | File size (in bytes). Returns integer |
| vfs.file.time[file,<mode>] | File time information. Returns integer (Unix timestamp) |
| vfs.fs.inode[fs,<mode>] | Number or percentage of inodes. Returns integer for number; float for percentage |
| vfs.fs.size[fs,<mode>] | Disk space in bytes or in percentage from total. Returns integer for bytes; float for percentage |
| vm.memory.size[<mode>] | Memory size in bytes or in percentage from total. Returns integer for bytes; float for percentage |
| vm.vmemory.size[<type>] | Virtual space size in bytes or in percentage from total. Returns integer for bytes; float for percentage |
| web.page.get[host,<path>,<port>] | Get content of web page. Returns web page source as text |
| web.page.perf[host,<path>,<port>] | Loading time of full web page (in seconds). Returns float |
| web.page.regexp[host,<path>,<port>,<regexp>,<length>,<output>] | Find string on a web page. Returns the matched string, or as specified by the optional output parameter |
| wmi.get[<namespace>,<query>] | Execute WMI query and return the first selected object. Returns integer, float, string or text (depending on the request) |
| Key | ||||
| 功能 | 返回值 | 参数 | 描述 | |
| agent.hostname | ||||
| - | ||||
| agent.ping | ||||
| agent.version | ||||
| zabbix agent版本 | 字符串 | - | 例如返回: 1.8.2 | |
| kernel.maxfiles | ||||
| 系统支持最大的openfiles | 整数 | |||
| kernel.maxproc | ||||
| 系统支持最大的进程数量 | 整数 | |||
| 监控日志文件 | Log | file – 文件详细路径regexp – 正则encoding – 编码
maxlines – zabbix agent向server或者proxy发送最大的行数。这个参数覆盖配置文件zabbxi_agentd.conf中的’MaxLinesPerSecond’ mode – 可选值: all (默认), skip (跳过处理老数据).mode参数从2.0版本开始支持 output – 可选项,输出格式模板. The \0 escape sequence is replaced with the matched text while an \N(where N=1…9) escape sequence is replaced with Nth matched group (or an empty string if the N exceeds the number of captured groups). If <output> is left empty – the whole line containing the matched text is returned. Note that all global regular expression types except ‘Result is TRUE’ always return the whole matched line and the <output> parameter is ignored. output是2.2中新加入的功能 |
这个监控项只能设置为 active check(主动模式).如果文件不存在或者没有相应的权限,那么监控项状态会转变为unsupported.示例:
log[/var/log/syslog] log[/var/log/syslog,error] log[/home/zabbix/logs/logfile,,,100] |
|
| logrt[file_pattern,<regexp>,<encoding>,<maxlines>,<mode>,<output>] | ||||
| 监控支持轮转的日志 | Log | file_pattern – 文件绝对路径regexp – 正则表达式encoding – 编码
maxlines – 客户端每秒发送给server的最大行数. 这个参数会覆盖客户端配置文件zabbix_agentd.conf中MaxLinesPerSecond的值 mode – 可选值: all (默认), skip (跳过老数据的处理). Mode参数从2.0开始支持 output – an optional output formatting template. The \0 escape sequence is replaced with the matched text while an \N(where N=1…9) escape sequence is replaced with Nth matched group (or an empty string if the N exceeds the number of captured groups). If <output> is left empty – the whole line containing the matched text is returned. Note that all global regular expression types except ‘Result is TRUE’ always return the whole matched line and the <output> parameter is ignored. The output parameter is supported from version 2.2. |
The item must be configured as an active check. Log rotation is based on the last modification time of files.示例:logrt[“/home/zabbix/logs/^logfile[0-9]{1,3}$”,,,100]
– will match a file like “logfile1″ (will not match “.logfile1″) logrt[“/home/user/logfile_.*_[0-9]{1,3}”,”pattern_to_match”,”UTF-8″,100] – will collect data from files such “logfile_abc_1” or “logfile__001”. |
|
| net.dns[<ip>,zone,<type>,<timeout>,<count>] | ||||
| 检测DNS服务是否开启 | 0 – DNS挂了 1 – DNS运行中 | ip – DNS服务器的ip地址(留空表示使用本地DNS, ignored on Windows)zone – 需要测试的域名type – 记录类型 (默认为 SOA)
timeout (ignored on Windows) – 超时时间(默认1秒) count (ignored on Windows) – 重试次数 (默认值2) |
示例key:net.dns[8.8.8.8,zabbix.com,MX,2,1]type可选值: ANY, A, NS, CNAME, MB, MG, MR, PTR, MD, MF, MX, SOA, NULL, WKS (除了windows), HINFO, MINFO, TXT, SRV
SRV记录从Zabbix agent versions 1.8.6 (Unix) and 2.0.0 (Windows)开始支持Zabbix 2.0 之前的命名方式: net.tcp.dns(目前依旧支持) |
|
| net.dns.record[<ip>,zone,<type>,<timeout>,<count>] | ||||
| 执行一个DNS查询 | 获取DNS查询数据 | ip – DNS服务器的ip地址(留空表示使用本地DNS, ignored on Windows)zone – 需要测试的域名type – 记录类型 (默认为 SOA)
timeout (ignored on Windows) – 超时时间(默认1秒) count (ignored on Windows) – 重试次数 (默认值2) |
示例key:net.dns.record[8.8.8.8,ttlsa.com,MX,2,1]type的可选值: ANY, A, NS, CNAME, MB, MG, MR, PTR, MD, MF, MX, SOA, NULL, WKS (except for Windows), HINFO, MINFO, TXT, SRV
SRV记录从Zabbix agent versions 1.8.6 (Unix) and 2.0.0 (Windows)开始支持Zabbix 2.0 之前的命名方式: net.tcp.dns(目前依旧支持) |
|
| net.if.collisions[if] | ||||
| Out-of-window collision | Number of collisions | 数字 | if – 网卡 | |
| net.if.discovery | ||||
| 列出网卡. 通常用于低级别的discovery | JSON对象 | Zabbix agent 2.0开始支持 但是操作系统FreeBSD, OpenBSD and NetBSD上的 Zabbix agent 2.2开始支持 | ||
| net.if.in[if,<mode>] | ||||
| 网卡入口流量 | 整数 | if – 网卡名称mode – 可用值:bytes – 字节数 (默认)
packets – 包数量 errors – 错误数量 dropped – 丢包数量 |
示例keys: net.if.in[eth0,errors] net.if.in[eth0]请使用增量存储方式 | |
| net.if.out[if,<mode>] | ||||
| 网卡出口流量 | 整数 | if – 网卡名称mode – 可用值:bytes – 字节数 (默认)
packets – 包数量 errors – 错误数量 dropped – 丢包数量 |
范例keys:net.if.out[eth0,errors] net.if.out[eth0]请使用增量存储方式 | |
| net.if.total[if,<mode>] | ||||
| 网卡进/出流量的总和 | 整数 | if – 网卡名称mode – 可用值:bytes – 字节数 (默认)
packets – 包数量 errors – 错误数量 dropped – 丢包数量 |
范例keys:net.if.total[eth0,errors] net.if.total[eth0]请使用增量存储方式 | |
| net.tcp.listen[port] | ||||
| 检测端口是否开启 | 0 – 未监听1 – 监听中 | port – TCP端口 | 示例:net.tcp.listen[80]linux下的zabbix agent 1.8.4开始支持 | |
| net.tcp.port[<ip>,port] | ||||
| 是否可以连接到指定的TCP端口 | 0 – 无法连接1 – 可以连接 | ip – IP地址(默认是 127.0.0.1)port – 端口 | 范例:net.tcp.port[,80]检测web服务器端口是否运行中
老命名方式: check_port[*] |
|
| net.tcp.service[service,<ip>,<port>] | ||||
| 检测服务是否开启,并且端口可用 | 0 – 服务挂了1 – 服务运行中 | service – 如下: ssh, ntp, ldap, smtp, ftp, http, pop, nntp,imap, tcp, https, telnetip – IP地址 (默认127.0.0.1)port – 端口 (默认情况为标准端口号) | 示例key:net.tcp.service[ftp,,45] – 检测45端口上得FTP是否运行中Zabbix 1.8.3 支持的版本请使用service.ntp 代替ntp.
https 和telnet 服务从2.0和2.2开始支持 |
|
| net.tcp.service.perf[service,<ip>,<port>] | ||||
| 检测服务器性能 | 0 – 服务挂了;seconds – 链接到服务器端口消耗的时间 | service – 如下:ssh, ntp, ldap, smtp, ftp, http, pop, nntp,imap, tcp, https, telnetip – IP地址 (默认127.0.0.1)port – 端口 (默认情况为标准端口号) | 示例key:net.tcp.service.perf[ssh] – 检测SSH服务器响应速度加密协议检测不被支持 (类似 IMAP端口 993或者POP端口995) .但是我们可以使用net.tcp.service.perf[tcp,<ip>,<port>] 来检测他们.Windows agent不能检测LDAP和HTTPS. Note that the telnet check looks for a prompt (‘:’ at the end).老命名方式: check_service_perf[*]注意:that before Zabbix 1.8.3 version service.ntp should be used instead of ntp. Zabbix 2.0支持 https和telnet服务 | |
| net.udp.listen[port] | ||||
| 检测UDP端口是否在监听 | 0 – 未监听1 – 监听中 | port – udp端口 | 范例:net.udp.listen[68]linux系统的Zabbix agent 1.8.4开始支持 | |
| proc.mem[<name>,<user>,<mode>,<cmdline>] | ||||
| 用户进程消耗的内存 | 内存使用量 (字节单位). | name – 进程名 (默认值 “all processes”)user – 用户名 (默认值“all users”)mode – 可选值: avg, max, min, sum (默认)
cmdline – 命令行过滤(正则表达时) |
示例keys:proc.mem[,root]– root的进程消耗了多少内存
proc.mem[zabbix_server,zabbix] – zabbix用户运行的zabbix_server使用了多少内存 proc.mem[,oracle,max,oracleZABBIX] – memory used by the most memory-hungry process running under oracle having oracleZABBIX in its command line |
|
| proc.num[<name>,<user>,<state>,<cmdline>] | ||||
| 某用户某些状态的进程的数量 | 进程数量 | name – 进程名称 (默认“all processes”)user – 用户名 (默认 “all users”)state – 可用值: all (默认), run,sleep, zomb
cmdline – 命令行过滤(正则表达时) |
示例keys: proc.num[,mysql]– MySQL用户运行的进程数量
proc.num[apache2,www-data] – www-data运行了多少个apache2进程proc.num[,oracle,sleep,oracleZABBIX] – number of processes in sleep state running under oracle having oracleZABBIX in its command line 备注:Windows系统只支持name和user两个参数 |
|
| sensor[device,sensor,<mode>] | ||||
| 读取硬件传感器 | device – 设备名称sensor – 传感器名称mode – 可选值: avg,
max, min (if this parameter is omitted, device and sensor are treated verbatim). On Linux 2.4, 读取/proc/sys/dev/sensors. |
示例key:sensor[w83781d-i2c-0-2d,temp1] Prior to Zabbix 1.8.4, the sensor[temp1] format was used. On Linux 2.6+, 读取/sys/class/hwmon. On OpenBSD, 读取hw.sensors MIB.示例keys:
sensor[cpu0,temp0] – CPU0的温度 sensor[cpu[0-2]$,temp,avg] – cpu平均温度 Zabbix 1.8.4开始支持OpenBSD |
||
| system.boottime | ||||
| 系统启动的时间鹾 | 整数 | unix时间戳 | ||
| system.cpu.intr | ||||
| 设备中断 | 整数 | |||
| system.cpu.load[<cpu>,<mode>] | ||||
| CPU负载 | 浮点数 | cpu – 可用值: all (默认), percpu (所有在线cpu的负载)mode – 可用值: avg1 (1分钟 默认值), avg5(5分钟平均), avg15 (15分钟平均值) | 范例key:system.cpu.load[,avg5]老命令方式: system.cpu.loadX
参数percpu is Zabbix 2.0.0开始支持 |
|
| system.cpu.num[<type>] | ||||
| CPU数量 | 处理器个数 | type – 可用值: online (默认值), max | 范例:system.cpu.num | |
| system.cpu.switches | ||||
| 上下文交换 | 交换次数 | 老命名方式: system[switches] | ||
| system.cpu.util[<cpu>,<type>,<mode>] | ||||
| CPU利用率 | 百分比 | cpu – cpu数量 (默认是所有cpu)type – 可用值: idle, nice, user (默认), system (windows系统默认值), iowait, interrupt, softirq,stealmode – 可用值: avg1 (一分钟平均,默认值), avg5(5分钟平均, avg15 (15分钟平均值) | 范例key:system.cpu.util[0,user,avg5]老命名方式:
system.cpu.idleX, system.cpu.niceX, system.cpu.systemX, system.cpu.userX |
|
| system.hostname[<type>] | ||||
| 返回主机名 | 字符串 | type (仅用于windows系统) – 可用值: netbios(默认) or host | 例如:on Linux: system.hostname → linux-w7x1 system.hostname → www.zabbix.com on Windows: system.hostname → WIN-SERV2008-I6 system.hostname[host] → Win-Serv2008-I6LonG type参数从zabbix 1.8.6开始支持 | |
| system.hw.chassis[<info>] | ||||
| 返回机架信息 | 字符串 | info – full (默认), model, serial, type 或vendor | 例如: system.hw.chassis[full] Hewlett-Packard HP Pro 3010 Small Form Factor PC CZXXXXXXXX Desktop] 需要root权限,因为这些信息是从内存中读取的。 Zabbix agent version 2.0 开始支持 | |
| system.hw.cpu[<cpu>,<info>] | ||||
| 返回CPU信息 | 字符/数字 | cpu – cpu数量或者all (默认)info – full (默认), curfreq, maxfreq, model 或者vendor | 例如:system.hw.cpu[0,vendor]AuthenticAMD 从/proc/cpuinfo、/sys/devices/system/cpu/[cpunum]/cpufreq/cpuinfo_max_freq获取信息. 如果指定了CPU数量和 curfreq或者maxfreq, 将会返回数值(Hz).
Zabbix agent 2.0 开始支持 |
|
| system.hw.devices[<type>] | ||||
| 列出PCI或者USB | 文本值 | type – pci (默认) or usb | 范例:system.hw.devices[pci]00:00.0 Host bridge: Advanced Micro Devices [AMD] RS780 Host Bridge [..] 返回lspci或者lsusb (不带参数)
Zabbix agent 2.0开始支持 |
|
| system.hw.macaddr[<interface>,<format>] | ||||
| 列出MAC地址 | 字符串 | interface – all (默认) 或者正则表达式format – full (默认) 、short | 范例:system.hw.macaddr[“eth0$”,full][eth0] 00:11:22:33:44:55 列出指定接口mac地址 如果format指定为short,MAC地址相同的将会被忽略掉
Zabbix agent 2.0开始支持 |
|
| system.localtime[<type>] | ||||
| 系统时间 | 数字或者字符串 | utc – (默认) (00:00:00 UTC, January 1, 1970)local – 本地时间格式 ‘yyyy-mm-dd,hh:mm:ss.nnn,+hh:mm’ | zabbix 2.0开始支持带参数 | |
| system.run[command,<mode>] | ||||
| 在制定的主机上运行命令 | 文本 | command – 命令mode – wait (默认值, 执行超时时间), nowait (不等待) 最大可用返回512KB数据,包含空白数据。命令输出数据必须是文本 | 例如:system.run[ls -l /]– 列出/的文件和目录.
备注: 启用这个方法, agent配置文件必须配置 EnableRemoteCommands=1选项 |
|
| system.stat[resource,<type>] | ||||
| 虚拟内存状态 | 数字 | ent - number of processor units this partition is entitled to receive (float)kthr,<type> - information about kernel thread states:r - average number of runnable kernel threads (float)
b - average number of kernel threads placed in the Virtual Memory Manager wait queue (float) memory,<type> - information about the usage of virtual and real memory: avm - active virtual pages (integer) fre - size of the free list (integer) page,<type> - information about page faults and paging activity: fi - file page-ins per second (float) fo - file page-outs per second (float) pi - pages paged in from paging space (float) po - pages paged out to paging space (float) fr - pages freed (page replacement) (float) sr - pages scanned by page-replacement algorithm (float) faults,<type> - trap and interrupt rate: in - device interrupts (float) sy - system calls (float) cs - kernel thread context switches (float) cpu,<type> - breakdown of percentage usage of processor time: us - user time (float) sy - system time (float) id - idle time (float) wa - idle time during which the system had outstanding disk/NFS I/O request(s) (float) pc - number of physical processors consumed (float) ec - the percentage of entitled capacity consumed (float) lbusy - indicates the percentage of logical processor(s) utilization that occurred while executing at the user and system level (float) app - indicates the available physical processors in the shared pool (float) disk,<type> - disk statistics: bps - indicates the amount of data transferred (read or written) to the drive in bytes per second (integer) tps - indicates the number of transfers per second that were issued to the physical disk/tape (float) This item is supported starting from version 1.8.1. |
||
| system.sw.arch | ||||
| 返回软件信息 | 字符串 | 范例:system.sw.arch i686数据来自uname方法
Zabbix agent 2.0.开始支持 |
||
| system.sw.os[<info>] | ||||
| 返回系统信息 | 字符串 | info – full (default), short ,name | 范例:system.sw.os[short]Ubuntu 2.6.35-28.50-generic 2.6.35.11
信息来自如下文件 [full] – /proc/version [short] – /proc/version_signature [name] – /etc/issue.net Zabbix agent version 2.0.开始支持 |
|
| system.sw.packages[<package>,<manager>,<format>] | ||||
| 已安装软件列表 | 文本值 | package – all (默认)或者正则表达式manager – all (默认) or a package managerformat – full (默认) ,short | 范例:system.sw.packages[mini,dpkg,short] python-minimal, python2.6-minimal, ubuntu-minimal Lists (alphabetically) installed packages whose names match the given package regexp (“all” lists them all).包管理:
manager (执行命令) dpkg (dpkg –get-selections) pkgtool (ls /var/log/packages) rpm (rpm -qa) pacman (pacman -Q) 如果format 为full, packages are grouped by package managers (each manager on a seperate line beginning with it’s name in square brackets). 如果format为short, 包不分组,并且都列在一行上. Zabbix agent 2.0开始支持 |
|
| system.swap.in[<device>,<type>] | ||||
| 交换分区IN(磁盘交换到内存) | 数字 | device – 交换分区设备 (默认all)type – 可选值: count (swapins数量), sectors(sectors swapped in), pages (pages swapped in). | 示例key:system.swap.in[,pages]数据采集自: Linux 2.4: /proc/swaps, /proc/partitions, /proc/stat
Linux 2.6: /proc/swaps, /proc/diskstats, /proc/vmstat |
|
| system.swap.out[<device>,<type>] | ||||
| Swap out (f内存到磁盘) | 数字 | device – swap设备 (默认all)type – possible values: count (number of swapouts), sectors(sectors swapped out), pages (pages swapped out). See supported by platformfor details on defaults. | 示例key:system.swap.out[,pages]数据采集自:
Linux 2.4: /proc/swaps, /proc/partitions, /proc/stat Linux 2.6: /proc/swaps, /proc/diskstats, /proc/vmstat |
|
| system.swap.size[<device>,<type>] | ||||
| 交换分区大小 | 字节或者百分比 | device – 交换分区 (默认值 all)type – possible values: free (free swap space, default), pfree (free swap space, in percent), pused (used swap space, in percent), total (total swap space), used (used swap space) | 示例 key:system.swap.size[,pfree]– 空闲swap百分比
老命名格式: system.swap.free, system.swap.total |
|
| system.uname | ||||
| 返回主机相信信息 | 字符串 | 示例值:FreeBSD localhost 4.2-RELEASEFreeBSD 4.2-RELEASE #0: Mon Nov i386
Since Zabbix 2.2.0, the value for this item is obtained by using the uname() system call, whereas previously it was obtained by invoking “uname -a” on Unix systems. Hence, the value of this item might differ from the output of “uname -a” and does not include additional information that “uname -a” |
||
| system.uptime | ||||
| 系统运行时长(秒) | 多少秒 | 使用s/uptime来获取 | ||
| system.users.num | ||||
| 登陆用户数量 | 多少用户 | agent使用who命令获取 | ||
| vfs.dev.read[<device>,<type>,<mode>] | ||||
| 磁盘读取状态 | 整数(如果type为如下): sectors,operations,bytes 浮点数(如果type为如下): sps, ops,bps | device – 磁盘设备 (默认值 “all”1)type – 可选值: sectors, operations, bytes, sps, ops, bps(必须指定, 不同操作系统下不同). sps, ops, bps stand for: sectors, operations, bytes per second, respectively mode – 可选值: avg1 (一分平均, 默认值), avg5(五分内平均), avg15 (15分内平均值). 备注: 只有type为sps, ops, bps的时候,第三个参数才被支持。不同操作系统的TYPE参数: FreeBSD – bps
Linux – sps OpenBSD – operations Solaris – bytes |
示例key:vfs.dev.read[,operations]老命名方式: io[*]
Usage of the type parameters ops, bps and sps on supported platforms used to be limited to 8 devices (7 individual devices and one “all”). Starting with Zabbix 2.0.1 this limit has been increased to 1024 (1023 individual devices and one for “all”). Zabbix 1.8.6开始支持LVM Until Zabbix 1.8.6, only relative device names may be used (for example, sda), since 1.8.6 an optional /dev/ prefix may be used (for example, /dev/sda) |
|
| vfs.dev.write[<device>,<type>,<mode>] | ||||
| 磁盘写入状态 | 整数(如下类型): sectors,operations,bytes 浮点型(如下类型): sps, ops,bps | device – 磁盘设备 (默认值 “all”1)type – sectors, operations, bytes, sps, ops, bps (must specify exactly which parameter to use, since defaults are different under various OSes). sps, ops, bps means: sectors, operations, bytes per second respectively mode – one of avg1 (default),avg5 (average within 5 minutes), avg15. Note: The third parameter is supported only if the type is in: sps, ops, bps. | Default values of ‘type’ parameter for different OSes: FreeBSD – bps Linux – sps OpenBSD – operations Solaris – bytes Example: vfs.dev.write[,operations] Old naming: io[*] The type parameters ops, bps and sps on supported platforms used to be limited to 8 devices (7 individual devices and one “all”). Starting with Zabbix 2.0.1 this limit has been increased to 1024 (1023 individual devices and one for “all”). Supports LVM since Zabbix 1.8.6. Until Zabbix 1.8.6, only relative device names may be used (for example, sda), since 1.8.6 optional /dev/ prefix may be used (for example, /dev/sda) | |
| vfs.file.cksum | ||||
| 计算文件校验 | File checksum, calculated by algorithm used by UNIX cksum | file – 文件完整路径 | 例如,返回值: 1938292000例如:
vfs.file.cksum[/etc/passwd] 老命名规范: cksum |
|
| vfs.file.contents | ||||
| 获取文本内容 | Contents of a file or empty string if it is empty or it contains only LF/CR characters | file – 文件完整路径 | 例如:vfs.file.contents[/etc/passwd]文件不可以超过64KB.
Zabbix agent 2.0开始支持 |
|
| vfs.file.exists | ||||
| 检测文件是否存在 | 1 – 文件/硬链接/软连接文件存在 0 – 不存在 | file – 文件完整路径 | 例如:vfs.file.exists[/tmp/application.pid] | |
| vfs.file.md5sum | ||||
| 文件MD5校验码 | 文件MD5哈希值 | file – 完整路径 | 示例返回值:b5052decb577e0fffd622d6ddc017e82 示例:vfs.file.md5sum[/usr/local/etc/zabbix_agentd.conf]
1.8.6移除了64MB文件大小的限制 |
|
| vfs.file.regexp | ||||
| 文件中搜索字符串 | 包含字符串的行,或者为空 | file – 文件完整路径regexp – GNU正则表达encoding – 编码
start line – 从哪一行开始,默认第一行 end line – 从哪一行结束,默认最后一行 output – an optional output formatting template. The \0 escape sequence is replaced with the matched text while an \N(where N=1…9) escape sequence is replaced with Nth matched group (or an empty string if the N exceeds the number of captured groups). 如果 <output> 为空, 所有包含搜索字符串的行都会被返回 start line和end line从zabbix 2.0开始支持 |
仅返回首先匹配的行例如:vfs.file.regexp[/etc/passwd,zabbix]
vfs.file.regexp[/path/to/some/file,”([0-9]+)$”,,3,5,\1] vfs.file.regexp[/etc/passwd,^zabbix:.:([0-9]+),,,,\1] – getting the ID of user zabbix |
|
| vfs.file.regmatch | ||||
| 文件中搜索字符串 | 0 – 为找到1 – 找到 | file – 文件完整路径regexp – GNU 正则表达式encoding – 编码
start line – 哪行开始,默认第一行 end line – 哪行结束,默认最后一行 上面两个参数从 2.0版本开始支持。 |
例如:vfs.file.regmatch[/var/log/app.log,error] | |
| vfs.file.size
|
||||
| 文件大小 | 字节 | file – 完整路径 | zabbix必须有可读此文件的权限例如:vfs.file.size[/var/log/syslog] | |
| vfs.fs.discovery | ||||
| 列出挂载的文件系统 | Used for low-level discovery | JSON对象 | 从zabbix agent 2.0开始支持 | |
| vfs.fs.inode[fs,<mode>] | ||||
| inodes数量 | 数字 | fs – 文件系统mode – total (默认), free, used, pfree (空闲百分比), pused (使用百分比) | 例如:vfs.fs.inode[/,pfree]老命名规则:
vfs.fs.inode.free[*], vfs.fs.inode.pfree[*], vfs.fs.inode.total[*] |
|
| vfs.fs.size[fs,<mode>] | ||||
| 磁盘空间 | 字节 | fs – 文件系统mode – total (默认), free, used, pfree (空闲百分比), pused (使用百分比) | 返回本地文件系统的使用量.例如: vfs.fs.size[/tmp,free]老命名规则: vfs.fs.free[*], vfs.fs.total[*], vfs.fs.used[*], vfs.fs.pfree[*], vfs.fs.pused[*],*是任意挂载点 | |
| vm.memory.size[<mode>] | ||||
| 内存大小 | 字节或者百分比 | mode – total (默认), active, anon, buffers, cached, exec, file, free, inactive, pinned, shared, wired, used, pused, available, available其中挑一个 | 老命名规则: vm.memory.buffers, vm.memory.cached, vm.memory.free, vm.memory.shared, vm.memory.total监控项vm.memory.size[]允许三种类型的参数
第一类:包含total – 总内存 第二类: 系统指定内存类型:active, anon, buffers, cached, exec, file, free, inactive,pinned, shared, wired. 第三类:用户级别,一共使用了多少内存,还有多少内存可用: used, pused, available,pavailable. |
|
| web.page.get[host,<path>,<port>] | ||||
| 获取网页内容 | 网页源代码 | host – 主机名/域名path – 文件地址,默认/port – 端口,默认80 | 返回空字符串表示失败. 例如:web.page.get[www.ttlsa.com,/,80] |
|
| web.page.perf[host,<path>,<port>] | ||||
| 获取完全加载网页消耗的时长 | 秒 | host – 主机名/域名path – html地址,默认是/port – 端口,默认80 | 返回0表示失败. 例如: web.page.perf[www.ttlsa.com,/,80] | |
| web.page.regexp[host,<path>,<port>,<regexp>,<length>,<output>] | ||||
| 在网页中搜索字符串 | The matched string, or as specified by the optional<output>parameter. An empty string if no match was found. | host – 主机名path – html文件路径 (默认值 /)port – 端口 (默认80)
regexp – GNU正则表达式 length – 返回的最大的字符串数量 output – 输出格式模板可选项. The \0 escape sequence is replaced with the matched text while an \N(where N=1…9) escape sequence is replaced with Nth matched group (or an empty string if the N exceeds the number of captured groups). If <output> is left empty – the whole line containing the matched text is returned. The output parameter is supported from version 2.2. |
失败则返回空字符 (不匹配).示例:web.page.regexp[www.zabbix.com,index.php,80,OK,2] | |
| vfs.file.time | ||||
| 文件时间 | Unix时间戳. | file – 文件路径mode - one of modify (default, modification time), access - last access time, change - last change time | 示例:vfs.file.time[/etc/passwd,modify]
The file size limit depends on large file support. |
|
自学Zabbix3.5.3-监控项item-key的更多相关文章
- 自学Zabbix3.5.2-监控项item-types监控类型
自学Zabbix3.5.2-监控项item-types监控类型 1. item types item types是由zabbix提供的各种类型的检查器,大致就是Zabbix agent, Simple ...
- 自学Zabbix4.2 web监控项创建+item详解
自学Zabbix4.2 web监控项创建+item详解 1. web监控项创建 1.1 Scenario 选项卡 Name: 监控项的名称 Application: 放到哪个应用中 Authenti ...
- 自学Zabbix3.5.3-监控项item-zabbix agent 类型所有key
点击返回:自学Zabbix之路 点击返回:自学Zabbix4.0之路 点击返回:自学zabbix集锦 1. 温习 Zabbix server是Zabbix软件的中心进程. Server执行 ...
- 自学Zabbix3.5.1-监控项item-key介绍
点击返回:自学Zabbix之路 点击返回:自学Zabbix4.0之路 点击返回:自学zabbix集锦 自学Zabbix3.5.1-监控项item-key介绍 个人觉得艰难理解,故附上原文档:https ...
- 自学Zabbix3.5.1-监控项item-key详解
自学Zabbix3.5.1-监控项item-key详解个人觉得艰难理解,故附上原文档:https://www.zabbix.com/documentation/3.0/manual/config/it ...
- (9)zabbix创建监控项item
1. 创建监控项 点击配置(configuration)->主机(Hosts)->在你要配置的主机一栏上点击Items->点击create item.具体看截图,各个参数我都已经标注 ...
- (8)zabbix监控项item是什么
什么是item Items是从主机里面获取的所有数据.通常情况下我叫itme为监控项,例如服务器加入了zabbix监控,我需要监控它的cpu负载,那么实现这个方法的东西就叫item item构成 it ...
- zabbix 监控项(key)
Key 描述 返回值 参数 详细说明 agent.hostname 返回被监控端名称 字符串 - 返回配置文件中配置的被监控端的名称 agent.ping 检测被监控端是否存活 1 - 运行中 其他 ...
- 自学Zabbix3.5.4-监控项item-History and trends
历史和趋势是在Zabbix中存储收集数据的两种方法.然而,历史保持着每一个收集的价值,趋势保持每小时的平均信息,因此减少了对资源的需求. 1. 保留历史数据 我们可以通过如下方式来设置保留数据的时 ...
随机推荐
- mybatis从数据库中取到的date格式不是yyyy-MM-dd HH:mm:ss
问题:sqlserver中的存储时间格式为date,pojo的时间属性也是date,直接mybatis取出的时间格式是带英语的那种,不满足客户要求. 解决:将pojo的时间属性改为string类型,在 ...
- robotframework自动化系列:修改流程
在上一小节中,新增流程操作已经完成.那么接下来就是修改的流程操作了,对于一个页面的修改如何操作呢? 针对修改修改操作是在一个已经存在的账号直接修改还是新添加一个账号再修改呢?从用例设计健壮性出发,我们 ...
- C#3.0中的扩展方法
在实际应用中,开发者完成代码的编译后,除非重新编译更改后的代码,否则开发者很难在原有代码中添加新的功能. 在C#3.0中,提供了一个扩展方法的新特性,可以使得开发者在编译后的程序集里边添加相关的方法, ...
- org.springframework.web.filter.DelegatingFilterProxy的作用
一.类结构 DelegatingFilterProxy类继承GenericFilterBean,间接实现了Filter,故而该类属于一个过滤器.那么就会有实现Filter中init.doFilter. ...
- python打包exe pyinstaller 简单使用
源由 最近公司让做了一个小工具,使用python写的,写完之后要求能放在其它电脑上运行,于是就开始寻找方案; 按网上的说法 py2exe已经很久没更新了,资料也不多: 于是就采用pyinstaller ...
- Python crawler access to web pages the get requests a cookie
Python in the process of accessing the web page,encounter with cookie,so we need to get it. cookie i ...
- 最耗性能的SQL语句
设计优化–常见杀手级SQL •SELECT * vsSELECT col1, col2 •ORDER BY RAND() •LIMIT huge_num, offset •SELECT COUNT(* ...
- 彻底理解线程同步与同步代码块synchronized
public class Demo { public static synchronized void fun1(){ } public synchronized void fun2(){ } pub ...
- Android UsageStatsService(应用使用统计服务)的学习与调研
一. 简介 UsageStatsService是一个系统服务,其主要通过AMS等,来监测并记录各个应用的使用数据,如上次调用com.android.settings的时间等. UsageStatsSe ...
- liunx中图形化桌面环境中的脚本编程之——创建文本菜单
整体是通过建立菜单布局,然后根据菜单上的布局建立函数(就是为这些布局实现功能),最后将函数和布局实现逻辑上的相连: 如何建立菜单布局? 整体上是通过打印字符创建出,因此需要使用echo命令,但是有一些 ...