Qt Creator调试
与调试器交互的几种方法:
1、单行运行或者单指令运行
2、中断程序运行
3、设置断点
4、检查调用栈空间的内容
5、检查并修改局部或者全局变量
6、检查并修改被调试程序的寄存器和内存内容
7、检查装载的共享库列表
8、反汇编代码段
9、创建当前被调试程序状态快照并在之后重新检测
调试器的使用
在调试模式中,可以选择Window->Views,打开需要的视窗查看相应的数据。默认情况下,视窗都是锁定在workspace中的,可以选择Window->Views->Locked取消锁定,视窗支持拖动调整位置以及大小,使用Reset Dafault Layout可以恢复为原来的位置和大小。
调试中使用的快捷键:略
设置断点
三种添加断点的方式:
In the code editor, click the left margin or press F9 (F8 for Mac OS X) at a particular line you want the program to stop.
In the Breakpoints view, double-click in the empty part of the view.
In the Breakpoints view, select Add Breakpoint in the context menu.
可以选择断点的类型:
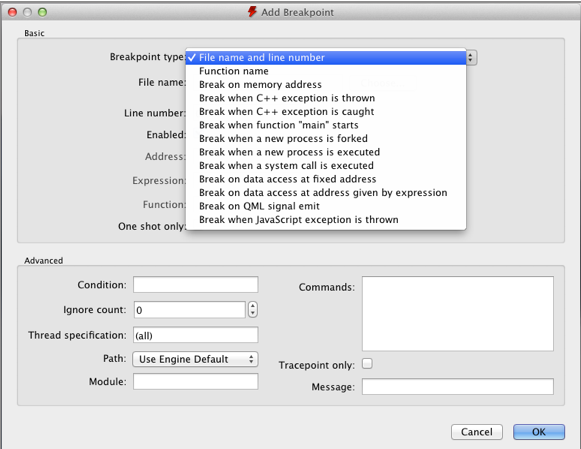
上图Condition:设置断点的中断触发条件
Ignore count:设置程序中止前,忽略此断点的次数。
Commands: 设置程序中止后需要执行的指令, 一条指令占一行,指令会被顺序执行。
更多关于断点的信息参考
http://sourceware.org/gdb/onlinedocs/gdb/Breakpoints.html#Breakpoints
移动断点
可以直接拖动到另一行。
删除断点
Click the breakpoint marker in the text editor.
Select the breakpoint in the Breakpoints view and press Delete.
Select Delete Breakpoint in the context menu in the Breakpoints view.
设置数据断点
当特定的地址的数据被读写之后数据断点会中断程序。
设置某地址的数据断点:
1. Right-click in the Breakpoints view to open the context menu, and select Add Breakpoint.
2. In the Breakpoint type field, select Break on data access at fixed address.
3. In the Address field, specify the address of the memory block.
4. Select OK.
If the address is displayed in the Locals and Expressions view, you can select Add Data Breakpoint at Object's Address in the context menu to set the data breakpoint.
查看调用堆栈跟踪
局部变量和表达式
显示函数的参数以及局部变量
Compound variables of struct or class type are displayed as expandable in the view. Expand entries to show all members. Together with the display of value and type, you can examine and traverse the low-level layout of object data.
The Locals and Expressions view also provides access to the most powerful feature of the debugger: comprehensive display of data belonging to Qt's basic objects. For example, in case of QObject, instead of displaying a pointer to some private data structure, you see a list of children, signals and slots.
Similarly, instead of displaying many pointers and integers, Qt Creator's debugger displays the contents of a QHash or QMap in an orderly manner. Also, the debugger displays access data for QFileInfo and provides access to the "real" contents of QVariant.
Right-click in the the Locals and Expressions view to open a context menu that provides additional options for viewing data. The available options depend on the type of the current items, and are provided by the Debugging Helpers. Typically, string-like data, such as QByteArray and std::string, offer a selection of encodings, as well as the possibility to use a full editor window. Map-like data, such as QMap, QHash, and std::map, offer a compact option using the name column for keys, resulting in a concise display of containers with short keys, such as numbers or short strings. For example, to expand all the values of QMap, select Change Local Display Format > Compact.
You can use the Locals and Expressions view to change the contents of variables of simple data types, for example, int, float, QString and std::string when the program is interrupted. To do so, click the Value column, modify the value with the inplace editor, and press Enter (or Return).
To change the complete contents of QVector or std::vector values, type all values separated by commas into the Value column of the main entry.
You can enable tooltips in the main editor displaying this information. For more information, see Showing Tooltips in Debug Mode.
Note: The set of evaluated expressions is saved in your session.
直接与本地调试器交互
......
调试C++应用程序
......
原文:
You can use the Qt Creator Debug mode to inspect the state of your application while debugging. You can interact with the debugger in several ways, including the following:
Go through a program line-by-line or instruction-by-instruction.
Interrupt running programs.
Set breakpoints.
Examine the contents of the call stack.
Examine and modify contents of local and global variables.
Examine and modify registers and memory contents of the debugged program.
Examine the list of loaded shared libraries.
Disassemble sections of code.
Create snapshots of the current state of the debugged program and re-examine them later.
Qt Creator displays the raw information provided by the native debuggers in a clear and concise manner with the goal to simplify the debugging process as much as possible without losing the power of the native debuggers.
In addition to the generic IDE functionality provided by stack view, views for locals and expressions, registers, and so on, Qt Creator includes features to make debugging Qt-based applications easy. The debugger plugin understands the internal layout of several Qt classes, for example, QString, the Qt containers, and most importantly QObject (and classes derived from it), as well as most containers of the C++ Standard Library and some GCC extensions. This deeper understanding is used to present objects of such classes in a useful way.
Using the Debugger
In Debug mode, you can use several views to interact with the program you are debugging. The availability of views depends on whether you are debugging C++ or QML. Frequently used views are shown by default and rarely used ones are hidden. To change the default settings, select Window > Views, and then select views to display or hide. Alternatively, you can enable or disable views from the context menu of the title bar of any visible debugger view.
"Debug mode views"
By default, the views are locked into place in the workspace. Select Window > Views > Locked to unlock the views. Drag and drop the views into new positions on the screen. Drag view borders to resize the views. The size and position of views are saved for future sessions. Select Window > Views > Reset to Default Layout to reset the views to their original sizes and positions.
Once the program starts running under the control of the debugger, it behaves and performs as usual. You can interrupt a running C++ program by selecting Debug > Interrupt. The program is automatically interrupted when a breakpoint is hit.
Once the program stops, Qt Creator:
Retrieves data representing the call stack at the program's current position.
Retrieves the contents of local variables.
Examines Expressions.
Updates the Registers, Modules, and Disassembler views if you are debugging the C++ based applications.
You can use the Debug mode views to examine the data in more detail.
You can use the following keyboard shortcuts:
To finish debugging, press Shift+F5.
To execute a line of code as a whole, press F10.
To step into a function or a subfunction, press F11.
To continue running the program, press F5.
To run to the selected function when you are stepping into a nested function, press Ctrl+F6.
It is also possible to continue executing the program until the current function completes or jump to an arbitrary position in the current function.
Setting Breakpoints
A breakpoint represents a position or sets of positions in the code that, when executed, interrupts the program being debugged and passes the control to you. You can then examine the state of the interrupted program, or continue execution either line-by-line or continuously.
Qt Creator shows breakpoints in the Breakpoints view which is enabled by default. The Breakpoints view is also accessible when the debugger and the program being debugged is not running.
"Breakpoints view"
You can associate breakpoints with:
Source code files and lines
Functions
Addresses
Throwing and catching exceptions
Executing and forking processes
Executing some system calls
Changes in a block of memory at a particular address when a program is running
The interruption of a program by a breakpoint can be restricted with certain conditions.
You can set and delete breakpoints before the program starts running or while it is running under the debugger's control. Breakpoints are saved together with a session.
Adding Breakpoints
To add breakpoints:
Add a new breakpoint in one of the following ways:
In the code editor, click the left margin or press F9 (F8 for Mac OS X) at a particular line you want the program to stop.
In the Breakpoints view, double-click in the empty part of the view.
In the Breakpoints view, select Add Breakpoint in the context menu.
In the Breakpoint type field, select the location in the program code where you want the program to stop. The other options to specify depend on the selected location.
"Add Breakpoints" dialog
In the Condition field, set the condition to be evaluated before stopping at the breakpoint if the condition evaluates as true.
In the Ignore field, specify the number of times that the breakpoint is ignored before the program stops.
In the Commands field, specify the commands to execute when the program stops; one command on a line. GDB executes the commands in the order in which they are specified.
For more information on breakpoints, see Breakpoints, Watchpoints, and Catchpoints in GDB documentation.
Moving Breakpoints
To move the breakpoint, drag and drop a breakpoint marker to another line.
Deleting Breakpoints
To delete breakpoints:
Click the breakpoint marker in the text editor.
Select the breakpoint in the Breakpoints view and press Delete.
Select Delete Breakpoint in the context menu in the Breakpoints view.
Setting Data Breakpoints
A data breakpoint stops the program when data is read or written at the specified address.
To set a data breakpoint at an address:
Right-click in the Breakpoints view to open the context menu, and select Add Breakpoint.
In the Breakpoint type field, select Break on data access at fixed address.
In the Address field, specify the address of the memory block.
Select OK.
If the address is displayed in the Locals and Expressions view, you can select Add Data Breakpoint at Object's Address in the context menu to set the data breakpoint.
Viewing Call Stack Trace
When the program being debugged is interrupted, Qt Creator displays the nested function calls leading to the current position as a call stack trace. This stack trace is built up from call stack frames, each representing a particular function. For each function, Qt Creator tries to retrieve the file name and line number of the corresponding source file. This data is shown in the Stack view.
Since the call stack leading to the current position may originate or go through code for which no debug information is available, not all stack frames have corresponding source locations. Stack frames without corresponding source locations are grayed out in the Stack view.
If you click a frame with a known source location, the text editor jumps to the corresponding location and updates the Locals and Expressions view, making it seem like the program was interrupted before entering the function.
Locals and Expressions
Whenever a program stops under the control of the debugger, it retrieves information about the topmost stack frame and displays it in the Locals and Expressions view. The Locals and Expressions view typically includes information about parameters of the function in that frame as well as the local variables.
"Locals and Expressions view"
Compound variables of struct or class type are displayed as expandable in the view. Expand entries to show all members. Together with the display of value and type, you can examine and traverse the low-level layout of object data.
Note:
GDB, and therefore Qt Creator's debugger works for optimized builds on Linux and Mac OS X. Optimization can lead to re-ordering of instructions or removal of some local variables, causing the Locals and Expressions view to show unexpected data.
The debug information provided by GCC does not include enough information about the time when a variable is initialized. Therefore, Qt Creator can not tell whether the contents of a local variable contains "real data", or "initial noise". If a QObject appears uninitialized, its value is reported as not in scope. Not all uninitialized objects, however, can be recognized as such.
The Locals and Expressions view also provides access to the most powerful feature of the debugger: comprehensive display of data belonging to Qt's basic objects. For example, in case of QObject, instead of displaying a pointer to some private data structure, you see a list of children, signals and slots.
Similarly, instead of displaying many pointers and integers, Qt Creator's debugger displays the contents of a QHash or QMap in an orderly manner. Also, the debugger displays access data for QFileInfo and provides access to the "real" contents of QVariant.
Right-click in the the Locals and Expressions view to open a context menu that provides additional options for viewing data. The available options depend on the type of the current items, and are provided by the Debugging Helpers. Typically, string-like data, such as QByteArray and std::string, offer a selection of encodings, as well as the possibility to use a full editor window. Map-like data, such as QMap, QHash, and std::map, offer a compact option using the name column for keys, resulting in a concise display of containers with short keys, such as numbers or short strings. For example, to expand all the values of QMap, select Change Local Display Format > Compact.
You can use the Locals and Expressions view to change the contents of variables of simple data types, for example, int, float, QString and std::string when the program is interrupted. To do so, click the Value column, modify the value with the inplace editor, and press Enter (or Return).
To change the complete contents of QVector or std::vector values, type all values separated by commas into the Value column of the main entry.
You can enable tooltips in the main editor displaying this information. For more information, see Showing Tooltips in Debug Mode.
Note: The set of evaluated expressions is saved in your session.
Directly Interacting with Native Debuggers
In some cases, it is convenient to directly interact with the command line of the native debugger. In Qt Creator, you can use the left pane of the Debugger Log view for that purpose. When you press Ctrl+Enter, the contents of the line under the text cursor are sent directly to the native debugger. Alternatively, you can use the line edit at the bottom of the view. Output is displayed in the right pane of the Debugger Log view.
Note: Usually, you do not need this feature, because Qt Creator provides you with better ways to handle the task. For example, instead of using the GDB print command from the command line, you can evaluate an expression in the Locals and Expressions view.
Debugging C++ Based Applications
The following sections describe additional debugging functions that apply only to debugging C++.
Starting the Debugger from the Command Line
You can use the Qt Creator debugger interface from the command line. To attach it to a running process, specify the process ID as a parameter for the -debug option. To examine a core file, specify the file name. Qt Creator executes all the necessary steps, such as searching for the binary that belongs to a core file. To connect to a debug server, specify the server location and port number.
For example:
C:\qtcreator\bin>qtcreator -debug 2000
C:\qtcreator\bin>qtcreator -debug core=core.2000
C:\qtcreator\bin>qtcreator -debug some.exe,core=core
C:\qtcreator\bin>qtcreator -debug server=some.dot.com:4251
For more information, see Using Command Line Options.
Stepping into Frameworks in Mac OS
In Mac OS X, external libraries are usually built into so-called Frameworks, which may contain both release and debug versions of the library. When you run applications on the Mac OS desktop, the release version of Frameworks is used by default. To step into Frameworks, select the Use debug versions of Frameworks option in the project run settings.
Viewing Threads
If a multi-threaded program is interrupted, the Threads view or the combobox named Threads in the debugger status bar can be used to switch from one thread to another. The Stack view adjusts itself accordingly.
Viewing Modules
The Modules view displays information that the debugger plugin has about modules included in the application that is being debugged. A module is a dynamic link library (.dll) in Windows, a shared object (.so) in Linux, and a dynamic shared library (.dylib) in Mac OS.
In addition, the view displays symbols within the modules and indicates where each module was loaded.
Right-click the view to open a context menu that contains menu items for:
Updating the module list
Loading symbols for modules
Examining modules
Editing module files
Showing symbols in modules
Showing dependencies between modules (Windows only)
By default, the Modules view is hidden.
Viewing Source Files
The Source Files view lists all the source files included in the project. If you cannot step into an instruction, you can check whether the source file is actually part of the project, or whether it was compiled elsewhere. The view shows the path to each file in the file system.
Right-click the view to open a context menu that contains menu items for reloading data and opening files.
By default, the Source Files view is hidden.
Viewing Disassembled Code and Register State
The Disassembler view displays disassembled code for the current function. The Registers view displays the current state of the CPU's registers.
The Disassembler view and the Registers view are both useful for low-level commands for checking single instructions, such as Step Into and Step Over. By default, both Disassembler and Registers view are hidden.
Creating Snapshots
A snapshot contains the complete state of the debugged program at a time, including the full memory contents.
To create snapshots of a debugged program, select Create Snapshot in the context menu in the Snapshots view.
Double-click on entries in the Snapshots view to switch between snapshots. The debugger views are updated to reflect the state of the program at time of taking the snapshot.
Qt Creator调试的更多相关文章
- win7/10下Qt Creator调试提示:The selected debugger may be inappropriate for the inferior的解决办法
在win7/10下Qt Creator调试提示:The selected debugger may be inappropriate for the inferior的错误提示内容如下图所示: 一般弹 ...
- Qt Creator 调试器 在 Ubuntu 13.10下 局部变量和表达式(Locals) 无内容
此篇算是一个翻译,万一有国内同样的小白遇到同样问题,方便参考. 原文http://hostilefork.com/2013/10/20/qtcreator-debugger-no-locals-ubu ...
- QT creator 调试问题
问题:debug出现“ptrace:不允许的操作.” 解决办法: # may not be appropriate for developers or servers with only admin ...
- windows下,Qt Creator 中javascript调试器安装并使用
最开始使用Qt Creator时,想使用断点来调试javascript代码.但在按下debug键后,却提示调试器未配置,让我比较郁闷. 好了,郁闷的是说了,咱们来说说高兴的.要Qt Creator调试 ...
- [转载]ROS开发环境之Qt Creator
ROS开发环境之Qt Creator(http://my.phirobot.com/blog/2013-12-ros_ide_qtcreator.html) Created at: 2013-12-2 ...
- 使用Qt Creator进行linux远程调试
序言 考虑到程序员在无桌面Linux的环境下编写C/C++程序,如果使用原生的Vim编辑和单步断点调试比较麻烦,不利于新手使用,所以笔者尝试使用Qt实现两台Linux电脑远程部署和调试.即程序员在调试 ...
- Qt Creator + MinGW 在windows 下的调试GDB停止工作解决
Qt的安装配置请参考本博客本分类下的其他相关文章,本文主要整理在调试时候遇到的问题和解决方法供遇到同样问题的同学参考.由于我之前也没有任何Qt的开发基础,做的也是硬件方面设计,所以这方面基础还是比较薄 ...
- Qt Creator在Windows上的调试器安装与配置
如果安装Qt时使用的是Visual Studio的预编译版,那么很有可能就会缺少调试器(Debugger),而使用MSVC的Qt对应的原生调试器是CDB(对应MinGW的Qt使用GDB调试器).本文介 ...
- Qt Creator下应用CMake项目调试mex文件
网上可以找到很多应用Visual Studio编写.编译mex文件,并与MATLAB联合调试的文章.但这只限于Win平台,网上许多源码都是.mexa64的文件,它们的作者是怎么调试的呢?这里我介绍一下 ...
随机推荐
- 创建dialog
创建一个dialog有一下两种方式: 1.Data属性:DOM添加属性data-toggle="dialog"后,单机触发. a链接打开: <a href="jso ...
- 关于Mapper、Reducer的个人总结(转)
Mapper的处理过程: 1.1. InputFormat 产生 InputSplit,并且调用RecordReader将这些逻辑单元(InputSplit)转化为map task的输入.其中Inpu ...
- javascript 变量声明有var与无var 的区别
1.在函数作用域内 加var定义的变量是局部变量,不加var定义的就成了全局变量.使用var定义var a = 'hello World';function bb(){var a = 'hello B ...
- 前端页面js与flash交互——js获取flash对象,并传递参数
背景介绍: 最近在搞一个项目,涉及到图片选取,裁剪,上传等,由于浏览器安全性问题,js无法获取到<input type="file">中选取的文件路径,而且对照片的裁剪 ...
- STL源码分析《3》----辅助空间不足时,如何进行归并排序
两个连在一起的序列 [first, middle) 和 [middle, last) 都已经排序, 归并排序最核心的算法就是 将 [first, middle) 和 [middle, last) 在 ...
- select2美化下拉单
http://www.51xuediannao.com/js/jquery/select2.html http://www.51xuediannao.com/demo.php
- 解决:子元素设置margin-top,父元素也受影响的问题
<!doctype html><html> <head> <meta charset="UTF-8"> <title>子 ...
- 在Silverlight中实施RESTful调用
在Silverlight中实施RESTful调用: http://book.51cto.com/art/201006/206314.htm http://bbs.csdn.net/topic ...
- lua元表和元方法 《lua程序设计》 13章 读书笔记
lua中每个值都有一个元表,talble和userdata可以有各自独立的元表,而其它类型的值则共享其类型所属的单一元表.lua在创建table时不会创建元表. t = {} print(getmet ...
- M1: 创建UWP空项目
本小节介绍如何在Visual Studio中创建一个UWP项目,Visual Studio中提供了快速创建各种项目的类型模板.在Visual Studio 2015中,同样提供了UWP项目模板. 学完 ...