漫谈可视化Prefuse(四)---被玩坏的Prefuse API
这个双12,别人都在抢红包、逛淘宝、上京东,我选择再续我的“漫谈可视化”系列(好了,不装了,其实是郎中羞涩。。。)
上篇《漫谈可视化Prefuse(三)---Prefuse API数据结构阅读有感》主要介绍了可视化工具Prefuse API中主要解读的是prefuse.data包中的主要接口,并利用《漫谈可视化Prefuse(一)---从SQL Server数据库读取数据》中例子,将参数配置模块剥离出来,实现界面传值,绘制图形。
本篇决定不再贴API,实在没啥意思,还占篇幅(但是不容置疑的是API确实很重要,想了解API点这里)。那今天我们主要讲讲Prefuse比较常用的包以及如何使用这些包做出自己想要的展示效果:
Demo1.解决图形元素形状单一化问题——DataShapeAction的使用
Prefuse对于节点的形状默认是使用Constants.SHAPE_RECTANGLE,这里使用DataShapeAction类完成一个图形中根据性别不同展示不同的节点形状,具体代码如下:
 public class Demo1 {

     /**

      * @param args

      */

     public static void main(String[] args) {

         Graph graph = null;

         try {

             graph = new GraphMLReader().readGraph("socialnet.xml");

         } catch (Exception e) {

             e.printStackTrace();

             System.out.println("Error loading");

             System.exit(1);

         }

         Visualization vis = new Visualization();

         vis.add("graph", graph);

         vis.setRendererFactory(new DefaultRendererFactory());

         int[] palette = new int[]{ColorLib.rgb(255, 180, 180),ColorLib.rgb(190, 190, 255)};

         DataColorAction fill = new DataColorAction("graph.nodes" , "gender" , Constants.NOMINAL, VisualItem.FILLCOLOR,palette);

         ColorAction text = new ColorAction("graph.nodes", VisualItem.TEXTCOLOR, ColorLib.gray(0));

         ColorAction edges = new ColorAction("graph.edges", VisualItem.STROKECOLOR, ColorLib.gray(200));

         int[] shapes = new int[]{ Constants.SHAPE_RECTANGLE, Constants.SHAPE_DIAMOND};

         DataShapeAction shape = new DataShapeAction("graph.nodes", "gender", shapes);

         ActionList color = new ActionList();

         color.add(fill);

         color.add(text);

         color.add(edges);

         color.add(shape);

         ActionList layout = new ActionList(Activity.INFINITY);

         layout.add(new ForceDirectedLayout("graph"));

         layout.add(new RepaintAction());

         vis.putAction("color", color);

         vis.putAction("layout", layout);

         Display display = new Display(vis);

         display.setSize(750, 700);

         display.pan(250, 250);

         display.addControlListener(new DragControl());

         display.addControlListener(new PanControl());

         display.addControlListener(new ZoomControl());

         display.addControlListener(new WheelZoomControl());

         display.addControlListener(new FocusControl(1));

         display.addControlListener(new ZoomToFitControl());

         JFrame jf = new JFrame();

         jf.setDefaultCloseOperation(JFrame.EXIT_ON_CLOSE);

         jf.add(display);

         jf.pack();

         jf.setVisible(true);

         vis.run("color");

         vis.run("layout");

     }

 }
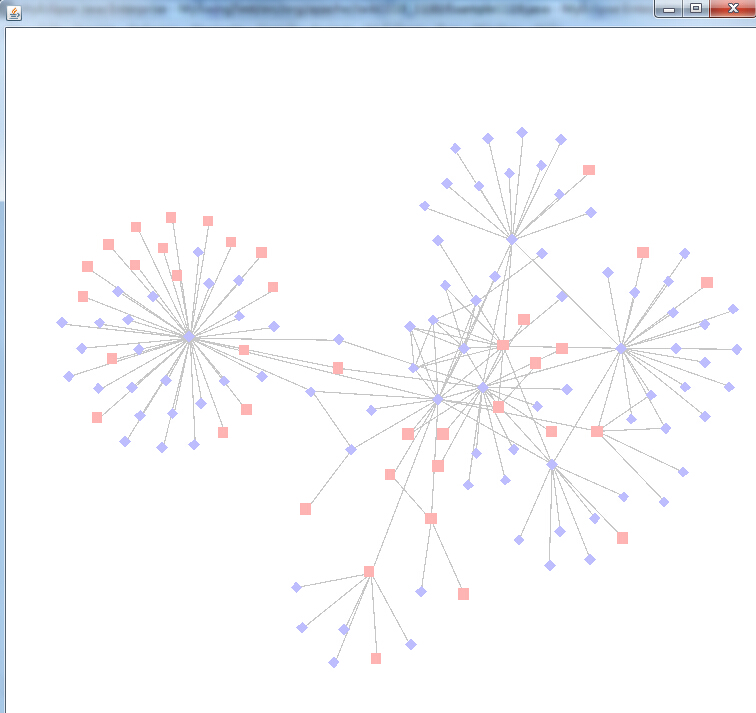
DataShapeAction中的第一个参数为指定数据范围,这里指定针对“graph.nodes”点集;第二个参数为属性域,这里针对性别不同赋予不同的形状;第三个参数是形状数组,这里定义了Constants.SHAPE_RECTANGLE, Constants.SHAPE_DIAMOND,除此之外还有Constants.SHAPE_CROSS、Constants.SHAPE_ELLIPSE、Constants.SHAPE_STAR等。同理prefuse.action.assignment包下的DataColorAction用法与DataShapeAction类似。图形展示效果如下:
Demo2:打破输入输出流的垄断亲自绘制图形——Graph的使用
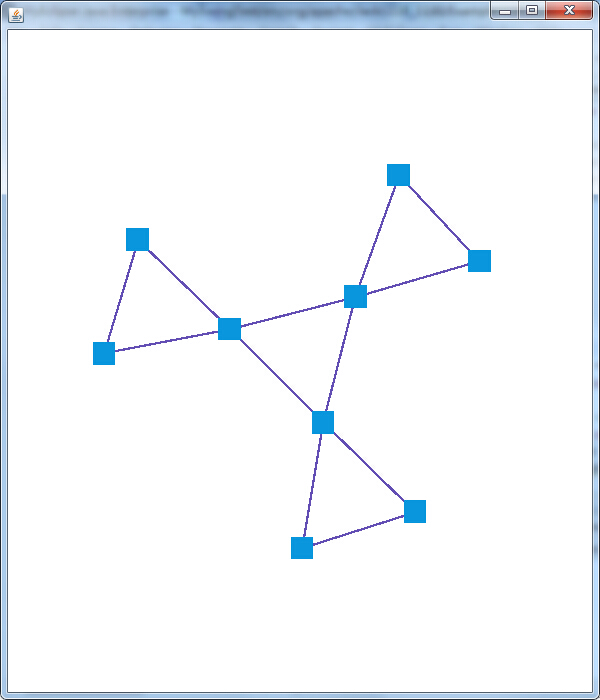
之前几篇介绍的例子主要依赖于prefuse.io中的读入写出操作类进行数据的导入,这里我们决定甩开膀子,自己丰衣足食,打造自己的图形,这里主要使用Graph类的添加节点以及添加边的方法,构建一个互连的三个三角形的形状。具体代码如下:
 public class Demo2{

     public static void main(String[] argv) {

         Visualization vis = new Visualization();

         Graph g = new Graph();

         for(int i = 0; i<3; i++){

             Node n1 = g.addNode();

             Node n2 = g.addNode();

             Node n3 = g.addNode();

             g.addEdge(n1, n2);

             g.addEdge(n2, n3);

             g.addEdge(n3, n1);

         }

         g.addEdge(0, 3);

         g.addEdge(3, 6);

         g.addEdge(6, 0);

         vis.add("graph", g);

         ShapeRenderer renderer = new ShapeRenderer(10);

         vis.setRendererFactory(new DefaultRendererFactory(renderer));

         ColorAction nodeFill = new ColorAction("graph.nodes", VisualItem.FILLCOLOR, ColorLib.rgb(10, 150, 220));

         ColorAction edgesStroke = new ColorAction("graph.edges", VisualItem.STROKECOLOR, ColorLib.rgb(100, 80, 180));

         ColorAction nodeHighlight = new ColorAction("graph.nodes", VisualItem.HIGHLIGHT, ColorLib.rgb(10, 150, 220));

         ActionList color = new ActionList();

         color.add(nodeFill);

         color.add(edgesStroke);

         ActionList layout = new ActionList(Activity.INFINITY);

         layout.add(color);

         layout.add(new ForceDirectedLayout("graph"));

         layout.add(new RepaintAction());

         Display display = new Display(vis);

         display.setSize(400, 500);

         display.pan(250, 250);

         display.addControlListener(new DragControl());

         display.addControlListener(new PanControl());

         display.addControlListener(new ZoomControl());

         display.addControlListener(new WheelZoomControl());

         display.addControlListener(new FocusControl(1));

         display.addControlListener(new ZoomToFitControl());

         vis.putAction("color", color);

         vis.putAction("layout", layout);

         JFrame frame = new JFrame();

         frame.setDefaultCloseOperation(JFrame.EXIT_ON_CLOSE);

         frame.pack();

         frame.setSize(600, 700);

         frame.add(display);

         frame.setVisible(true);

         vis.run("color");

         vis.run("layout");

     }

 }
从代码可以看出,对于创建节点、添加边,Graph处理的游刃有余,只有你想不到的图形,没有创建不了的Graph。当然只是简单创建了node和edge只是有了骨架,还需要血肉的填充,所以可以看到有很多的Action纷纷来助阵,最终的众志成城之作如下:
Demo3:谁说点点之间只能“直肠子”——EdgeRenderer的使用
看不惯点与点之间的“直肠子”?可以,Prefuse了解你,知道你喜新厌旧,这不使用EdgeRenderer就可以实现曲线连接,具体代码与Demo1相近,只是多了一下几行代码:
 DefaultRendererFactory rf = new DefaultRendererFactory(label);

 EdgeRenderer edgeRenderer = new EdgeRenderer(Constants.EDGE_TYPE_CURVE);

 rf.add(new InGroupPredicate("graph.edges"), edgeRenderer);
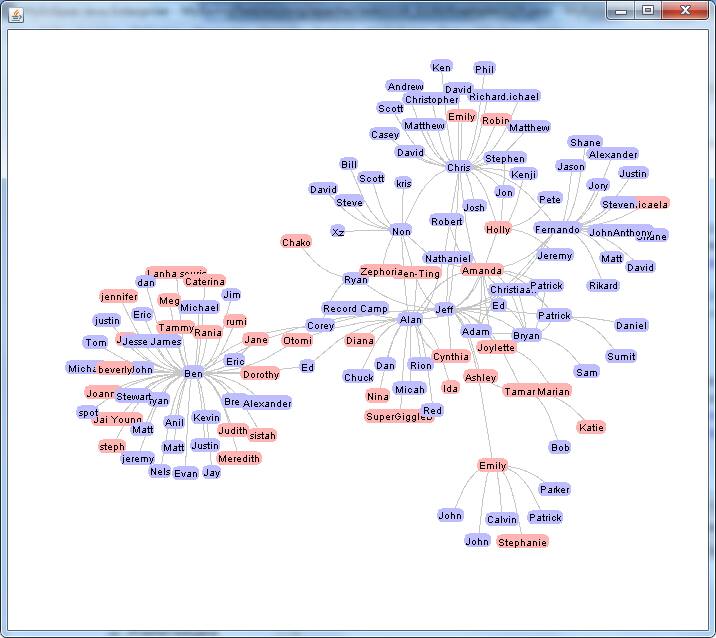
这里采用EdgeRenderer边渲染器,将边渲染为曲线,并统一应用到组“graph.edges”中的元素上,除了Constants.EDGE_TYPE_CURVE,还有Constants.EDGE_ARROW_FORWARD、Constants.EDGE_ARROW_NONE等。话不多说,看效果:
Demo4:Prefuse没节操?不知道筛选?No!——Predicate的使用
Prefuse自带过滤器,可以完成十分强大的过滤操作,视个别情况个别对待。拿Demo2中的图形来说,处在中间的节点可以不收节点控制(无法拖拽,不能交互),人家兄弟姐妹多,就拿那些势力若的边缘小弟拖过来拽过去^_^。具体代码如下:
 public class Demo4{

     public static void main(String[] argv) {

         Visualization vis = new Visualization();

         Graph g = new Graph();

         for(int i = 0; i<3; i++){

             Node n1 = g.addNode();

             Node n2 = g.addNode();

             Node n3 = g.addNode();

             g.addEdge(n1, n2);

             g.addEdge(n2, n3);

             g.addEdge(n3, n1);

         }

         g.addEdge(0, 3);

         g.addEdge(3, 6);

         g.addEdge(6, 0);

         vis.add("graph", g);

         ShapeRenderer renderer = new ShapeRenderer(10);

         EdgeRenderer edgeRenderer = new EdgeRenderer(Constants.EDGE_TYPE_CURVE);

         DefaultRendererFactory drf = new DefaultRendererFactory();

         drf.add(new InGroupPredicate("graph.edges"), edgeRenderer);

         vis.setRendererFactory(drf);

         ColorAction nodeFill = new ColorAction("graph.nodes", VisualItem.FILLCOLOR, ColorLib.rgb(10, 150, 220));

         ColorAction edgesStroke = new ColorAction("graph.edges", VisualItem.STROKECOLOR, ColorLib.rgb(100, 80, 180));

         ColorAction nodeHighlight = new ColorAction("graph.nodes", VisualItem.HIGHLIGHT, ColorLib.rgb(10, 150, 220));

         ShapeAction  shape = new ShapeAction("graph.nodes",Constants.SHAPE_CROSS); //设置节点形状

         ActionList color = new ActionList();

         color.add(nodeFill);

         color.add(edgesStroke);

         color.add(shape);

         ActionList layout = new ActionList(Activity.INFINITY);

         layout.add(color);

         layout.add(new ForceDirectedLayout("graph"));

         layout.add(new RepaintAction());

         Point p = new Point(100,200);

         p.move(300, 400);

         Predicate pCount =(Predicate)ExpressionParser.parse("degree()>2");

         Display display = new Display(vis);

         display.setSize(400, 500);

         display.pan(250, 250);

         display.animatePanAbs(230, 220, 2000);

         display.addControlListener(new DragControl());

         display.addControlListener(new PanControl());

         display.addControlListener(new ZoomControl());

         display.addControlListener(new WheelZoomControl());

         display.addControlListener(new FocusControl(1));

         display.addControlListener(new ZoomToFitControl());

         vis.removeGroup("graph");

         VisualGraph vg = vis.addGraph("graph", g);

         Iterator nodes = vg.nodes();

         display.addControlListener(new ControlAdapter() {

             public void itemEntered(VisualItem item, MouseEvent e) {

                 System.out.println("伦家已经是:" + item.getGroup()+"的人了");

             }

             public void itemExited(VisualItem item, MouseEvent e) {

                 System.out.println("哦,那杰哥再找找-_-");

             }

         });//为组件添加监控并作相应的响应

         vis.setInteractive("graph.nodes", pCount, false);

         vis.putAction("color", color);

         vis.putAction("layout", layout);

         JFrame frame = new JFrame();

         frame.setDefaultCloseOperation(JFrame.EXIT_ON_CLOSE);

         frame.pack();

         frame.setSize(600, 700);

         frame.add(display);

         frame.setVisible(true);

         vis.run("color");

         vis.run("layout");

     }

 }
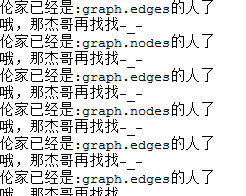
这里Predicate pCount =(Predicate)ExpressionParser.parse("degree()>2")表示过滤出节点度数大于2的,该过滤条件在vis.setInteractive("graph.nodes", pCount, false)中执行,即在组“graph.nodes”元素中节点度数大于2的不能交互(即鼠标拖拽无效)。
另外从代码中可以看出当鼠标经过和离开VisualItem(点或边)时会执行相应的操作,下图展现了部分结果:
Demo5:个性化定制,我有我个性——VisualItem的领悟
要知道,在数据中心Visualizaiton里,每一个node或是edge都可以看成一个VisualItem,每个VisualItem都可以有属于自己的造型、尺寸,这里我们还是用Demo2中的图形继续玩,直到玩坏为止。具体代码如下:
 public class Demo5{

     public static Visualization vis = new Visualization();

     public static void main(String[] argv) {

         Graph g = new Graph();

         for(int i = 0; i<3; i++){

             Node n1 = g.addNode();

             Node n2 = g.addNode();

             Node n3 = g.addNode();

             g.addEdge(n1, n2);

             g.addEdge(n2, n3);

             g.addEdge(n3, n1);

         }

         g.addEdge(0, 3);

         g.addEdge(3, 6);

         g.addEdge(6, 0);

         vis.add("graph", g);

         ShapeRenderer renderer = new ShapeRenderer(10);

         vis.setRendererFactory(new DefaultRendererFactory(renderer));

         vis.removeGroup("graph");

         VisualGraph vg = vis.addGraph("graph", g);

         VisualItem nodeI = (VisualItem)vg.getEdge(7).getSourceNode();

         nodeI.setShape(Constants.SHAPE_STAR);

         nodeI.setSize(4);

         nodeI.setFixed(true);

         VisualItem edgeI = (VisualItem)vg.getEdge(5);

         edgeI.setSize(8);

         ColorAction nodeFill = new ColorAction("graph.nodes", VisualItem.FILLCOLOR, ColorLib.rgb(10, 150, 220));

         ColorAction edgesStroke = new ColorAction("graph.edges", VisualItem.STROKECOLOR, ColorLib.rgb(100, 80, 180));

         ColorAction nodeHighlight = new ColorAction("graph.nodes", VisualItem.HIGHLIGHT, ColorLib.rgb(10, 150, 220));

         ActionList color = new ActionList();

         color.add(nodeFill);

         color.add(edgesStroke);

         ActionList layout = new ActionList(3000);

         layout.add(color);

         layout.add(new ForceDirectedLayout("graph"));

         layout.add(new RepaintAction());

         Display display = new Display(vis);

         display.setSize(400, 500);

         display.pan(250, 250);

         display.addControlListener(new DragControl());

         display.addControlListener(new PanControl());

         display.addControlListener(new ZoomControl());

         display.addControlListener(new WheelZoomControl());

         display.addControlListener(new FocusControl(1));

         display.addControlListener(new ZoomToFitControl());

         display.addControlListener(new ControlAdapter(){

             public void itemEntered(VisualItem item, MouseEvent e) {

                 System.out.println("伦家已经是:" + item.getGroup()+"的人了");

                 vis.run("color");

                 vis.run("layout");//重绘三秒

             }

         });

         vis.putAction("color", color);

         vis.putAction("layout", layout);

         JFrame frame = new JFrame();

         frame.setDefaultCloseOperation(JFrame.EXIT_ON_CLOSE);

         frame.pack();

         frame.setSize(600, 700);

         frame.add(display);

         frame.setVisible(true);

         vis.run("color");

         vis.run("layout");

     }

 }
可以看出代码中nodeI.setShape(Constants.SHAPE_STAR);nodeI.setSize(4);nodeI.setFixed(true);是将节点的形状设为星形,大小放大为4并固定此节点;edgeI.setSize(8);将边的粗细设为8。这里还具有一个功能,就是代码跑起来显示图形运行三秒,当鼠标经过某点或边是,整个图形在运行三秒,为展示这种效果,首次使用ps做gif,想想也是醉了。。。
Prefuse就先玩到这吧,真材实料送上5个Demo,虽然抢不到红包,抢点Demo补补脑也不错哦,走到这里,似乎我已经拉近了与Prefuse的距离,下一步就是力求亲密接触,碰撞出可视化狂拽炫酷的展示效果。觉得有用,记得点赞哦。
本文链接:《漫谈可视化Prefuse(四)---被玩坏的Prefuse API》http://www.cnblogs.com/bigdataZJ/p/VisualizationSoloShow4.html
友情赞助
如果你觉得博主的文章对你那么一点小帮助,恰巧你又有想打赏博主的小冲动,那么事不宜迟,赶紧扫一扫,小额地赞助下,攒个奶粉钱,也是让博主有动力继续努力,写出更好的文章^^。
1. 支付宝 2. 微信


漫谈可视化Prefuse(四)---被玩坏的Prefuse API的更多相关文章
- 漫谈可视化Prefuse(五)---一款属于我自己的可视化工具
伴随着前期的基础积累,翻过API,读过一些Demo,总觉得自己已经摸透了Prefuse,小打小闹似乎已经无法满足内心膨胀的自己.还记得儿时看的<武状元苏乞儿>中降龙十八掌最后一张居然是空白 ...
- 漫谈可视化Prefuse(五)
伴随着前期的基础积累,翻过API,读过一些Demo,总觉得自己已经摸透了Prefuse,小打小闹似乎已经无法满足内心膨胀的自己.还记得儿时看的<武状元苏乞儿>中降龙十八掌最后一张居然是空白 ...
- 漫谈可视化Prefuse(二)---一分钟学会Prefuse
前篇<漫谈可视化Prefuse(一)---从SQL Server数据库读取数据>主要介绍了prefuse如何连接数据库sql server并读取数据进行可视化展现. 回头想想还是应该好好捋 ...
- 漫谈可视化Prefuse(六)---改动源码定制边粗细
可视化一路走来,体会很多:博客一路写来,收获颇丰:代码一路码来,思路越来越清晰.终究还是明白了一句古话:纸上得来终觉浅,绝知此事要躬行. 跌跌撞撞整合了个可视化小tool,零零碎碎结交了众多的志同道合 ...
- 漫谈可视化Prefuse(三)---Prefuse API数据结构阅读有感
前篇回顾:上篇<漫谈可视化Prefuse(二)---一分钟学会Prefuse>主要通过一个Prefuse的具体实例了解了构建一个Prefuse application的具体步骤.一个Pre ...
- 漫谈可视化Prefuse(六)
可视化一路走来,体会很多:博客一路写来,收获颇丰:代码一路码来,思路越来越清晰.终究还是明白了一句古话:纸上得来终觉浅,绝知此事要躬行. 跌跌撞撞整合了个可视化小tool,零零碎碎结交了众多的志同道合 ...
- JS魔法堂:被玩坏的innerHTML、innerText、textContent和value属性
一.前言 由于innerText并非W3C标准属性,因此我们无法在FireFox中使用它(修正:FF45+已经支持innerText属性),一般情况下我们可以使用textContent来代替,但它两者 ...
- 【读后感】读《漫谈“大学生的四个learn”》之后有感
在看完<许纪霖教授在上海财经大学演讲——漫谈“大学生的四个Learn”>(下问简称<四l>)之后突然有点话想说.其实我对这篇文章有感的,所以想写这篇文章来说说看,我对四个lea ...
- [转]被玩坏的innerHTML、innerText、textContent和value属性
一.前言 由于innerText并非W3C标准属性,因此我们无法在FireFox中使用它,一般情况下我们可以使用textContent来代替,但它两者是否就能完全等同呢?在坑爹的表单元素(如input ...
随机推荐
- day10---multiprocess 多进程
multiprocess Queue \ Pipe 只是实现进程间数据的传递 Manager 实现了进程间数据的共享,即多个进程可以修改同一份数据 进程模块 multiprocessing #! ...
- 【整理】--【字符设备】分配设备号register_chrdev_region()、alloc_chrdev_region() 和 register_chrdev()
(1) 分配设备编号,注册设备与注销设备的函数均在fs.h中声明,如下: extern int register_chrdev_region(dev_t,unsigned int,const char ...
- bzoj 3718
题意:戳这里 思路:很容易发现对于一个车能否移动到最终的位置只要判断路径中得最大高度与自身高端之和是否>w即可. 那么就可以转化为逆序对得最大数问题..即对于每一辆车,判断有那些最初在他前面,而 ...
- poj 1195 - Mobile phones(树状数组)
二维的树状数组,,, 记得矩阵的求和运算要想好在写.... 代码如下: #include <cstdio> #include <cstdlib> #include <cm ...
- HTML5-块元素标签的使用
<!DOCTYPE html> <html> <head lang="en"> <meta charset="UTF-8&quo ...
- JAVA学习博客---2015-6
JAVA核心技术卷一第一遍看得差不多了,应该是五月初开始看的,用了两个月的中午时间看完的,一共七百多页,接下来还是需要再看一遍,不懂的还是有很多. JAVA和C++一样是面向对象OOP的语言,不同于命 ...
- LoadRunner参数化取值及连接数据库操作步骤
很多情况下,参数添加的数据不是十条二十条,也不是一百两百,对于这种大数量的数据我们可以通过数据库将数据导入: 选中要参数化的内容如下图一所示: 方法一,右键---[Replace with a new ...
- android权限permission大全
1.Android.permission.WRITE_USER_DICTIONARY允许应用程序向用户词典中写入新词 2.android.permission.WRITE_SYNC_SETTINGS写 ...
- WebApi Post提交报错 调试无法进入对应action函数
调试发现有长内容或者是特殊字符就报错,确定是服务端验证的问题 需要 在配置文件 <system.web> 中添加<httpRuntime requestValidationMode ...
- nodejs安装/运行脚本
本文主要介绍nodejs在windows下安装及运行脚本. 安装nodejs 先从nodejs官网:http://nodejs.org/下载对应的系统的安装包,比如用于64位系统的最新0.10.21的 ...