Prometheus Grafana快速搭建
Prometheus
Prometheus和Grafana组合基本上是监控系统的标配。Prometheus做存储后端,Grafana做分析及可视化界面。

普罗米修斯是开源的系统监控/报警工具库,功能非常全,且拥有活跃的开发者和用户社区。Prometheus通过HTTP定期主动拉取(Pull)的方式获得指标(直接获取或通过gateway推送),在本地存储所有抓取的样本,并对这些数据运行规则,从现有数据聚合和记录新的时间序列,或生成警报。
Prometheus原生的可视化界面做得比较原始(主要用于调试),所以社区(官方推荐)使用Grafana来做数据展示。
Grafana专注于数据展示,有着丰富用成熟的展示方式和插件,数据源支持Elasticsearch, Prometheus, Graphite, InfluxDB等等。可以让你通过界面点击(无需写前端代码)快速搭建一个非常专业漂亮的展示界面。即便对于前端零基础的开发者也非常友好!
安装Prometheus
在官网下载需要的版本(
uname -rv查看linux内核版本及发行号)。比如x86的就下载linux-386系列。Prometheus会主动通过HTTP请求来收集受监控目标的指标。 比如它也通过HTTP Rest API导出了自己的健康状态数据,所以也可以用来监控自己。解压下载源文件内包含一个基本的
prometheus.yml配置可以参照。配置非常简单。global: # 全局配置
scrape_interval: 15s #主动拉取指标的间隔
evaluation_interval: 15s #计算间隔 scrape_configs: #监控的目标配置
- job_name: prometheus #名称
static_configs: # 静态配置
- targets: ['127.0.0.1:9090'] #监控目标暴露的HTTP API端口,是个列表
- 把里面的localhost改成你对应机器的IP。
- 其它详细的配置可见配置文档。
前台启动Prometheus,如果是在生产环境,需要后台启动时,最好自行配置Systemd。
# Start Prometheus.

# By default, Prometheus stores its database in ./data (flag --storage.tsdb.path).

./prometheus --config.file=prometheus.yml
用浏览器打开http://IP:9090/metrics查询所有指标列表。
用浏览器打开http://IP:9090/graph,原生的简易的展示界面(太简陋了,基本没人会用)。
PS:因为Promethues自己导出的指标和展示界面都是同一个9090端口。但实践中metrics接口指向的是目标机器的指标列表,用于Promethues主动拉取。
丰富的Exporter可以下载使用,开箱即用。下面可以用NodeExporter来做个范例。
安装NodeExporter
NodeExporter暴露很多和硬件/软件相关的指标(metrics)。
- 直接下载对应的版本。
- 解压NodeExporter。
$ tar xvfz node_exporter-*

$ cd node_exporter-*
启动NodeExporter。
$ ./node_exporter

INFO[0000] Starting node_exporter (version=0.18.1, branch=HEAD, revision=3db77732e925c08f675d7404a8c46466b2ece83e)  source="node_exporter.go:156"

INFO[0000] Build context (go=go1.12.5, user=root@b50852a1acba, date=20190604-16:41:43)  source="node_exporter.go:157"

INFO[0000] Enabled collectors:   source="node_exporter.go:97"

INFO[0000]  - arp                source="node_exporter.go:104"

...

INFO[0000] Listening on :9100    source="node_exporter.go:170"
可以使用
./node_exporter -h查看具体的启动参数。从上面可以看它使用的端口是9100,所有的指标列表都可以和上面示例中的prometheus的接口一样:$ curl http://localhost:9100/metrics
# HELP go_gc_duration_seconds A summary of the GC invocation durations.
# TYPE go_gc_duration_seconds summary
go_gc_duration_seconds{quantile="0"} 2.8138e-05
go_gc_duration_seconds{quantile="0.25"} 4.1588e-05
go_gc_duration_seconds{quantile="0.5"} 0.000102923
go_gc_duration_seconds{quantile="0.75"} 0.000162106
go_gc_duration_seconds{quantile="1"} 0.000495923
go_gc_duration_seconds_sum 0.060153937
go_gc_duration_seconds_count 537
# HELP go_goroutines Number of goroutines that currently exist.
...
可以看到所有关于node_exporter的指标列表。接下来就是把让prometheus来取这些指标。
配置prometheus拉node exporter的指标。即把targets增加9100端口。
scrape_configs:

- job_name: 'node'

  static_configs:

  - targets: ['127.0.0.1:9100']
重启prometheus。
./prometheus --config.file=./prometheus.yml
再次查看浏览器打开graph查看:http://127.0.0.1:9090/graph。勾选
Enable query history后直接输入以node就可以看到大量关于node为前缀的指标了。比如:node_filesystem_avail_bytes查看文件系统可用空间大小情况。
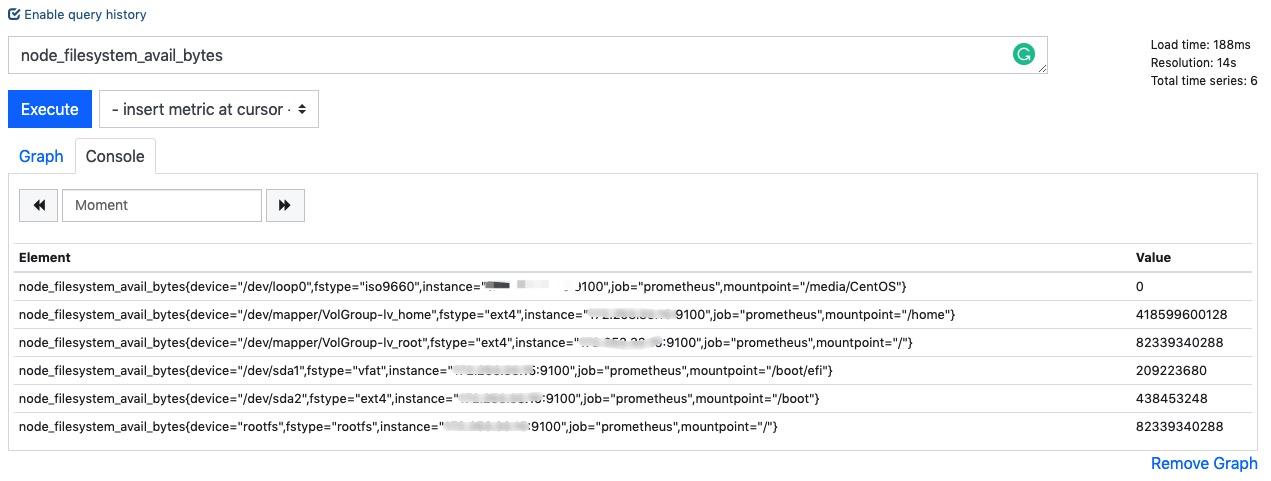
这个界面还是太原始了,但可以用来体验一下PromQL。接下来演示一下接入grafana来展示这些数据。
安装Grafana
按官方指引下载安装:比如Centos安装是
$ wget https://dl.grafana.com/oss/release/grafana-6.3.3-1.x86_64.rpm

$ sudo yum localinstall grafana-6.3.3-1.x86_64.rpm
配置grafana
你可以在/etc/grafana/grafana.ini中配置端口及其它的,具体所有的配置项在: https://grafana.com/docs/installation/configuration/,我们这里都保持默认值,端口默认为3000.用户名/密码默认为admin。
你可以在这里找到对应的启动方式,比如在CentOS上就是
sudo service grafana-server start
启动成功后,你可以使用浏览器打开http://IP:3000使用admin/admin登录。
创建界面
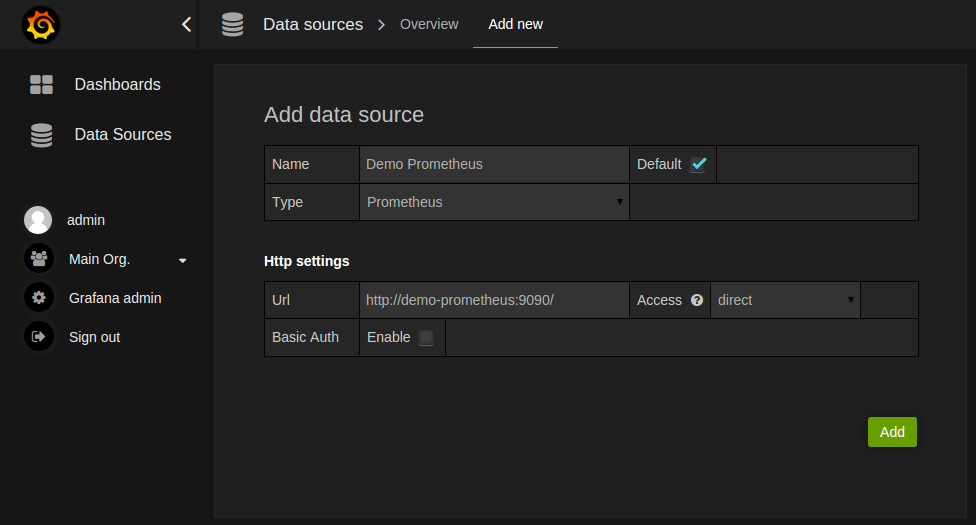
Prometheus的数据源(data source)
- 点击侧边栏中的Grafana图标 -> DataSources -> Add New
- 选择Prometheus类型.
- 设置Prometheus的对外URL(比如 http://IP:9090).
- 点击Add添加
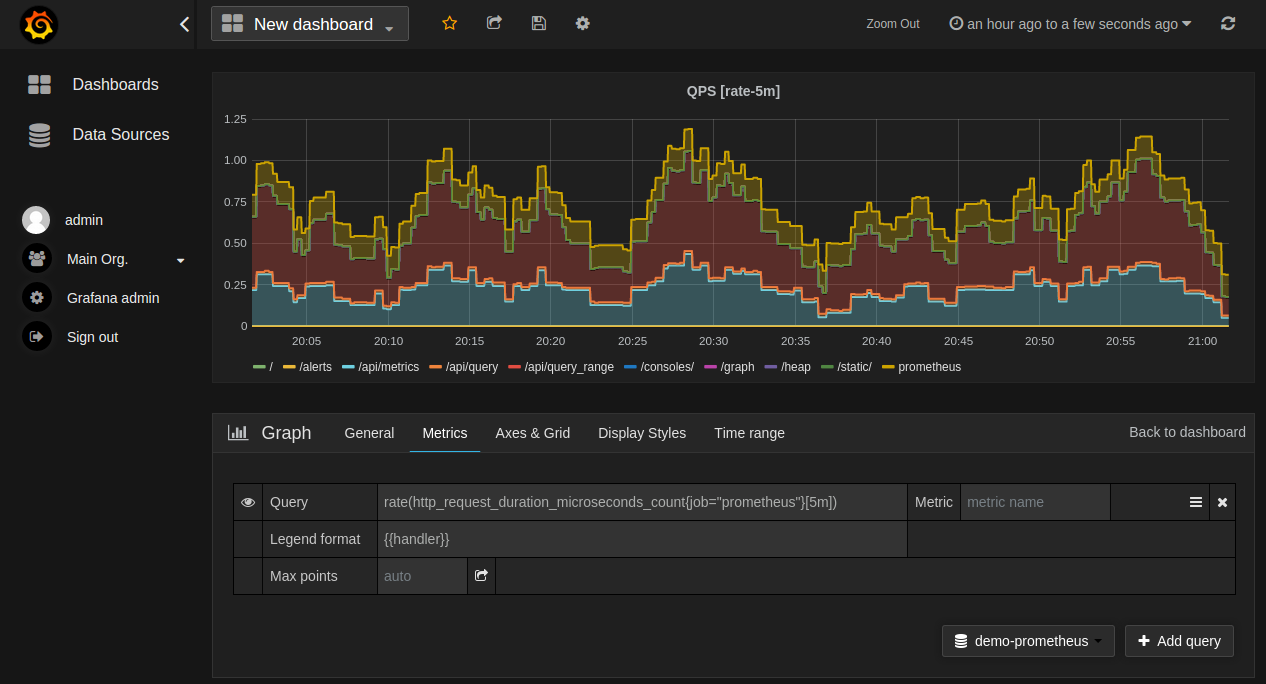
Prometheus图表展示
- 点击graph标题 --> Edits.
- 在Metrics标签下选择你上一步刚增加的Prometheus数据库。
- 在Query字段中输入Prometheus表达式,会自动补全。
- 自定义图表横坐标中指标的名称: Legend format。
导入Dashboards
Grafana.com上有很多别人分享的优化的dashboards,我们可以直接从上面找到node exporter对应的dashboard来使用。下载对应的json文件,然后导入。
其它
在Grafana上如何为选择合适的图表来展示Prometheus对应的数据类型(单调递增的Counter,可降可升的Gauge,用于柱状图展示的Histogram),提供滑动窗口求和的Summary。
Reference
Prometheus Grafana快速搭建的更多相关文章
- Telegraf+InfluxDB+Grafana快速搭建实时监控系统 监控postgresql
Telegraf+InfluxDB+Grafana快速搭建实时监控系统 监控postgresql
- 通过 Telegraf + InfluxDB + Grafana 快速搭建监控体系的详细步骤
第一部分 Telegraf 部署和配置 Telegraf 是实现 数据采集 的工具.Telegraf 具有内存占用小的特点,通过插件系统开发人员可轻松添加支持其他服务的扩展. 在平台监控系统中,可以使 ...
- Prometheus+Grafana安装搭建
介绍 Prometheus是由SoundCloud开发的开源监控报警系统和时序列数据库(TSDB).Prometheus使用Go语言开发,是Google BorgMon监控系统的开源版本. 2016年 ...
- Prometheus+Grafana+Altermanager搭建监控系统
基本概念 Prometheus 时间序列化数据库,我的理解就是将数据打上标签,以时间维度存储.后面有机会在深入研究. Prometheus架构如下: Grafana Prometheus中存储的数据, ...
- Prometheus+Grafana+Alertmanager搭建全方位的监控告警系统
prometheus安装和配置 prometheus组件介绍 1.Prometheus Server: 用于收集和存储时间序列数据. 2.Client Library: 客户端库,检测应用程序代码,当 ...
- Prometheus+Grafana监控-基于docker-compose搭建
前言 Prometheus Prometheus 是有 SoundCloud 开发的开源监控系统和时序数据库,基于 Go 语言开发.通过基于 HTTP 的 pull 方式采集时序数据,通过服务发现或静 ...
- Prometheus+Grafana+kafka_exporter监控kafka
Prometheus+Grafana+kafka_exporter搭建监控系统监控kafka 一.Prometheus+Grafana+kafka_exporter搭建监控系统监控kafka 1.1K ...
- SpringCloud微服务实战——搭建企业级开发框架(四十五):【微服务监控告警实现方式二】使用Actuator(Micrometer)+Prometheus+Grafana实现完整的微服务监控
无论是使用SpringBootAdmin还是使用Prometheus+Grafana都离不开SpringBoot提供的核心组件Actuator.提到Actuator,又不得不提Micrometer ...
- Prometheus+Grafana搭建监控系统
之前在业务中遇到服务器负载过高问题,由于没有监控,一直没发现,直到业务方反馈网站打开速度慢,才发现问题.这样显得开发很被动.所以是时候搭建一套监控系统了. 由于是业余时间自己捯饬,所以神马业务层面的监 ...
随机推荐
- Hive脚本中切勿使用/**/注释
Hive脚本中切勿使用/**/注释 Hive脚本的注释目前好像只有 -- ,我之前在做初版数据的时候 使用NotePad++ 习惯性的有时候注释会写成 /**/ ,然后就引发了问题 脚本上传到hue, ...
- 从零开始的vue学习笔记(六)
混入 混入 (mixin) 提供了一种非常灵活的方式,来分发 Vue 组件中的可复用功能.简单解释就是把一个Vue组件中的内容提供给别的组件来用.例子: // 定义一个混入对象 var myMixin ...
- Exceptionless应用--自定义插件
遇到的问题/需求 这里会把一些敏感的参数记录下来,我们需要屏蔽掉,如图 我们希望日志里面有当前登录用户的信息,如图: 处理方法 tip:这里用的是.net非.net core 第一个问题(屏蔽敏感参数 ...
- Python小技巧:打印出来的文本文档中间有空格
问题描述: 在file.txt中存了内容如下 AAAAAA BBBBBB CCCCCC 然后采用python显示,发现显示出来的是这样的 A A A A A A B B B B B B C C C C ...
- 设置UICollectionViewCell圆角和阴影
设置cell圆角: cell.contentView.layer.cornerRadius =2.0f; cell.contentView.layer.borderWidth =1.0f; cell. ...
- SSM(SpringMVC+Spring+MyBatis)三大框架使用Maven快速搭建整合(实现数据库数据到页面进行展示)
本文介绍使用SpringMVC+Spring+MyBatis三大框架使用Maven快速搭建一个demo,实现数据从数据库中查询返回到页面进行展示的过程. 技术选型:SpringMVC+Spring+M ...
- mysqld_safe error: log-error set to '/data/log/mysqld.log', however file don't exists. Create writable for user 'mysql'.The server quit without updating PID file (/data/mysql/mysqld.pid)
[oot@cent65 bin]# service mysqld startStarting MySQL.2019-10-28T15:56:47.786960Z mysqld_safe error: ...
- Centos7 下添加开机自启动服务和脚本
1.添加开机自启服务 #设置jenkins服务为自启动服务 systemctl enable jenkins.service #启动jenkins服务 systemctl start jenkins. ...
- StaticList
到目前为止,我们还无法创建一个顺序存储结构线性表的对象出来,为什么呢?顺序存储空间究竟是什么,顺序存储空间的大小是多少? StaticList设计要点——类模板 使用原生数组作为顺序存储空间 使用模板 ...
- 23.login1(SKCTF)
没有账号?注册一个试一试~ 题目提示用SQL约束攻击,那么什么是SQL约束攻击呢? 约束攻击的原理就是注册用户名为'admin '(有多个空格)的账号,密码'*******'(密码可以自定义,符 ...