九、chart控件的使用(图表数据的展示)
chart属于老插件网上还有新的插件功能也更多)
Chart控件是VS自带的控件,只是比较老了,功能肯定不如现在出来的某些插件强,不过对于简单的显示还是够用;那么现在来看看chart控件的使用方法:
1.ChartAreas属性
ChartAreas属性指绘图区,一个控件可以有多个绘图区,比如我要在同一个控件内显示饼图和柱状图,肯定不能放在同一个ChartAreas区域内,应该在同一个Chart控件里增加两个ChartAreas并分别绑定Series对象。所以ChartAreas属性对应的是一个集合。
2.Series属性
Series属性就是各种图表的图形啦,比如我们要显示某月的天气变化,那么应该有这样两组数据,一组是天数,一组是每天对应的温度值,同时绑定到Series对象中,再将Series对象Add()到Chart控件的Series属性里即可。为了横向比较,例如我要看本月与上月的天气曲线变化图,并同时显示在同一个ChartAreas中,那该怎么办呢?很简单,再实例一个Series对象,将上月的天数数组与温度值数组绑定到一个新的Series2实例中,再将Series2实例Add()到Chart控件的Series属性里,此时,Chart控件的第一个绘图区ChartArea里就会有两条曲线。
3.Legends属性
Legend就是指一个图标的图例,当一个Series属性有多个Series时,或是一个Series有几组数据时,为了区分各自的颜色,通常每个Serie对象一种颜色,这就需要用到图例来指明哪个颜色的代表的是什么数据。如下图所示:
4.关于数据的绑定
将要显示的X轴和Y轴的数据分别放到两个数组里在, 然后绑定即可。
cht1.Series[0].Points.DataBindXY(x, y);
完整的代码如下:
using System;
using System.Collections.Generic;
using System.Linq;
using System.Web;
using System.Web.UI;
using System.Web.UI.WebControls;
using System.Drawing;
using System.Web.UI.DataVisualization.Charting;
public partial class _Default : System.Web.UI.Page
{
protected void Page_Load(object sender, EventArgs e)
{
string[] x = new string[] { "南山大队", "福田大队", "罗湖大队", "宝安大队", "指挥处", "大帝科技", "南山大队", "福田大队", "罗湖大队", "宝安大队", "指挥处", "大帝科技"};
double[] y = new double[] { , , , , , , , , , , , };
string[] z = new string[] { "", "", "", "", "", "", "", "", "", "", "", "" };
string[] a = new string[] { "南山大队", "福田大队", "罗湖大队", "宝安大队", "指挥处", };
double[] b = new double[] { , , , , };
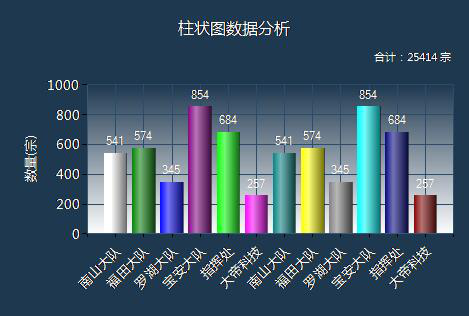
#region 柱状图
//标题
cht1.Titles.Add("柱状图数据分析");
cht1.Titles[].ForeColor = Color.White;
cht1.Titles[].Font = new Font("微软雅黑", 12f, FontStyle.Regular);
cht1.Titles[].Alignment = ContentAlignment.TopCenter;
cht1.Titles.Add("合计:25414 宗");
cht1.Titles[].ForeColor = Color.White;
cht1.Titles[].Font = new Font("微软雅黑", 8f, FontStyle.Regular);
cht1.Titles[].Alignment = ContentAlignment.TopRight;
//控件背景
cht1.BackColor = Color.Transparent;
//图表区背景
cht1.ChartAreas[].BackColor = Color.Transparent;
cht1.ChartAreas[].BorderColor = Color.Transparent;
//X轴标签间距
cht1.ChartAreas[].AxisX.Interval = ;
cht1.ChartAreas[].AxisX.LabelStyle.IsStaggered = true;
cht1.ChartAreas[].AxisX.LabelStyle.Angle = -;
cht1.ChartAreas[].AxisX.TitleFont = new Font("微软雅黑", 14f, FontStyle.Regular);
cht1.ChartAreas[].AxisX.TitleForeColor = Color.White;
//X坐标轴颜色
cht1.ChartAreas[].AxisX.LineColor = ColorTranslator.FromHtml("#38587a"); ;
cht1.ChartAreas[].AxisX.LabelStyle.ForeColor = Color.White;
cht1.ChartAreas[].AxisX.LabelStyle.Font = new Font("微软雅黑", 10f, FontStyle.Regular);
//X坐标轴标题
//cht1.ChartAreas[0].AxisX.Title = "数量(宗)";
//cht1.ChartAreas[0].AxisX.TitleFont = new Font("微软雅黑", 10f, FontStyle.Regular);
//cht1.ChartAreas[0].AxisX.TitleForeColor = Color.White;
//cht1.ChartAreas[0].AxisX.TextOrientation = TextOrientation.Horizontal;
//cht1.ChartAreas[0].AxisX.ToolTip = "数量(宗)";
//X轴网络线条
cht1.ChartAreas[].AxisX.MajorGrid.Enabled = true;
cht1.ChartAreas[].AxisX.MajorGrid.LineColor = ColorTranslator.FromHtml("#2c4c6d");
//Y坐标轴颜色
cht1.ChartAreas[].AxisY.LineColor = ColorTranslator.FromHtml("#38587a");
cht1.ChartAreas[].AxisY.LabelStyle.ForeColor = Color.White;
cht1.ChartAreas[].AxisY.LabelStyle.Font = new Font("微软雅黑", 10f, FontStyle.Regular);
//Y坐标轴标题
cht1.ChartAreas[].AxisY.Title = "数量(宗)";
cht1.ChartAreas[].AxisY.TitleFont = new Font("微软雅黑", 10f, FontStyle.Regular);
cht1.ChartAreas[].AxisY.TitleForeColor = Color.White;
cht1.ChartAreas[].AxisY.TextOrientation = TextOrientation.Rotated270;
cht1.ChartAreas[].AxisY.ToolTip = "数量(宗)";
//Y轴网格线条
cht1.ChartAreas[].AxisY.MajorGrid.Enabled = true;
cht1.ChartAreas[].AxisY.MajorGrid.LineColor = ColorTranslator.FromHtml("#2c4c6d");
cht1.ChartAreas[].AxisY2.LineColor = Color.Transparent;
cht1.ChartAreas[].BackGradientStyle = GradientStyle.TopBottom;
Legend legend = new Legend("legend");
legend.Title = "legendTitle";
cht1.Series[].XValueType = ChartValueType.String; //设置X轴上的值类型
cht1.Series[].Label = "#VAL"; //设置显示X Y的值
cht1.Series[].LabelForeColor = Color.White;
cht1.Series[].ToolTip = "#VALX:#VAL"; //鼠标移动到对应点显示数值
cht1.Series[].ChartType = SeriesChartType.Column; //图类型(折线)
cht1.Series[].Color = Color.Lime;
cht1.Series[].LegendText = legend.Name;
cht1.Series[].IsValueShownAsLabel = true;
cht1.Series[].LabelForeColor = Color.White;
cht1.Series[].CustomProperties = "DrawingStyle = Cylinder";
cht1.Legends.Add(legend);
cht1.Legends[].Position.Auto = false;
//绑定数据
cht1.Series[].Points.DataBindXY(x, y);
cht1.Series[].Points[].Color = Color.White;
cht1.Series[].Palette = ChartColorPalette.Bright;
#endregion
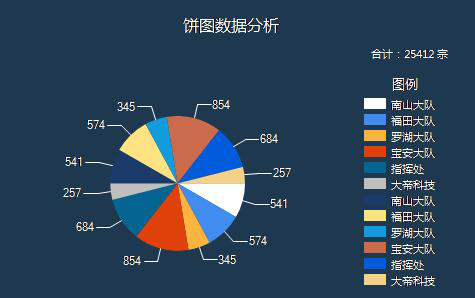
#region 饼图
//标题
cht2.Titles.Add("饼图数据分析");
cht2.Titles[].ForeColor = Color.White;
cht2.Titles[].Font = new Font("微软雅黑", 12f, FontStyle.Regular);
cht2.Titles[].Alignment = ContentAlignment.TopCenter;
cht2.Titles.Add("合计:25412 宗");
cht2.Titles[].ForeColor = Color.White;
cht2.Titles[].Font = new Font("微软雅黑", 8f, FontStyle.Regular);
cht2.Titles[].Alignment = ContentAlignment.TopRight;
//控件背景
cht2.BackColor = Color.Transparent;
//图表区背景
cht2.ChartAreas[].BackColor = Color.Transparent;
cht2.ChartAreas[].BorderColor = Color.Transparent;
//X轴标签间距
cht2.ChartAreas[].AxisX.Interval = ;
cht2.ChartAreas[].AxisX.LabelStyle.IsStaggered = true;
cht2.ChartAreas[].AxisX.LabelStyle.Angle = -;
cht2.ChartAreas[].AxisX.TitleFont = new Font("微软雅黑", 14f, FontStyle.Regular);
cht2.ChartAreas[].AxisX.TitleForeColor = Color.White;
//X坐标轴颜色
cht2.ChartAreas[].AxisX.LineColor = ColorTranslator.FromHtml("#38587a"); ;
cht2.ChartAreas[].AxisX.LabelStyle.ForeColor = Color.White;
cht2.ChartAreas[].AxisX.LabelStyle.Font = new Font("微软雅黑", 10f, FontStyle.Regular);
//X坐标轴标题
cht2.ChartAreas[].AxisX.Title = "数量(宗)";
cht2.ChartAreas[].AxisX.TitleFont = new Font("微软雅黑", 10f, FontStyle.Regular);
cht2.ChartAreas[].AxisX.TitleForeColor = Color.White;
cht2.ChartAreas[].AxisX.TextOrientation = TextOrientation.Horizontal;
cht2.ChartAreas[].AxisX.ToolTip = "数量(宗)";
//X轴网络线条
cht2.ChartAreas[].AxisX.MajorGrid.Enabled = true;
cht2.ChartAreas[].AxisX.MajorGrid.LineColor = ColorTranslator.FromHtml("#2c4c6d");
//Y坐标轴颜色
cht2.ChartAreas[].AxisY.LineColor = ColorTranslator.FromHtml("#38587a");
cht2.ChartAreas[].AxisY.LabelStyle.ForeColor = Color.White;
cht2.ChartAreas[].AxisY.LabelStyle.Font = new Font("微软雅黑", 10f, FontStyle.Regular);
//Y坐标轴标题
cht2.ChartAreas[].AxisY.Title = "数量(宗)";
cht2.ChartAreas[].AxisY.TitleFont = new Font("微软雅黑", 10f, FontStyle.Regular);
cht2.ChartAreas[].AxisY.TitleForeColor = Color.White;
cht2.ChartAreas[].AxisY.TextOrientation = TextOrientation.Rotated270;
cht2.ChartAreas[].AxisY.ToolTip = "数量(宗)";
//Y轴网格线条
cht2.ChartAreas[].AxisY.MajorGrid.Enabled = true;
cht2.ChartAreas[].AxisY.MajorGrid.LineColor = ColorTranslator.FromHtml("#2c4c6d");
cht2.ChartAreas[].AxisY2.LineColor = Color.Transparent;
//背景渐变
cht2.ChartAreas[].BackGradientStyle = GradientStyle.None;
//图例样式
Legend legend2 = new Legend("#VALX");
legend2.Title = "图例";
legend2.TitleBackColor = Color.Transparent;
legend2.BackColor = Color.Transparent;
legend2.TitleForeColor = Color.White;
legend2.TitleFont = new Font("微软雅黑", 10f, FontStyle.Regular);
legend2.Font = new Font("微软雅黑", 8f, FontStyle.Regular);
legend2.ForeColor = Color.White;
cht2.Series[].XValueType = ChartValueType.String; //设置X轴上的值类型
cht2.Series[].Label = "#VAL"; //设置显示X Y的值
cht2.Series[].LabelForeColor = Color.White;
cht2.Series[].ToolTip = "#VALX:#VAL(宗)"; //鼠标移动到对应点显示数值
cht2.Series[].ChartType = SeriesChartType.Pie; //图类型(折线)
cht2.Series[].Color = Color.Lime;
cht2.Series[].LegendText = legend2.Name;
cht2.Series[].IsValueShownAsLabel = true;
cht2.Series[].LabelForeColor = Color.White;
cht2.Series[].CustomProperties = "DrawingStyle = Cylinder";
cht2.Series[].CustomProperties = "PieLabelStyle = Outside";
cht2.Legends.Add(legend2);
cht2.Legends[].Position.Auto = true;
cht2.Series[].IsValueShownAsLabel = true;
//是否显示图例
cht2.Series[].IsVisibleInLegend = true;
cht2.Series[].ShadowOffset = ;
//饼图折线
cht2.Series[]["PieLineColor"] = "White";
//绑定数据
cht2.Series[].Points.DataBindXY(x, y);
cht2.Series[].Points[].Color = Color.White;
//绑定颜色
cht2.Series[].Palette = ChartColorPalette.BrightPastel;
#endregion
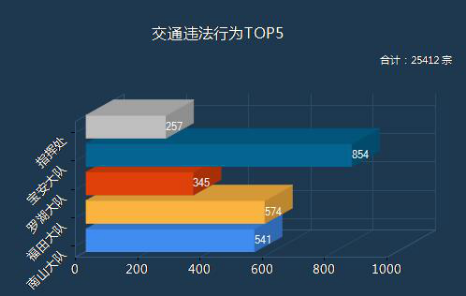
#region Bar图
//标题
cht3.Titles.Add("交通违法行为TOP5");
cht3.Titles[].ForeColor = Color.White;
cht3.Titles[].Font = new Font("微软雅黑", 12f, FontStyle.Regular);
cht3.Titles[].Alignment = ContentAlignment.TopCenter;
cht3.Titles.Add("合计:25412 宗 ");
cht3.Titles[].ForeColor = Color.White;
cht3.Titles[].Font = new Font("微软雅黑", 8f, FontStyle.Regular);
cht3.Titles[].Alignment = ContentAlignment.TopRight;
//控件背景
cht3.BackColor = Color.Transparent;
//图表区背景
cht3.ChartAreas[].BackColor = Color.Transparent;
cht3.ChartAreas[].BorderColor = Color.Transparent;
//X轴标签间距
cht3.ChartAreas[].AxisX.Interval = ;
cht3.ChartAreas[].AxisX.LabelStyle.IsStaggered = true;
cht3.ChartAreas[].AxisX.LabelStyle.Angle = -;
cht3.ChartAreas[].AxisX.TitleFont = new Font("微软雅黑", 14f, FontStyle.Regular);
cht3.ChartAreas[].AxisX.TitleForeColor = Color.White;
//X坐标轴颜色
cht3.ChartAreas[].AxisX.LineColor = ColorTranslator.FromHtml("#38587a"); ;
cht3.ChartAreas[].AxisX.LabelStyle.ForeColor = Color.White;
cht3.ChartAreas[].AxisX.LabelStyle.Font = new Font("微软雅黑", 10f, FontStyle.Regular);
//X坐标轴标题
//cht3.ChartAreas[0].AxisX.Title = "数量(宗)";
//cht3.ChartAreas[0].AxisX.TitleFont = new Font("微软雅黑", 10f, FontStyle.Regular);
//cht3.ChartAreas[0].AxisX.TitleForeColor = Color.White;
//cht3.ChartAreas[0].AxisX.TextOrientation = TextOrientation.Auto;
//cht3.ChartAreas[0].AxisX.ToolTip = "数量(宗)";
//X轴网络线条
cht3.ChartAreas[].AxisX.MajorGrid.Enabled = true;
cht3.ChartAreas[].AxisX.MajorGrid.LineColor = ColorTranslator.FromHtml("#2c4c6d");
//Y坐标轴颜色
cht3.ChartAreas[].AxisY.LineColor = ColorTranslator.FromHtml("#38587a");
cht3.ChartAreas[].AxisY.LabelStyle.ForeColor = Color.White;
cht3.ChartAreas[].AxisY.LabelStyle.Font = new Font("微软雅黑", 10f, FontStyle.Regular);
//Y坐标轴标题
//cht3.ChartAreas[0].AxisY.Title = "数量(宗)";
//cht3.ChartAreas[0].AxisY.TitleFont = new Font("微软雅黑", 10f, FontStyle.Regular);
//cht3.ChartAreas[0].AxisY.TitleForeColor = Color.White;
//cht3.ChartAreas[0].AxisY.TextOrientation = TextOrientation.Auto;
//cht3.ChartAreas[0].AxisY.ToolTip = "数量(宗)";
//Y轴网格线条
cht3.ChartAreas[].AxisY.MajorGrid.Enabled = true;
cht3.ChartAreas[].AxisY.MajorGrid.LineColor = ColorTranslator.FromHtml("#2c4c6d");
cht3.ChartAreas[].AxisY2.LineColor = Color.Transparent;
cht3.ChartAreas[].AxisX.IsMarginVisible = false;
cht3.ChartAreas[].Area3DStyle.Enable3D = true;
//背景渐变
cht2.ChartAreas[].BackGradientStyle = GradientStyle.None;
//图例样式
Legend legend3 = new Legend("#VALX");
legend3.Title = "图例";
legend3.TitleBackColor = Color.Transparent;
legend3.BackColor = Color.Transparent;
legend3.TitleForeColor = Color.White;
legend3.TitleFont = new Font("微软雅黑", 10f, FontStyle.Regular);
legend3.Font = new Font("微软雅黑", 8f, FontStyle.Regular);
legend3.ForeColor = Color.White;
cht3.Series[].XValueType = ChartValueType.String; //设置X轴上的值类型
cht3.Series[].Label = "#VAL"; //设置显示X Y的值
cht3.Series[].LabelForeColor = Color.White;
cht3.Series[].ToolTip = "#VALX:#VAL(宗)"; //鼠标移动到对应点显示数值
cht3.Series[].ChartType = SeriesChartType.Bar; //图类型(折线)
cht3.Series[].Color = Color.Lime;
//cht3.Series[0].LegendText = legend3.Name;
cht3.Series[].IsValueShownAsLabel = true;
cht3.Series[].LabelForeColor = Color.White;
cht3.Series[].CustomProperties = "DrawingStyle = Cylinder";
cht3.Series[].CustomProperties = "PieLabelStyle = Outside";
//cht3.Legends.Add(legend3);
//cht3.Legends[0].Position.Auto = true;
//是否显示图例
cht3.Series[].IsVisibleInLegend = true;
cht3.Series[].ShadowOffset = ;
//饼图折线
cht3.Series[]["PieLineColor"] = "White";
//绑定数据
cht3.Series[].Points.DataBindXY(a, b);
//cht3.Series[0].Points[0].Color = Color.White;
//绑定颜色
cht3.Series[].Palette = ChartColorPalette.BrightPastel;
//for (int n = 0; n < x.Length; n++)
//{
// int ptIdx = cht3.Series[0].Points.AddY(Convert.ToDouble(y[n]));
// DataPoint pt = this.cht3.Series[0].Points[ptIdx];
// pt.LegendText = x[n] + " " + "#PERCENT{P2}" + " [ " + "#VAL{D} 次" + " ]";//右边标签列显示的文字
// pt.Label = x[n] + " " + "#PERCENT{P2}" + " [ " + "#VAL{D} 次" + " ]"; //圆饼外显示的信息
// // pt.LabelToolTip = "#PERCENT{P2}";
// //pt.LabelBorderColor = Color.Red;//文字背景色
//}
#endregion
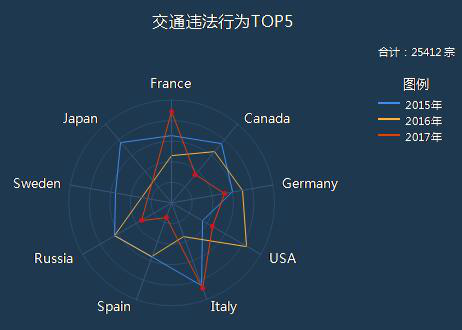
#region 雷达图
// //标题
cht4.Titles.Add("交通违法行为TOP5");
cht4.Titles[].ForeColor = Color.White;
cht4.Titles[].Font = new Font("微软雅黑", 12f, FontStyle.Regular);
cht4.Titles[].Alignment = ContentAlignment.TopCenter;
cht4.Titles.Add("合计:25412 宗 ");
cht4.Titles[].ForeColor = Color.White;
cht4.Titles[].Font = new Font("微软雅黑", 8f, FontStyle.Regular);
cht4.Titles[].Alignment = ContentAlignment.TopRight;
//控件背景
cht4.BackColor = Color.Transparent;
cht4.ChartAreas[].BackColor = Color.Transparent;
cht4.ChartAreas[].BorderColor = Color.Transparent;
//X轴标签间距
cht4.ChartAreas[].AxisX.Interval = ;
cht4.ChartAreas[].AxisX.LabelStyle.IsStaggered = true;
cht4.ChartAreas[].AxisX.LabelStyle.Angle = -;
cht4.ChartAreas[].AxisX.TitleFont = new Font("微软雅黑", 14f, FontStyle.Regular);
cht4.ChartAreas[].AxisX.TitleForeColor = Color.White;
//X坐标轴颜色
cht4.ChartAreas[].AxisX.LineColor = ColorTranslator.FromHtml("#38587a"); ;
cht4.ChartAreas[].AxisX.LabelStyle.ForeColor = Color.White;
cht4.ChartAreas[].AxisX.LabelStyle.Font = new Font("微软雅黑", 10f, FontStyle.Regular);
//X坐标轴标题
//cht4.ChartAreas[0].AxisX.Title = "数量(宗)";
//cht4.ChartAreas[0].AxisX.TitleFont = new Font("微软雅黑", 10f, FontStyle.Regular);
//cht4.ChartAreas[0].AxisX.TitleForeColor = Color.White;
//cht4.ChartAreas[0].AxisX.TextOrientation = TextOrientation.Auto;
//cht4.ChartAreas[0].AxisX.ToolTip = "数量(宗)";
//X轴网络线条
cht4.ChartAreas[].AxisX.MajorGrid.Enabled = true;
cht4.ChartAreas[].AxisX.MajorGrid.LineColor = ColorTranslator.FromHtml("#2c4c6d");
//Y坐标轴颜色
cht4.ChartAreas[].AxisY.LineColor = ColorTranslator.FromHtml("#38587a");
cht4.ChartAreas[].AxisY.LabelStyle.ForeColor = Color.White;
cht4.ChartAreas[].AxisY.LabelStyle.Font = new Font("微软雅黑", 10f, FontStyle.Regular);
//Y坐标轴标题
//cht4.ChartAreas[0].AxisY.Title = "数量(宗)";
//cht4.ChartAreas[0].AxisY.TitleFont = new Font("微软雅黑", 10f, FontStyle.Regular);
//cht4.ChartAreas[0].AxisY.TitleForeColor = Color.White;
//cht4.ChartAreas[0].AxisY.TextOrientation = TextOrientation.Auto;
//cht4.ChartAreas[0].AxisY.ToolTip = "数量(宗)";
//Y轴网格线条
cht4.ChartAreas[].AxisY.MajorGrid.Enabled = true;
cht4.ChartAreas[].AxisY.MajorGrid.LineColor = ColorTranslator.FromHtml("#2c4c6d");
cht4.ChartAreas[].AxisY2.LineColor = Color.Transparent;
cht4.ChartAreas[].AxisX.IsMarginVisible = false;
cht4.ChartAreas[].Area3DStyle.Enable3D = true;
cht4.ChartAreas[].AxisX.IsInterlaced = false;
cht4.ChartAreas[].AxisX.IsMarginVisible = false;
//刻度线
cht4.ChartAreas[].AxisY.MajorTickMark.Enabled = false;
//cht4.ChartAreas[0].AxisX.MajorGrid.Enabled = false;
//cht4.ChartAreas[0].AxisY.MajorGrid.Enabled = false;
//cht4.ChartAreas[0].AxisX.MajorTickMark.Enabled = false;
cht4.ChartAreas[].AxisY.LabelStyle.Enabled = false;
//背景渐变
cht4.ChartAreas[].BackGradientStyle = GradientStyle.None;
//cht4.ChartAreas[0].AxisX2.InterlacedColor = Color.Red;
//cht4.ChartAreas[0].AxisY2.InterlacedColor = Color.Red;
//cht4.ChartAreas[0].BorderWidth = 0;
//cht4.ChartAreas[0].BackSecondaryColor = Color.Red;
//cht4.ChartAreas[0].BackImageTransparentColor = Color.Red;
//cht4.ChartAreas[0].AxisX.InterlacedColor = Color.Red;
//cht4.ChartAreas[0].AxisX.LineColor = Color.Red;
//cht4.ChartAreas[0].AxisX2.LineColor = Color.Red;
//cht4.ChartAreas[0].AxisX2.MajorGrid.LineColor = Color.Red;
//cht4.ChartAreas[0].AxisX2.MajorTickMark.LineColor = Color.Red;
//cht4.ChartAreas[0].AxisX2.MinorTickMark.LineColor = Color.Red;
//cht4.ChartAreas[0].AxisY.InterlacedColor = Color.Red;
//cht4.ChartAreas[0].AxisY.LineColor = Color.Red;
//cht4.ChartAreas[0].AxisY2.InterlacedColor = Color.Red;
//cht4.ChartAreas[0].AxisY2.LineColor = Color.Red;
//cht4.ChartAreas[0].AxisY2.MajorGrid.LineColor = Color.Red;
//cht4.ChartAreas[0].AxisY2.MajorTickMark.LineColor = Color.Red;
//cht4.ChartAreas[0].AxisY2.MinorTickMark.LineColor = Color.Red;
//图例样式
Legend legend4 = new Legend();
legend4.Title = "图例";
legend4.TitleBackColor = Color.Transparent;
legend4.BackColor = Color.Transparent;
legend4.TitleForeColor = Color.White;
legend4.TitleFont = new Font("微软雅黑", 10f, FontStyle.Regular);
legend4.Font = new Font("微软雅黑", 8f, FontStyle.Regular);
legend4.ForeColor = Color.White;
cht4.Legends.Add(legend4);
cht4.Legends[].Position.Auto = true;
//Series1
cht4.Series[].XValueType = ChartValueType.String;
cht4.Series[].Label = "#VAL";
cht4.Series[].LabelForeColor = Color.White;
cht4.Series[].ToolTip = "#LEGENDTEXT:#VAL(宗)";
cht4.Series[].ChartType = SeriesChartType.Radar;
cht4.Series[]["RadarDrawingStyle"] = "Line";
cht4.Series[].LegendText = "2015年";
cht4.Series[].IsValueShownAsLabel = true;
//Series2
cht4.Series.Add(new Series("Series2"));
cht4.Series[].Label = "#VAL";
cht4.Series[].LabelForeColor = Color.White;
cht4.Series[].ToolTip = "#LEGENDTEXT:#VAL(宗)";
cht4.Series[].ChartType = SeriesChartType.Radar;
cht4.Series[]["RadarDrawingStyle"] = "Line";
cht4.Series[].LegendText = "2016年";
cht4.Series[].IsValueShownAsLabel = true;
//Series3
cht4.Series.Add(new Series("Series3"));
cht4.Series[].Label = "#VAL";
cht4.Series[].LabelForeColor = Color.White;
cht4.Series[].ToolTip = "#LEGENDTEXT:#VAL(宗)";
cht4.Series[].ChartType = SeriesChartType.Radar;
cht4.Series[]["RadarDrawingStyle"] = "Line";
cht4.Series[].LegendText = "2017年";
cht4.Series[].IsValueShownAsLabel = true;
double[] yValues = { 65.62, 75.54, 60.45, 34.73, 85.42, 55.9, 63.6, 55.2, 77.1 };
string[] xValues = { "France", "Canada", "Germany", "USA", "Italy", "Spain", "Russia", "Sweden", "Japan" };
//Seris2
double[] y2 = { 45.62, 65.54, 70.45, 84.73, 35.42, 55.9, 63.6 };
double[] y3 = { 88.62, 35.54, 52.45, 45.73, 88.42, 14.9, 33.6 };
this.cht4.Series[].Points.DataBindXY(xValues, yValues);
this.cht4.Series[].Points.DataBindY(y2);
this.cht4.Series[].Points.DataBindY(y3);
//设置X轴显示间隔为1,X轴数据比较多的时候比较有用
cht4.ChartAreas[].AxisX.LabelStyle.Interval = ;
//设置XY轴标题的名称所在位置位远
cht4.ChartAreas[].AxisX.TitleAlignment = StringAlignment.Near;
for (int i = ; i < cht4.Series[].Points.Count; i++)
{
cht4.Series[].Points[i].MarkerStyle = MarkerStyle.Circle;//设置折点的风格
cht4.Series[].Points[i].MarkerColor = Color.Red;//设置seires中折点的颜色
// cht4.Series[1].Points[i].MarkerStyle = MarkerStyle.Square;//设置折点的风格
// cht4.Series[1].Points[i].MarkerColor = Color.Blue;//设置seires中折点的颜色
// cht4.Series[2].Points[i].MarkerStyle = MarkerStyle.Square;//设置折点的风格
// cht4.Series[2].Points[i].MarkerColor = Color.Green;//设置seires中折点的颜色 }
for (int i = ; i < cht4.Series.Count; i++)
{
for (int j = ; j < cht4.Series[i].Points.Count; j++)
{
cht4.Series[i].Points[j].Label = " ";
//cht4.Series[i].Points[j].LabelToolTip = "string.Empty"; }
}
//cht4.ImageType = ChartImageType.Jpeg;
//反锯齿
cht4.AntiAliasing = AntiAliasingStyles.All;
//调色板 磨沙:SemiTransparent
cht4.Palette = ChartColorPalette.BrightPastel;
cht4.Series[].ChartType = SeriesChartType.Radar;
cht4.Series[].ChartType = SeriesChartType.Radar;
cht4.Series[].ChartType = SeriesChartType.Radar;
cht4.Width = ;
cht4.Height = ;
#endregion
/*
#VALX 显示当前图例的X轴的对应文本(或数据)
#VAL, #VALY, 显示当前图例的Y轴的对应文本(或数据)
#VALY2, #VALY3, 显示当前图例的辅助Y轴的对应文本(或数据)
#SER: 显示当前图例的名称
#LABEL 显示当前图例的标签文本
#INDEX 显示当前图例的索引
#PERCENT 显示当前图例的所占的百分比
#TOTAL 总数量
#LEGENDTEXT 图例文本
*/
}
}
九、chart控件的使用(图表数据的展示)的更多相关文章
- 用Chart控件绘制动态图表
进行程序设计时,选用一个合适的ActiveX控件,有时可大大减少编程工作量.ActiveX 控件(又称OCX)基于COM技术,作为独立的软件模块,它可以在任何程序设计语言中插入使用.本文仅以VC++为 ...
- C# Chart控件教程
一.什么是Micosoft.Chart.Controls Micosoft.Chart.Controls是微软自带的一个图形可视化的组件,可以在Web程序和窗体程序中(Windowsform)中使用. ...
- ASP.NET中的chart控件绑定SQL Server数据库
网上很多的chart控件的实例都没有绑定数据库,经过一番摸索后,终于实现了chart控件绑定数据库. 首先,在Visual Studio中建立一个网站,新建一个WebForm项目,名称为ChartTe ...
- C# Chart控件,chart、Series、ChartArea曲线图绘制的重要属性
http://blog.sina.com.cn/s/blog_621e24e20101cp64.html 为避免耽误不喜欢这种曲线图效果的亲们的时间,先看一下小DEMO效果图: 先简单说一下,从图中可 ...
- javascript曲线图和面积图Line & Area chart控件功能及下载
Line & Area chart 控件是一款新型的.可用性极强的曲线图和面积图产品.一个您网站的访问者可以放大他感兴趣的一段区域,打开和关闭数值气球,并可显示和隐藏图表.您能创建简单.堆积. ...
- 使用WinForm Chart控件 制作饼装,柱状,折线图
http://blog.csdn.net/dream2050csdn/article/details/53510340 chart控件的属性很多,主要用到Chart控件图表区域的属性有五个属性 1.A ...
- VS2010 Chart控件(一)Chart控件在ASP.NET网站中的应用示例详解(C#语言)
步骤如下: 1. Chart控件(一)Chart控件在ASP.NET网站中的应用示例详解(C#语言)" title="VS2010 Chart控件(一)Chart控件在ASP.NE ...
- Chart控件,chart、Series、ChartArea曲线图绘制的重要属性介绍
先简单说一下,从图中可以看到一个chart可以绘制多个ChartArea,每个ChartArea都可以绘制多条Series.ChartArea就是就是绘图区域,可以有多个ChartArea叠加在一起, ...
- C# chart控件基础使用
基本介绍:chart(图表) 功能:主要用来绘制折线图,柱状图与饼状图,也可达到动态效果(例如作示波器): 需要说明 一个chart可以包含多个chartArea. chartArea是具体的坐标区域 ...
随机推荐
- Homebrew 1.0.0 发布,MacOS 上的包管理器,比如安装qt5keychain
神器,没有它不知道怎么用macos https://www.oschina.net/news/77367/homebrew-1-0-0 Mac OS X用户,qt5keychain可以使用homebr ...
- QTableView中加入Check列实现,无需Delegate(使用::data(),Qt原生支持)
通过Delegate创建QCheckBox来实现的Check列,只有在该列进入编辑模式时才能够Check/Uncheck.这显然不是我们想要的,网上翻来翻去,在一个国外论坛中看到了无需Delegate ...
- Codility---Brackets
Task description A string S consisting of N characters is considered to be properly nestedif any of ...
- 似乎是VS2017的一个BUG
VS版本:2017(15.9.13) 新建一个c#控制台项目,把Program.cs的内容替换成如下: namespace ConsoleApp1 { class Program { static v ...
- Java基础(三) String深度解析
String可以说是Java中使用最多最频繁.最特殊的类,因为同时也是字面常量,而字面常量包括基本类型.String类型.空类型. 一. String的使用 1. String的不可变性 /** * ...
- SpringBoot实现文件上传
前言参考:快速开发第一个SpringBoot应用 这篇文章会讲解如何使用SpringBoot完成一个文件上传的过程,并且附带一些SpringBoot开发中需要注意的地方 首先我们写一个文件上传的htm ...
- WebGL场景的两种地面构造方法
总述:大部分3D编程都涉及到地面元素,在场景中我们使用地面作为其他物体的承载基础,同时也用地面限制场景使用者的移动范围,还可以在通过设置地块的属性为场景的不同位置设置对应的计算规则.本文在WebGL平 ...
- 使用jinja2模板引擎生成html文件
使用jinja2模板引擎生成html文件 jinja2是纯Python的模板引擎,是仿照Django模板的Python模板语言. 它速度快,被广泛使用,提供了可选的沙箱模板执行环境保证安全. 使用pi ...
- 使用docker启动mysql
安装docker 查询mysql版本, docker search mysql 拉取指定版本的镜像 docker pull NAME 启动镜像, 第一次启动最少需要指定MYSQL_ROOT_PASSW ...
- Python批量自动裁剪图片
"""用Pythonp批量裁剪图片""" from PIL import Image import matplotlib.pyplot as ...