快速上手pandas(上)
pandas is a fast, powerful, flexible and easy to use open source data analysis and manipulation tool, built on top of the Python programming language.
pandas是一个灵活而强大的数据处理与数据分析工具集。它高度封装了NumPy(高性能的N维数组运算库)、Matplotlib(可视化工具)、文件读写等等,广泛应用于数据清洗、数据分析、数据挖掘等场景。
对NumPy完全不了解的朋友,建议翻阅前文:
# 这里先导入下面会频繁使用到的模块

import numpy as np

import pandas as pd

import matplotlib.pyplot as plt

# 或者pd.show_versions()

pd.__version__
'1.1.3'
刚接触Python的朋友可能不知道help()命令能随时查看帮助文档, 这里顺便提一下:
# help(np.random)

# help(pd)

# help(plt)

# help(pd.DataFrame)

# help参数也可以传入 实例对象的方法

# df = pd.DataFrame(np.random.randint(50, 100, (6, 5)))

# help(df.to_csv)
pandas数据结构
pandas中有三种数据结构,分别为:Series(一维数据结构)、DataFrame(二维表格型数据结构)和MultiIndex(三维数据结构)。
Series
Series is a one-dimensional labeled array capable of holding any data type (integers, strings, floating point numbers, Python objects, etc.). The axis labels are collectively referred to as the index.
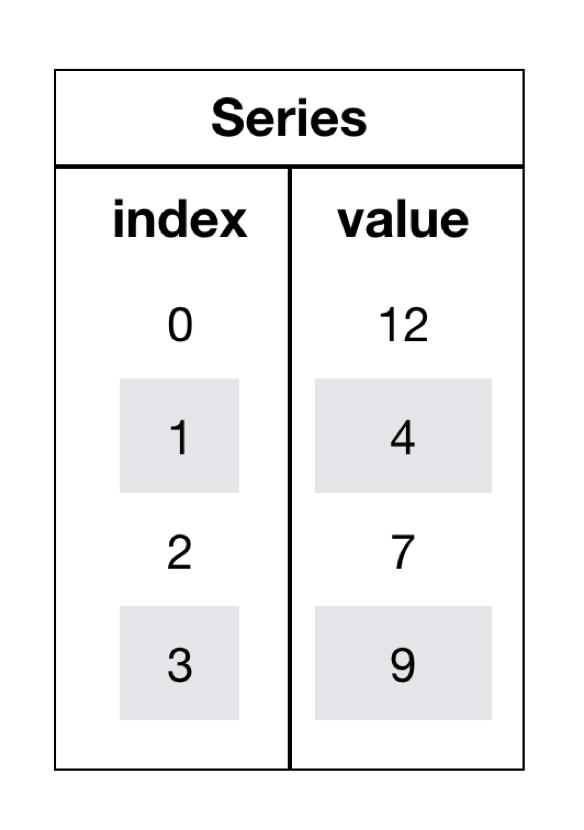
Series是一个类似于一维数组的数据结构,主要由一组数据(data)和与之相关的索引(index)两部分构成。如下图所示:
下面看如何创建Series:
- 不指定index,使用默认index(0-N)
s1 = pd.Series([12, 4, 7, 9])

s1
0    12

1     4

2     7

3     9

dtype: int64
通过index来获取数据:
s1[0]
12
s1[3]
9
- 指定index
s2 = pd.Series([12, 4, 7, 9], index=["a", "b", "c", "d"])

s2
a    12

b     4

c     7

d     9

dtype: int64
通过index来获取数据:
s2['a']
12
s2['d']
9
Series can be instantiated from dicts
s3 = pd.Series({"d": 12, "c": 4, "b": 7, "a": 9})

s3
d    12

c     4

b     7

a     9

dtype: int64
When the data is a dict, and an index is not passed, the Series index will be ordered by the dict’s insertion order, if you’re using Python version >= 3.6 and pandas version >= 0.23.
通过index来获取数据:
s3['d']
12
s3['a']
9
Series也提供了两个属性index和values:
s1.index
RangeIndex(start=0, stop=4, step=1)
s2.index
Index(['a', 'b', 'c', 'd'], dtype='object')
s3.index
Index(['d', 'c', 'b', 'a'], dtype='object')
s3.values
array([12, 4, 7, 9])
If an index is passed, the values in data corresponding to the labels in the index will be pulled out.
pd.Series({"a": 0.0, "b": 1.0, "c": 2.0}, index=["b", "c", "d", "a"])
b    1.0

c    2.0

d    NaN

a    0.0

dtype: float64
NaN (not a number) is the standard missing data marker used in pandas.
注意:这里的NaN是一个缺值标识。
如果data是一个标量,那么必须要传入index:
If data is a scalar value, an index must be provided. The value will be repeated to match the length of index.
pd.Series(5.0, index=["c", "a", "b"])
c    5.0

a    5.0

b    5.0

dtype: float64
其实上面的创建相当于:
pd.Series([5.0, 5.0, 5.0], index=["c", "a", "b"])
c    5.0

a    5.0

b    5.0

dtype: float64
ndarray上的一些操作对Series同样适用:
Series is ndarray-like. Series acts very similarly to a ndarray, and is a valid argument to most NumPy functions. However, operations such as slicing will also slice the index.
# 取s1前3个元素

s1[:3]
0    12

1     4

2     7

dtype: int64
# 哪些元素大于10

s1 > 10
0     True

1    False

2    False

3    False

dtype: bool
更多操作请翻阅上文对NumPy中的ndarray的讲解。见:https://www.cnblogs.com/bytesfly/p/numpy.html
s1.dtype
dtype('int64')
If you need the actual array backing a Series, use Series.array
# Series转为array

s1.array
<PandasArray>

[12, 4, 7, 9]

Length: 4, dtype: int64
While Series is ndarray-like, if you need an actual ndarray, then use Series.to_numpy()
# Series转为ndarray

s1.to_numpy()
array([12, 4, 7, 9])
dict上的一些操作对Series也同样适用:
Series is dict-like. A Series is like a fixed-size dict in that you can get and set values by index label
s3['a'] = 100

s3
d     12

c      4

b      7

a    100

dtype: int64
"a" in s3
True
"y" in s3
False
# 获取不到给默认值NAN

s3.get("y", np.nan)
nan
DataFrame
DataFrame is a 2-dimensional labeled data structure with columns of potentially different types. You can think of it like a spreadsheet or SQL table, or a dict of Series objects. It is generally the most commonly used pandas object.
DataFrame是一个类似于二维数组或表的对象,既有行索引,又有列索引。如下图所示:
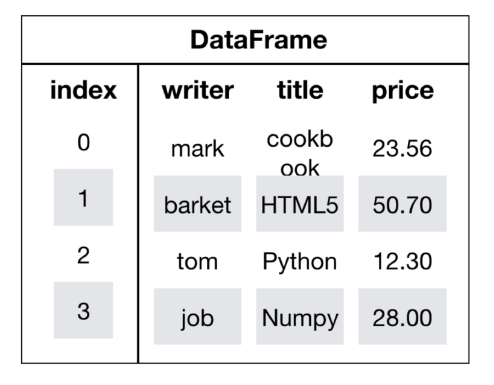
- 行索引(或者叫行标签),表明不同行,横向索引,叫index,0轴,axis=0
- 列索引(或者叫列标签),表名不同列,纵向索引,叫columns,1轴,axis=1
下面看如何创建DataFrame:
- 不指定行、列标签,默认使用0-N索引
# 随机生成6名学生,5门课程的分数

score = np.random.randint(50, 100, (6, 5))

# 创建DataFrame

pd.DataFrame(score)
.dataframe tbody tr th:only-of-type { vertical-align: middle }
.dataframe tbody tr th { vertical-align: top }
.dataframe thead th { text-align: right }
| 0 | 1 | 2 | 3 | 4 | |
|---|---|---|---|---|---|
| 0 | 69 | 90 | 56 | 97 | 79 |
| 1 | 57 | 98 | 70 | 57 | 82 |
| 2 | 63 | 66 | 98 | 78 | 63 |
| 3 | 74 | 58 | 75 | 57 | 68 |
| 4 | 94 | 78 | 83 | 72 | 73 |
| 5 | 60 | 73 | 62 | 72 | 79 |
- 指定行、列标签
# 列标签

subjects = ["语文", "数学", "英语", "物理", "化学"]

# 行标签

stus = ['学生' + str(i+1) for i in range(score.shape[0])]

# 创建DataFrame

score_df = pd.DataFrame(score, columns=subjects, index=stus)

score_df
.dataframe tbody tr th:only-of-type { vertical-align: middle }
.dataframe tbody tr th { vertical-align: top }
.dataframe thead th { text-align: right }
| 语文 | 数学 | 英语 | 物理 | 化学 | |
|---|---|---|---|---|---|
| 学生1 | 69 | 90 | 56 | 97 | 79 |
| 学生2 | 57 | 98 | 70 | 57 | 82 |
| 学生3 | 63 | 66 | 98 | 78 | 63 |
| 学生4 | 74 | 58 | 75 | 57 | 68 |
| 学生5 | 94 | 78 | 83 | 72 | 73 |
| 学生6 | 60 | 73 | 62 | 72 | 79 |
加了行列标签后,显然数据可读性更强了,一目了然。
同样再看DataFrame的几个基本属性:
score_df.shape
(6, 5)
score_df.columns
Index(['语文', '数学', '英语', '物理', '化学'], dtype='object')
score_df.index
Index(['学生1', '学生2', '学生3', '学生4', '学生5', '学生6'], dtype='object')
score_df.values
array([[69, 90, 56, 97, 79],

       [57, 98, 70, 57, 82],

       [63, 66, 98, 78, 63],

       [74, 58, 75, 57, 68],

       [94, 78, 83, 72, 73],

       [60, 73, 62, 72, 79]])
# 转置

score_df.T
.dataframe tbody tr th:only-of-type { vertical-align: middle }
.dataframe tbody tr th { vertical-align: top }
.dataframe thead th { text-align: right }
| 学生1 | 学生2 | 学生3 | 学生4 | 学生5 | 学生6 | |
|---|---|---|---|---|---|---|
| 语文 | 69 | 57 | 63 | 74 | 94 | 60 |
| 数学 | 90 | 98 | 66 | 58 | 78 | 73 |
| 英语 | 56 | 70 | 98 | 75 | 83 | 62 |
| 物理 | 97 | 57 | 78 | 57 | 72 | 72 |
| 化学 | 79 | 82 | 63 | 68 | 73 | 79 |
# 显示前3行内容

score_df.head(3)
.dataframe tbody tr th:only-of-type { vertical-align: middle }
.dataframe tbody tr th { vertical-align: top }
.dataframe thead th { text-align: right }
| 语文 | 数学 | 英语 | 物理 | 化学 | |
|---|---|---|---|---|---|
| 学生1 | 69 | 90 | 56 | 97 | 79 |
| 学生2 | 57 | 98 | 70 | 57 | 82 |
| 学生3 | 63 | 66 | 98 | 78 | 63 |
# 显示后3行内容

score_df.tail(3)
.dataframe tbody tr th:only-of-type { vertical-align: middle }
.dataframe tbody tr th { vertical-align: top }
.dataframe thead th { text-align: right }
| 语文 | 数学 | 英语 | 物理 | 化学 | |
|---|---|---|---|---|---|
| 学生4 | 74 | 58 | 75 | 57 | 68 |
| 学生5 | 94 | 78 | 83 | 72 | 73 |
| 学生6 | 60 | 73 | 62 | 72 | 79 |
修改行标签:
stus = ['stu' + str(i+1) for i in range(score.shape[0])]

score_df.index = stus

score_df
.dataframe tbody tr th:only-of-type { vertical-align: middle }
.dataframe tbody tr th { vertical-align: top }
.dataframe thead th { text-align: right }
| 语文 | 数学 | 英语 | 物理 | 化学 | |
|---|---|---|---|---|---|
| stu1 | 69 | 90 | 56 | 97 | 79 |
| stu2 | 57 | 98 | 70 | 57 | 82 |
| stu3 | 63 | 66 | 98 | 78 | 63 |
| stu4 | 74 | 58 | 75 | 57 | 68 |
| stu5 | 94 | 78 | 83 | 72 | 73 |
| stu6 | 60 | 73 | 62 | 72 | 79 |
重置行标签:
# drop默认为False,不删除原来的索引值

score_df.reset_index()
.dataframe tbody tr th:only-of-type { vertical-align: middle }
.dataframe tbody tr th { vertical-align: top }
.dataframe thead th { text-align: right }
| index | 语文 | 数学 | 英语 | 物理 | 化学 | |
|---|---|---|---|---|---|---|
| 0 | stu1 | 69 | 90 | 56 | 97 | 79 |
| 1 | stu2 | 57 | 98 | 70 | 57 | 82 |
| 2 | stu3 | 63 | 66 | 98 | 78 | 63 |
| 3 | stu4 | 74 | 58 | 75 | 57 | 68 |
| 4 | stu5 | 94 | 78 | 83 | 72 | 73 |
| 5 | stu6 | 60 | 73 | 62 | 72 | 79 |
# drop为True, 则删除原来的索引值

score_df.reset_index(drop=True)
.dataframe tbody tr th:only-of-type { vertical-align: middle }
.dataframe tbody tr th { vertical-align: top }
.dataframe thead th { text-align: right }
| 语文 | 数学 | 英语 | 物理 | 化学 | |
|---|---|---|---|---|---|
| 0 | 69 | 90 | 56 | 97 | 79 |
| 1 | 57 | 98 | 70 | 57 | 82 |
| 2 | 63 | 66 | 98 | 78 | 63 |
| 3 | 74 | 58 | 75 | 57 | 68 |
| 4 | 94 | 78 | 83 | 72 | 73 |
| 5 | 60 | 73 | 62 | 72 | 79 |
score_df
.dataframe tbody tr th:only-of-type { vertical-align: middle }
.dataframe tbody tr th { vertical-align: top }
.dataframe thead th { text-align: right }
| 语文 | 数学 | 英语 | 物理 | 化学 | |
|---|---|---|---|---|---|
| stu1 | 69 | 90 | 56 | 97 | 79 |
| stu2 | 57 | 98 | 70 | 57 | 82 |
| stu3 | 63 | 66 | 98 | 78 | 63 |
| stu4 | 74 | 58 | 75 | 57 | 68 |
| stu5 | 94 | 78 | 83 | 72 | 73 |
| stu6 | 60 | 73 | 62 | 72 | 79 |
将某列值设置为新的索引:
set_index(keys, drop=True)
- keys : 列索引名成或者列索引名称的列表
- drop : boolean, default True.当做新的索引,删除原来的列
hero_df = pd.DataFrame({'id': [1, 2, 3, 4, 5],

                        'name': ['李寻欢', '令狐冲', '张无忌', '郭靖', '花无缺'],

                        'book': ['多情剑客无情剑', '笑傲江湖', '倚天屠龙记', '射雕英雄传', '绝代双骄'],

                        'skill': ['小李飞刀', '独孤九剑', '九阳神功', '降龙十八掌', '移花接玉']})

hero_df.set_index('id')
.dataframe tbody tr th:only-of-type { vertical-align: middle }
.dataframe tbody tr th { vertical-align: top }
.dataframe thead th { text-align: right }
| name | book | skill | |
|---|---|---|---|
| id | |||
| 1 | 李寻欢 | 多情剑客无情剑 | 小李飞刀 |
| 2 | 令狐冲 | 笑傲江湖 | 独孤九剑 |
| 3 | 张无忌 | 倚天屠龙记 | 九阳神功 |
| 4 | 郭靖 | 射雕英雄传 | 降龙十八掌 |
| 5 | 花无缺 | 绝代双骄 | 移花接玉 |
设置多个索引,以id和name:
df = hero_df.set_index(['id', 'name'])

df
.dataframe tbody tr th:only-of-type { vertical-align: middle }
.dataframe tbody tr th { vertical-align: top }
.dataframe thead th { text-align: right }
| book | skill | ||
|---|---|---|---|
| id | name | ||
| 1 | 李寻欢 | 多情剑客无情剑 | 小李飞刀 |
| 2 | 令狐冲 | 笑傲江湖 | 独孤九剑 |
| 3 | 张无忌 | 倚天屠龙记 | 九阳神功 |
| 4 | 郭靖 | 射雕英雄传 | 降龙十八掌 |
| 5 | 花无缺 | 绝代双骄 | 移花接玉 |
df.index
MultiIndex([(1, '李寻欢'),

            (2, '令狐冲'),

            (3, '张无忌'),

            (4,  '郭靖'),

            (5, '花无缺')],

           names=['id', 'name'])
此时df就是一个具有MultiIndex的DataFrame。
MultiIndex
df.index.names
FrozenList(['id', 'name'])
df.index.levels
FrozenList([[1, 2, 3, 4, 5], ['令狐冲', '张无忌', '李寻欢', '花无缺', '郭靖']])
数据操作与运算
df
.dataframe tbody tr th:only-of-type { vertical-align: middle }
.dataframe tbody tr th { vertical-align: top }
.dataframe thead th { text-align: right }
| book | skill | ||
|---|---|---|---|
| id | name | ||
| 1 | 李寻欢 | 多情剑客无情剑 | 小李飞刀 |
| 2 | 令狐冲 | 笑傲江湖 | 独孤九剑 |
| 3 | 张无忌 | 倚天屠龙记 | 九阳神功 |
| 4 | 郭靖 | 射雕英雄传 | 降龙十八掌 |
| 5 | 花无缺 | 绝代双骄 | 移花接玉 |
索引操作
- 直接使用行列索引(先列后行):
df['skill']
id  name

1   李寻欢      小李飞刀

2   令狐冲      独孤九剑

3   张无忌      九阳神功

4   郭靖      降龙十八掌

5   花无缺      移花接玉

Name: skill, dtype: object
df['skill'][1]
name

李寻欢    小李飞刀

Name: skill, dtype: object
df['skill'][1]['李寻欢']
'小李飞刀'
- 使用
loc(指定行列索引的名字)
df.loc[1:3]
.dataframe tbody tr th:only-of-type { vertical-align: middle }
.dataframe tbody tr th { vertical-align: top }
.dataframe thead th { text-align: right }
| book | skill | ||
|---|---|---|---|
| id | name | ||
| 1 | 李寻欢 | 多情剑客无情剑 | 小李飞刀 |
| 2 | 令狐冲 | 笑傲江湖 | 独孤九剑 |
| 3 | 张无忌 | 倚天屠龙记 | 九阳神功 |
df.loc[(2, '令狐冲'):(4, '郭靖')]
.dataframe tbody tr th:only-of-type { vertical-align: middle }
.dataframe tbody tr th { vertical-align: top }
.dataframe thead th { text-align: right }
| book | skill | ||
|---|---|---|---|
| id | name | ||
| 2 | 令狐冲 | 笑傲江湖 | 独孤九剑 |
| 3 | 张无忌 | 倚天屠龙记 | 九阳神功 |
| 4 | 郭靖 | 射雕英雄传 | 降龙十八掌 |
df.loc[1:3, 'book']
id  name

1   李寻欢     多情剑客无情剑

2   令狐冲        笑傲江湖

3   张无忌       倚天屠龙记

Name: book, dtype: object
df.loc[df.index[1:3], ['book', 'skill']]
.dataframe tbody tr th:only-of-type { vertical-align: middle }
.dataframe tbody tr th { vertical-align: top }
.dataframe thead th { text-align: right }
| book | skill | ||
|---|---|---|---|
| id | name | ||
| 2 | 令狐冲 | 笑傲江湖 | 独孤九剑 |
| 3 | 张无忌 | 倚天屠龙记 | 九阳神功 |
- 使用iloc(通过索引的下标)
# 获取前2行数据

df.iloc[:2]
.dataframe tbody tr th:only-of-type { vertical-align: middle }
.dataframe tbody tr th { vertical-align: top }
.dataframe thead th { text-align: right }
| book | skill | ||
|---|---|---|---|
| id | name | ||
| 1 | 李寻欢 | 多情剑客无情剑 | 小李飞刀 |
| 2 | 令狐冲 | 笑傲江湖 | 独孤九剑 |
df.iloc[0:2, df.columns.get_indexer(['skill'])]
.dataframe tbody tr th:only-of-type { vertical-align: middle }
.dataframe tbody tr th { vertical-align: top }
.dataframe thead th { text-align: right }
| skill | ||
|---|---|---|
| id | name | |
| 1 | 李寻欢 | 小李飞刀 |
| 2 | 令狐冲 | 独孤九剑 |
赋值操作
# 添加新列

df['score'] = 100

df['gender'] = 'male'

df
.dataframe tbody tr th:only-of-type { vertical-align: middle }
.dataframe tbody tr th { vertical-align: top }
.dataframe thead th { text-align: right }
| book | skill | score | gender | ||
|---|---|---|---|---|---|
| id | name | ||||
| 1 | 李寻欢 | 多情剑客无情剑 | 小李飞刀 | 100 | male |
| 2 | 令狐冲 | 笑傲江湖 | 独孤九剑 | 100 | male |
| 3 | 张无忌 | 倚天屠龙记 | 九阳神功 | 100 | male |
| 4 | 郭靖 | 射雕英雄传 | 降龙十八掌 | 100 | male |
| 5 | 花无缺 | 绝代双骄 | 移花接玉 | 100 | male |
# 修改列值

df['score'] = 99

df
.dataframe tbody tr th:only-of-type { vertical-align: middle }
.dataframe tbody tr th { vertical-align: top }
.dataframe thead th { text-align: right }
| book | skill | score | gender | ||
|---|---|---|---|---|---|
| id | name | ||||
| 1 | 李寻欢 | 多情剑客无情剑 | 小李飞刀 | 99 | male |
| 2 | 令狐冲 | 笑傲江湖 | 独孤九剑 | 99 | male |
| 3 | 张无忌 | 倚天屠龙记 | 九阳神功 | 99 | male |
| 4 | 郭靖 | 射雕英雄传 | 降龙十八掌 | 99 | male |
| 5 | 花无缺 | 绝代双骄 | 移花接玉 | 99 | male |
# 或者这样修改列值

df.score = 100

df
.dataframe tbody tr th:only-of-type { vertical-align: middle }
.dataframe tbody tr th { vertical-align: top }
.dataframe thead th { text-align: right }
| book | skill | score | gender | ||
|---|---|---|---|---|---|
| id | name | ||||
| 1 | 李寻欢 | 多情剑客无情剑 | 小李飞刀 | 100 | male |
| 2 | 令狐冲 | 笑傲江湖 | 独孤九剑 | 100 | male |
| 3 | 张无忌 | 倚天屠龙记 | 九阳神功 | 100 | male |
| 4 | 郭靖 | 射雕英雄传 | 降龙十八掌 | 100 | male |
| 5 | 花无缺 | 绝代双骄 | 移花接玉 | 100 | male |
排序
- sort_index
# 按索引降序

df.sort_index(ascending=False)
.dataframe tbody tr th:only-of-type { vertical-align: middle }
.dataframe tbody tr th { vertical-align: top }
.dataframe thead th { text-align: right }
| book | skill | score | gender | ||
|---|---|---|---|---|---|
| id | name | ||||
| 5 | 花无缺 | 绝代双骄 | 移花接玉 | 100 | male |
| 4 | 郭靖 | 射雕英雄传 | 降龙十八掌 | 100 | male |
| 3 | 张无忌 | 倚天屠龙记 | 九阳神功 | 100 | male |
| 2 | 令狐冲 | 笑傲江湖 | 独孤九剑 | 100 | male |
| 1 | 李寻欢 | 多情剑客无情剑 | 小李飞刀 | 100 | male |
- sort_values
先把score设置为不同的值:
df['score'][1]['李寻欢'] = 80

df['score'][2]['令狐冲'] = 96

df['score'][3]['张无忌'] = 86

df['score'][4]['郭靖'] = 99

df['score'][5]['花无缺'] = 95

df
.dataframe tbody tr th:only-of-type { vertical-align: middle }
.dataframe tbody tr th { vertical-align: top }
.dataframe thead th { text-align: right }
| book | skill | score | gender | ||
|---|---|---|---|---|---|
| id | name | ||||
| 1 | 李寻欢 | 多情剑客无情剑 | 小李飞刀 | 80 | male |
| 2 | 令狐冲 | 笑傲江湖 | 独孤九剑 | 96 | male |
| 3 | 张无忌 | 倚天屠龙记 | 九阳神功 | 86 | male |
| 4 | 郭靖 | 射雕英雄传 | 降龙十八掌 | 99 | male |
| 5 | 花无缺 | 绝代双骄 | 移花接玉 | 95 | male |
# 按照score降序

df.sort_values(by='score', ascending=False)
.dataframe tbody tr th:only-of-type { vertical-align: middle }
.dataframe tbody tr th { vertical-align: top }
.dataframe thead th { text-align: right }
| book | skill | score | gender | ||
|---|---|---|---|---|---|
| id | name | ||||
| 4 | 郭靖 | 射雕英雄传 | 降龙十八掌 | 99 | male |
| 2 | 令狐冲 | 笑傲江湖 | 独孤九剑 | 96 | male |
| 5 | 花无缺 | 绝代双骄 | 移花接玉 | 95 | male |
| 3 | 张无忌 | 倚天屠龙记 | 九阳神功 | 86 | male |
| 1 | 李寻欢 | 多情剑客无情剑 | 小李飞刀 | 80 | male |
# 按照book名称字符串长度 升序

df.sort_values(by='book', key=lambda col: col.str.len())
.dataframe tbody tr th:only-of-type { vertical-align: middle }
.dataframe tbody tr th { vertical-align: top }
.dataframe thead th { text-align: right }
| book | skill | score | gender | ||
|---|---|---|---|---|---|
| id | name | ||||
| 2 | 令狐冲 | 笑傲江湖 | 独孤九剑 | 96 | male |
| 5 | 花无缺 | 绝代双骄 | 移花接玉 | 95 | male |
| 3 | 张无忌 | 倚天屠龙记 | 九阳神功 | 86 | male |
| 4 | 郭靖 | 射雕英雄传 | 降龙十八掌 | 99 | male |
| 1 | 李寻欢 | 多情剑客无情剑 | 小李飞刀 | 80 | male |
算术运算
# score+1

df['score'].add(1)
id  name

1   李寻欢      81

2   令狐冲      97

3   张无忌      87

4   郭靖      100

5   花无缺      96

Name: score, dtype: int64
# score-1

df['score'].sub(1)
id  name

1   李寻欢     79

2   令狐冲     95

3   张无忌     85

4   郭靖      98

5   花无缺     94

Name: score, dtype: int64
# 或者直接用 + - * / // %等运算符

(df['score'] + 1) % 10
id  name

1   李寻欢     1

2   令狐冲     7

3   张无忌     7

4   郭靖      0

5   花无缺     6

Name: score, dtype: int64
逻辑运算
先回顾一下数据内容:
df
.dataframe tbody tr th:only-of-type { vertical-align: middle }
.dataframe tbody tr th { vertical-align: top }
.dataframe thead th { text-align: right }
| book | skill | score | gender | ||
|---|---|---|---|---|---|
| id | name | ||||
| 1 | 李寻欢 | 多情剑客无情剑 | 小李飞刀 | 80 | male |
| 2 | 令狐冲 | 笑傲江湖 | 独孤九剑 | 96 | male |
| 3 | 张无忌 | 倚天屠龙记 | 九阳神功 | 86 | male |
| 4 | 郭靖 | 射雕英雄传 | 降龙十八掌 | 99 | male |
| 5 | 花无缺 | 绝代双骄 | 移花接玉 | 95 | male |
逻辑运算结果:
df['score'] > 90
id  name

1   李寻欢     False

2   令狐冲      True

3   张无忌     False

4   郭靖       True

5   花无缺      True

Name: score, dtype: bool
# 筛选出分数大于90的行

df[df['score'] > 90]
.dataframe tbody tr th:only-of-type { vertical-align: middle }
.dataframe tbody tr th { vertical-align: top }
.dataframe thead th { text-align: right }
| book | skill | score | gender | ||
|---|---|---|---|---|---|
| id | name | ||||
| 2 | 令狐冲 | 笑傲江湖 | 独孤九剑 | 96 | male |
| 4 | 郭靖 | 射雕英雄传 | 降龙十八掌 | 99 | male |
| 5 | 花无缺 | 绝代双骄 | 移花接玉 | 95 | male |
# 筛选出分数在85到90之间的行

df[(df['score'] > 85) & (df['score'] < 90)]
.dataframe tbody tr th:only-of-type { vertical-align: middle }
.dataframe tbody tr th { vertical-align: top }
.dataframe thead th { text-align: right }
| book | skill | score | gender | ||
|---|---|---|---|---|---|
| id | name | ||||
| 3 | 张无忌 | 倚天屠龙记 | 九阳神功 | 86 | male |
# 筛选出分数在85以下或者95以上的行

df[(df['score'] < 85) | (df['score'] > 95)]
.dataframe tbody tr th:only-of-type { vertical-align: middle }
.dataframe tbody tr th { vertical-align: top }
.dataframe thead th { text-align: right }
| book | skill | score | gender | ||
|---|---|---|---|---|---|
| id | name | ||||
| 1 | 李寻欢 | 多情剑客无情剑 | 小李飞刀 | 80 | male |
| 2 | 令狐冲 | 笑傲江湖 | 独孤九剑 | 96 | male |
| 4 | 郭靖 | 射雕英雄传 | 降龙十八掌 | 99 | male |
或者通过query()函数实现上面的需求:
df.query("score<85 | score>95")
.dataframe tbody tr th:only-of-type { vertical-align: middle }
.dataframe tbody tr th { vertical-align: top }
.dataframe thead th { text-align: right }
| book | skill | score | gender | ||
|---|---|---|---|---|---|
| id | name | ||||
| 1 | 李寻欢 | 多情剑客无情剑 | 小李飞刀 | 80 | male |
| 2 | 令狐冲 | 笑傲江湖 | 独孤九剑 | 96 | male |
| 4 | 郭靖 | 射雕英雄传 | 降龙十八掌 | 99 | male |
此外,可以用isin(values)函数来筛选指定的值,类似于SQL中in查询:
df[df["score"].isin([99, 96])]
.dataframe tbody tr th:only-of-type { vertical-align: middle }
.dataframe tbody tr th { vertical-align: top }
.dataframe thead th { text-align: right }
| book | skill | score | gender | ||
|---|---|---|---|---|---|
| id | name | ||||
| 2 | 令狐冲 | 笑傲江湖 | 独孤九剑 | 96 | male |
| 4 | 郭靖 | 射雕英雄传 | 降龙十八掌 | 99 | male |
统计运算
describe()能够直接得出很多统计结果:count, mean, std, min, max 等:
df.describe()
.dataframe tbody tr th:only-of-type { vertical-align: middle }
.dataframe tbody tr th { vertical-align: top }
.dataframe thead th { text-align: right }
| score | |
|---|---|
| count | 5.000000 |
| mean | 91.200000 |
| std | 7.918333 |
| min | 80.000000 |
| 25% | 86.000000 |
| 50% | 95.000000 |
| 75% | 96.000000 |
| max | 99.000000 |
# 使用统计函数:axis=0代表求列统计结果,1代表求行统计结果

df.max(axis=0, numeric_only=True)
score    99

dtype: int64
其他几个常用的聚合函数都类似。不再一一举例。
下面重点看下累计统计函数。
| 函数 | 作用 |
|---|---|
| cumsum | 计算前1/2/3/…/n个数的和 |
| cummax | 计算前1/2/3/…/n个数的最大值 |
| cummin | 计算前1/2/3/…/n个数的最小值 |
| cumprod | 计算前1/2/3/…/n个数的积 |
下面是某公司近半年以来的各部门的营业收入数据:
income = pd.DataFrame(data=np.random.randint(60, 100, (6, 5)),

                      columns=['group' + str(x) for x in range(1, 6)],

                      index=['Month' + str(x) for x in range(1, 7)])

income
.dataframe tbody tr th:only-of-type { vertical-align: middle }
.dataframe tbody tr th { vertical-align: top }
.dataframe thead th { text-align: right }
| group1 | group2 | group3 | group4 | group5 | |
|---|---|---|---|---|---|
| Month1 | 97 | 89 | 62 | 82 | 71 |
| Month2 | 68 | 69 | 82 | 66 | 79 |
| Month3 | 77 | 87 | 66 | 94 | 82 |
| Month4 | 69 | 76 | 99 | 79 | 61 |
| Month5 | 77 | 94 | 76 | 70 | 70 |
| Month6 | 89 | 64 | 92 | 63 | 60 |
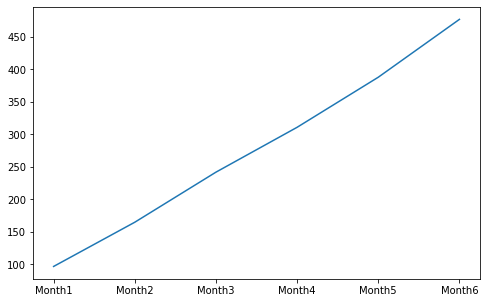
统计group1的前N个月的总营业收入:
group1_income = income['group1']

group1_income.cumsum()
Month1     97

Month2    165

Month3    242

Month4    311

Month5    388

Month6    477

Name: group1, dtype: int64
用图形展示会更加直观:
group1_income.cumsum().plot(figsize=(8, 5))

plt.show()
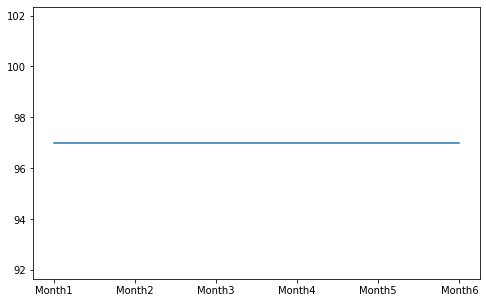
同理,统计group1的前N个月的最大营业收入:
group1_income.cummax().plot(figsize=(8, 5))

plt.show()
其他运算
先看下近半年以来前3个部门的营业收入数据:
income[['group1', 'group2', 'group3']]
.dataframe tbody tr th:only-of-type { vertical-align: middle }
.dataframe tbody tr th { vertical-align: top }
.dataframe thead th { text-align: right }
| group1 | group2 | group3 | |
|---|---|---|---|
| Month1 | 97 | 89 | 62 |
| Month2 | 68 | 69 | 82 |
| Month3 | 77 | 87 | 66 |
| Month4 | 69 | 76 | 99 |
| Month5 | 77 | 94 | 76 |
| Month6 | 89 | 64 | 92 |
# 近半年 前3个部门 每月营业收入极差

income[['group1', 'group2', 'group3']].apply(lambda x: x.max() - x.min(), axis=1)
Month1    35

Month2    14

Month3    21

Month4    30

Month5    18

Month6    28

dtype: int64
# 近半年 前3个部门 每个部门营业收入极差

income[['group1', 'group2', 'group3']].apply(lambda x: x.max() - x.min(), axis=0)
group1    29

group2    30

group3    37

dtype: int64
文件读写
The pandas I/O API is a set of top level reader functions accessed like pandas.read_csv() that generally return a pandas object. The corresponding writer functions are object methods that are accessed like DataFrame.to_csv(). Below is a table containing available readers and writers.
| Format Type | Data Description | Reader | Writer |
|---|---|---|---|
| text | CSV | read_csv | to_csv |
| text | Fixed-Width Text File | read_fwf | |
| text | JSON | read_json | to_json |
| text | HTML | read_html | to_html |
| text | Local clipboard | read_clipboard | to_clipboard |
| binary | MS Excel | read_excel | to_excel |
| binary | OpenDocument | read_excel | |
| binary | HDF5 Format | read_hdf | to_hdf |
| binary | Feather Format | read_feather | to_feather |
| binary | Parquet Format | read_parquet | to_parquet |
| binary | ORC Format | read_orc | |
| binary | Msgpack | read_msgpack | to_msgpack |
| binary | Stata | read_stata | to_stata |
| binary | SAS | read_sas | |
| binary | SPSS | read_spss | |
| binary | Python Pickle Format | read_pickle | to_pickle |
| SQL | SQL | read_sql | to_sql |
| SQL | Google BigQuery | read_gbq | to_gbq |
CSV
这里用下面网址的csv数据来做一些测试:
https://www.stats.govt.nz/large-datasets/csv-files-for-download/
path = "https://www.stats.govt.nz/assets/Uploads/Employment-indicators/Employment-indicators-Weekly-as-at-24-May-2021/Download-data/Employment-indicators-weekly-paid-jobs-20-days-as-at-24-May-2021.csv"

# 读csv

data = pd.read_csv(path, sep=',', usecols=['Week_end', 'High_industry', 'Value'])

data
.dataframe tbody tr th:only-of-type { vertical-align: middle }
.dataframe tbody tr th { vertical-align: top }
.dataframe thead th { text-align: right }
| Week_end | High_industry | Value | |
|---|---|---|---|
| 0 | 2019-05-05 | Total | 1828160.00 |
| 1 | 2019-05-05 | A Primary | 79880.00 |
| 2 | 2019-05-05 | B Goods Producing | 344320.00 |
| 3 | 2019-05-05 | C Services | 1389220.00 |
| 4 | 2019-05-05 | Z No Match | 14730.00 |
| ... | ... | ... | ... |
| 2095 | 2021-05-02 | Total | 700.94 |
| 2096 | 2021-05-02 | A Primary | 680.20 |
| 2097 | 2021-05-02 | B Goods Producing | 916.42 |
| 2098 | 2021-05-02 | C Services | 649.92 |
| 2099 | 2021-05-02 | Z No Match | 425.65 |
2100 rows × 3 columns
# 写csv

data[:20].to_csv("./test.csv", columns=['Week_end', 'Value'],

                 header=True, index=False, mode='w')
输出如下:
Week_end,Value

2019-05-05,1828160.0

2019-05-05,79880.0

2019-05-05,344320.0
JSON
更多Json格式数据,google关键词site:api.androidhive.info
path = "https://api.androidhive.info/json/movies.json"

# 读json

data = pd.read_json(path)

data = data.loc[:2, ['title', 'rating']]

data
.dataframe tbody tr th:only-of-type { vertical-align: middle }
.dataframe tbody tr th { vertical-align: top }
.dataframe thead th { text-align: right }
| title | rating | |
|---|---|---|
| 0 | Dawn of the Planet of the Apes | 8.3 |
| 1 | District 9 | 8.0 |
| 2 | Transformers: Age of Extinction | 6.3 |
- records
data.to_json("./test.json", orient='records', lines=True)
输出如下:
{"title":"Dawn of the Planet of the Apes","rating":8.3}

{"title":"District 9","rating":8.0}

{"title":"Transformers: Age of Extinction","rating":6.3}
如果lines=False,即:
data.to_json("./test.json", orient='records', lines=False)
输出如下:
[

    {

        "title":"Dawn of the Planet of the Apes",

        "rating":8.3

    },

    {

        "title":"District 9",

        "rating":"8.0"

    },

    {

        "title":"Transformers: Age of Extinction",

        "rating":6.3

    }

]
- columns
data.to_json("./test.json", orient='columns')
输出如下:
{

    "title":{

        "0":"Dawn of the Planet of the Apes",

        "1":"District 9",

        "2":"Transformers: Age of Extinction"

    },

    "rating":{

        "0":8.3,

        "1":"8.0",

        "2":6.3

    }

}
- index
data.to_json("./test.json", orient='index')
输出如下:
{

    "0":{

        "title":"Dawn of the Planet of the Apes",

        "rating":8.3

    },

    "1":{

        "title":"District 9",

        "rating":"8.0"

    },

    "2":{

        "title":"Transformers: Age of Extinction",

        "rating":6.3

    }

}
- split
data.to_json("./test.json", orient='split')
输出如下:
{

    "columns":[

        "title",

        "rating"

    ],

    "index":[

        0,

        1,

        2

    ],

    "data":[

        [

            "Dawn of the Planet of the Apes",

            8.3

        ],

        [

            "District 9",

            "8.0"

        ],

        [

            "Transformers: Age of Extinction",

            6.3

        ]

    ]

}
- values
data.to_json("./test.json", orient='values')
输出如下:
[

    [

        "Dawn of the Planet of the Apes",

        8.3

    ],

    [

        "District 9",

        "8.0"

    ],

    [

        "Transformers: Age of Extinction",

        6.3

    ]

]
Excel
# 读Excel

team = pd.read_excel('https://www.gairuo.com/file/data/dataset/team.xlsx')

team.head(5)
.dataframe tbody tr th:only-of-type { vertical-align: middle }
.dataframe tbody tr th { vertical-align: top }
.dataframe thead th { text-align: right }
| name | team | Q1 | Q2 | Q3 | Q4 | |
|---|---|---|---|---|---|---|
| 0 | Liver | E | 89 | 21 | 24 | 64 |
| 1 | Arry | C | 36 | 37 | 37 | 57 |
| 2 | Ack | A | 57 | 60 | 18 | 84 |
| 3 | Eorge | C | 93 | 96 | 71 | 78 |
| 4 | Oah | D | 65 | 49 | 61 | 86 |
# 末尾添加一列sum, 值为Q1、Q2、Q3、Q4列的和

team['sum'] = team['Q1'] + team['Q2'] + team['Q3'] + team['Q4']

team.head(5)
.dataframe tbody tr th:only-of-type { vertical-align: middle }
.dataframe tbody tr th { vertical-align: top }
.dataframe thead th { text-align: right }
| name | team | Q1 | Q2 | Q3 | Q4 | sum | |
|---|---|---|---|---|---|---|---|
| 0 | Liver | E | 89 | 21 | 24 | 64 | 198 |
| 1 | Arry | C | 36 | 37 | 37 | 57 | 167 |
| 2 | Ack | A | 57 | 60 | 18 | 84 | 219 |
| 3 | Eorge | C | 93 | 96 | 71 | 78 | 338 |
| 4 | Oah | D | 65 | 49 | 61 | 86 | 261 |
# 写Excel

team.to_excel('test.xlsx', index=False)
HDF5
HDF5(Hierarchical Data Format)是用于存储大规模数值数据的较为理想的存储格式。
优势:
- HDF5在存储的时候支持压缩,从而提磁盘利用率,节省空间
- HDF5跨平台的,可轻松迁移到Hadoop上
score = pd.DataFrame(np.random.randint(50, 100, (100000, 10)))

score.head()
.dataframe tbody tr th:only-of-type { vertical-align: middle }
.dataframe tbody tr th { vertical-align: top }
.dataframe thead th { text-align: right }
| 0 | 1 | 2 | 3 | 4 | 5 | 6 | 7 | 8 | 9 | |
|---|---|---|---|---|---|---|---|---|---|---|
| 0 | 76 | 53 | 51 | 94 | 84 | 77 | 56 | 82 | 56 | 50 |
| 1 | 93 | 59 | 84 | 83 | 77 | 67 | 52 | 52 | 53 | 62 |
| 2 | 96 | 98 | 88 | 72 | 96 | 64 | 58 | 67 | 89 | 95 |
| 3 | 57 | 75 | 89 | 73 | 72 | 73 | 58 | 93 | 72 | 92 |
| 4 | 50 | 50 | 52 | 57 | 72 | 76 | 78 | 52 | 90 | 93 |
# 写HDF5

score.to_hdf("./score.h5", key="score", complevel=9, mode='w')
# 读HDF5

new_score = pd.read_hdf("./score.h5", key="score")

new_score.head()
.dataframe tbody tr th:only-of-type { vertical-align: middle }
.dataframe tbody tr th { vertical-align: top }
.dataframe thead th { text-align: right }
| 0 | 1 | 2 | 3 | 4 | 5 | 6 | 7 | 8 | 9 | |
|---|---|---|---|---|---|---|---|---|---|---|
| 0 | 76 | 53 | 51 | 94 | 84 | 77 | 56 | 82 | 56 | 50 |
| 1 | 93 | 59 | 84 | 83 | 77 | 67 | 52 | 52 | 53 | 62 |
| 2 | 96 | 98 | 88 | 72 | 96 | 64 | 58 | 67 | 89 | 95 |
| 3 | 57 | 75 | 89 | 73 | 72 | 73 | 58 | 93 | 72 | 92 |
| 4 | 50 | 50 | 52 | 57 | 72 | 76 | 78 | 52 | 90 | 93 |
注意:HDF5文件的读取和存储需要指定一个键(key),值为要存储的DataFrame。
score.to_csv("./score.csv", mode='w')
同时,来对比一下写HDF5与写csv的占用磁盘情况:
-rw-r--r--  1 wind  staff   3.4M  6 13 10:24 score.csv

-rw-r--r--  1 wind  staff   763K  6 13 10:23 score.h5
其他格式的文件读写也都类似,这里不再举例说明。
画图
Pandas的DataFrame和Series,在matplotlib基础上封装了一个简易的绘图函数, 使得在数据处理过程中可以方便快速可视化数据。
相关文档:
折线图 line
折线图用于分析事物随时间或有序类别而变化的趋势。
先来个快速入门的案例,绘制sin(x)的一个周期内(0, 2π)的函数图像:
# 中文字体

plt.rc('font', family='Arial Unicode MS')

plt.rc('axes', unicode_minus='False')

x = np.arange(0, 6.29, 0.01)

y = np.sin(x)

s = pd.Series(y, index=x)

s.plot(kind='line', title='sin(x)图像',

       style='--g', grid=True, figsize=(8, 6))

plt.show()
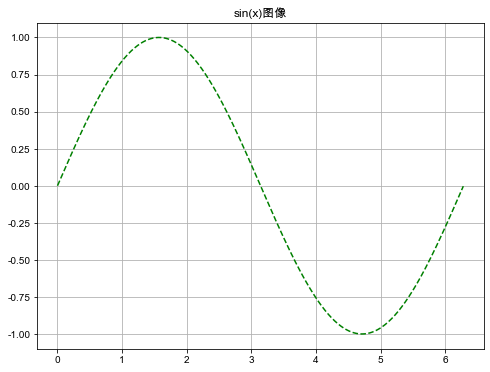
注意:中文显示有问题的,可用如下代码查看系统可用字体。
from matplotlib.font_manager import FontManager

# fonts = set([x.name for x in FontManager().ttflist])

# print(fonts)
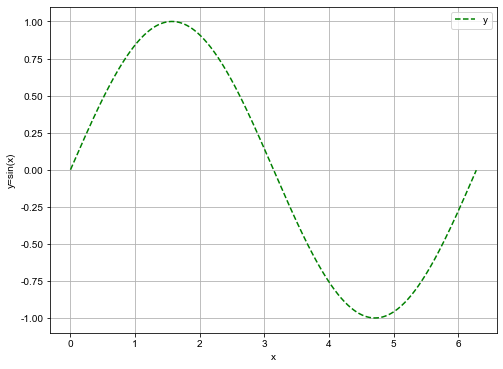
如果要绘制DataFrame数据的某2列数据的折线图,传入x='列1',y='列2',就能得到以'列1'为x轴,'列2'为y轴的线型图。如果没有指明x,x轴默认用index。如下例子:
df = pd.DataFrame({'x': x, 'y': y})

df.plot(x='x', y='y', kind='line', ylabel='y=sin(x)',

        style='--g', grid=True, figsize=(8, 6))

plt.show()
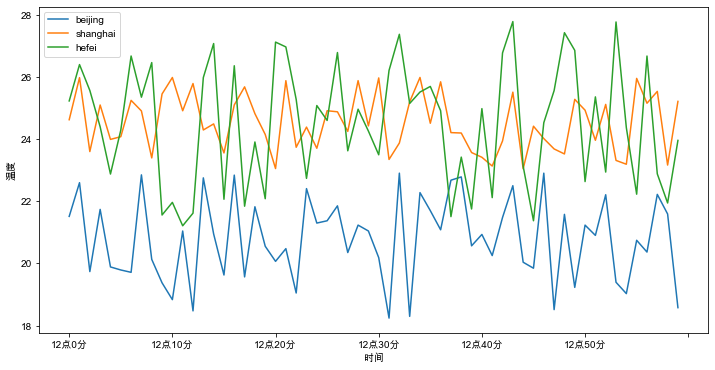
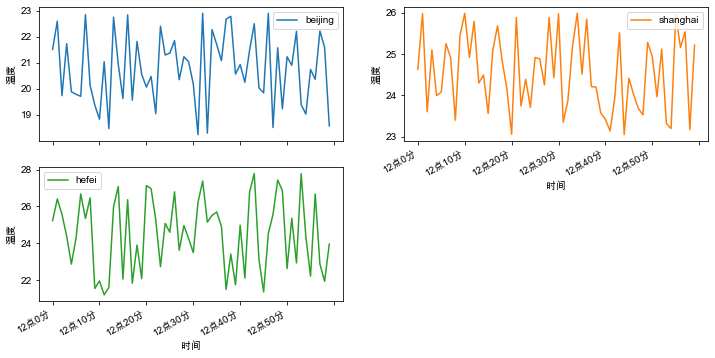
再看一个实际的案例。下面是北京、上海、合肥三个城市某天中午气温的数据。
x = [f'12点{i}分' for i in range(60)]

y_beijing = np.random.uniform(18, 23, len(x))

y_shanghai = np.random.uniform(23, 26, len(x))

y_hefei = np.random.uniform(21, 28, len(x))

df = pd.DataFrame({'x': x, 'beijing': y_beijing, 'shanghai': y_shanghai, 'hefei': y_hefei})

df.head(5)
.dataframe tbody tr th:only-of-type { vertical-align: middle }
.dataframe tbody tr th { vertical-align: top }
.dataframe thead th { text-align: right }
| x | beijing | shanghai | hefei | |
|---|---|---|---|---|
| 0 | 12点0分 | 21.516230 | 24.627902 | 25.232748 |
| 1 | 12点1分 | 22.601501 | 25.982331 | 26.403320 |
| 2 | 12点2分 | 19.739455 | 23.602787 | 25.569943 |
| 3 | 12点3分 | 21.741182 | 25.102164 | 24.400619 |
| 4 | 12点4分 | 19.888968 | 23.995114 | 22.879671 |
绘制北京、上海、合肥三个城市气温随时间变化的情况如下:
df.plot(x='x', y=['beijing', 'shanghai', 'hefei'], kind='line',

        figsize=(12, 6), xlabel='时间', ylabel='温度')

plt.show()
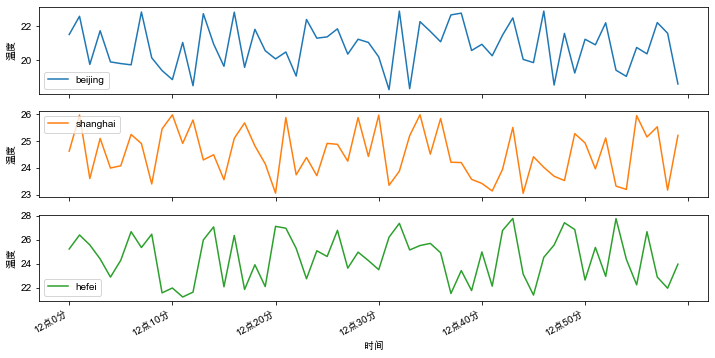
添加参数subplots=True, 可以形成多个子图,如下:
df.plot(x='x', y=['beijing', 'shanghai', 'hefei'], kind='line',

        subplots=True, figsize=(12, 6), xlabel='时间', ylabel='温度')

plt.show()
另外,参数layout=(m,n)可以指明子图的行列数,期中m*n的值要大于子图的数量,如下:
df.plot(x='x', y=['beijing', 'shanghai', 'hefei'], kind='line',

        subplots=True, layout=(2, 2), figsize=(12, 6), xlabel='时间', ylabel='温度')

plt.show()
柱状图 bar
柱状图最适合对分类的数据进行比较。
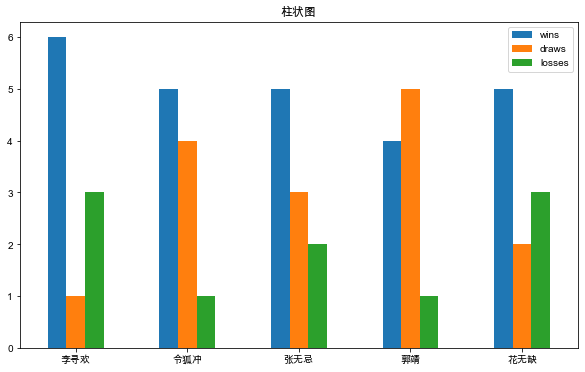
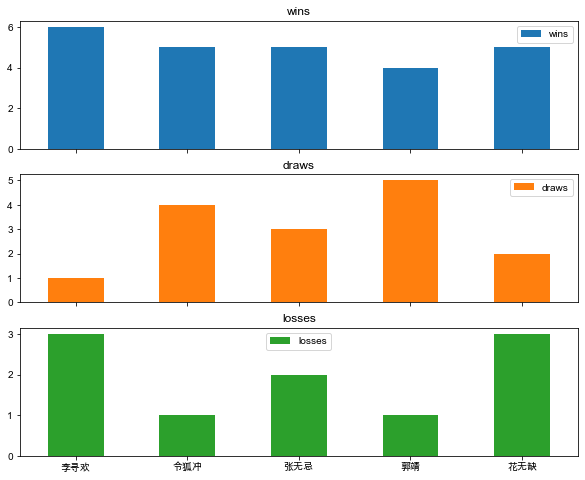
武林大会上,每个英雄参加10个回合的比拼,每人 胜局(wins)、平局(draws)、败局(losses)的统计如下:
columns = ['hero', 'wins', 'draws', 'losses']

score = [

    ['李寻欢', 6, 1, 3],

    ['令狐冲', 5, 4, 1],

    ['张无忌', 5, 3, 2],

    ['郭靖', 4, 5, 1],

    ['花无缺', 5, 2, 3]

]

df = pd.DataFrame(score, columns=columns)

df
.dataframe tbody tr th:only-of-type { vertical-align: middle }
.dataframe tbody tr th { vertical-align: top }
.dataframe thead th { text-align: right }
| hero | wins | draws | losses | |
|---|---|---|---|---|
| 0 | 李寻欢 | 6 | 1 | 3 |
| 1 | 令狐冲 | 5 | 4 | 1 |
| 2 | 张无忌 | 5 | 3 | 2 |
| 3 | 郭靖 | 4 | 5 | 1 |
| 4 | 花无缺 | 5 | 2 | 3 |
df.plot(kind='bar', x='hero', y=['wins', 'draws', 'losses'],

        rot=0, title='柱状图', xlabel='', figsize=(10, 6))

plt.show()
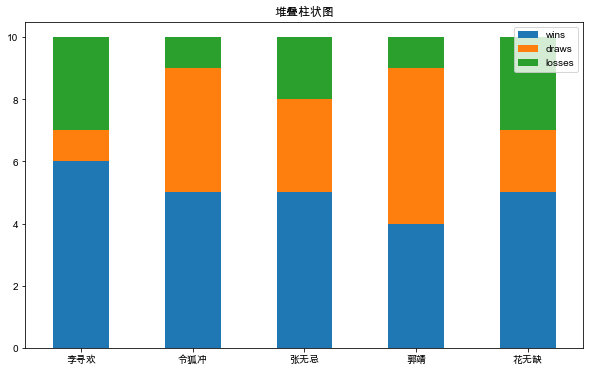
添加stacked=True可以绘制堆叠柱状图,如下:
df.plot(kind='bar', x='hero', y=['wins', 'draws', 'losses'],

        stacked=True, rot=0, title='堆叠柱状图', xlabel='', figsize=(10, 6))

plt.show()
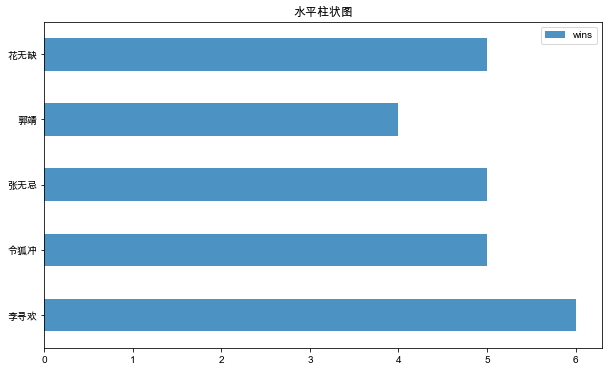
另外使用plot(kind='barh')或者plot.barh()可以绘制水平柱状图。下面rot参数设置x标签的旋转角度,alpha设置透明度,align设置对齐位置。
df.plot(kind='barh', x='hero', y=['wins'], xlabel='',

        align='center', alpha=0.8, rot=0, title='水平柱状图', figsize=(10, 6))

plt.show()
同样添加参数subplots=True,可以形成多个子图,如下:
df.plot(kind='bar', x='hero', y=['wins', 'draws', 'losses'],

        subplots=True, rot=0, xlabel='', figsize=(10, 8))

plt.show()
饼图 pie
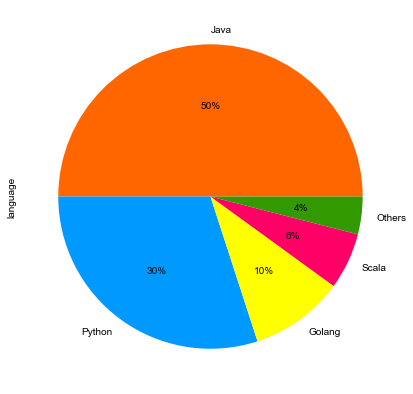
饼图最显著的功能在于表现“占比”。
每当某些机构或者平台发布编程语言排行榜以及市场占有率时,相信行业内的很多朋友会很自然地瞄上几眼。
这里举个某互联网公司研发部使用的后端编程语言占比:
colors = ['#FF6600', '#0099FF', '#FFFF00', '#FF0066', '#339900']

language = ['Java', 'Python', 'Golang', 'Scala', 'Others']

s = pd.Series([0.5, 0.3, 0.1, 0.06, 0.04], name='language',

              index=language)

s.plot(kind='pie', figsize=(7, 7),

       autopct="%.0f%%", colors=colors)

plt.show()
散点图 scatter
散点图适用于分析变量之间是否存在某种关系或相关性。
先造一些随机数据,如下:
x = np.random.uniform(0, 100, 100)

y = [2*n for n in x]

df = pd.DataFrame({'x': x, 'y': y})

df.head(5)
.dataframe tbody tr th:only-of-type { vertical-align: middle }
.dataframe tbody tr th { vertical-align: top }
.dataframe thead th { text-align: right }
| x | y | |
|---|---|---|
| 0 | 10.405567 | 20.811134 |
| 1 | 24.520765 | 49.041530 |
| 2 | 32.735258 | 65.470516 |
| 3 | 90.868823 | 181.737646 |
| 4 | 21.875188 | 43.750377 |
绘制散点图,如下:
df.plot(kind='scatter', x='x', y='y', figsize=(12, 6))

plt.show()
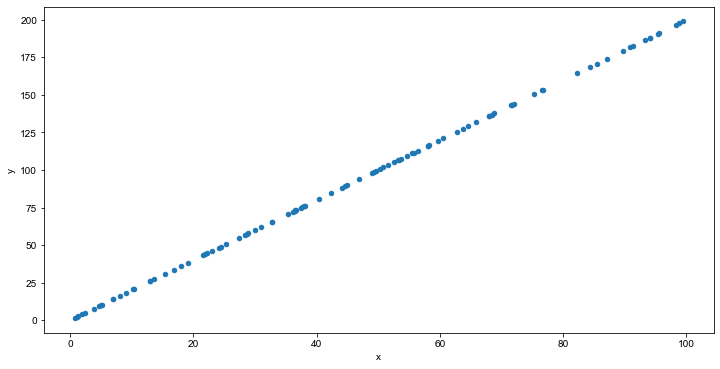
从图中,可以看出y与x可能存在正相关的关系。
直方图 hist
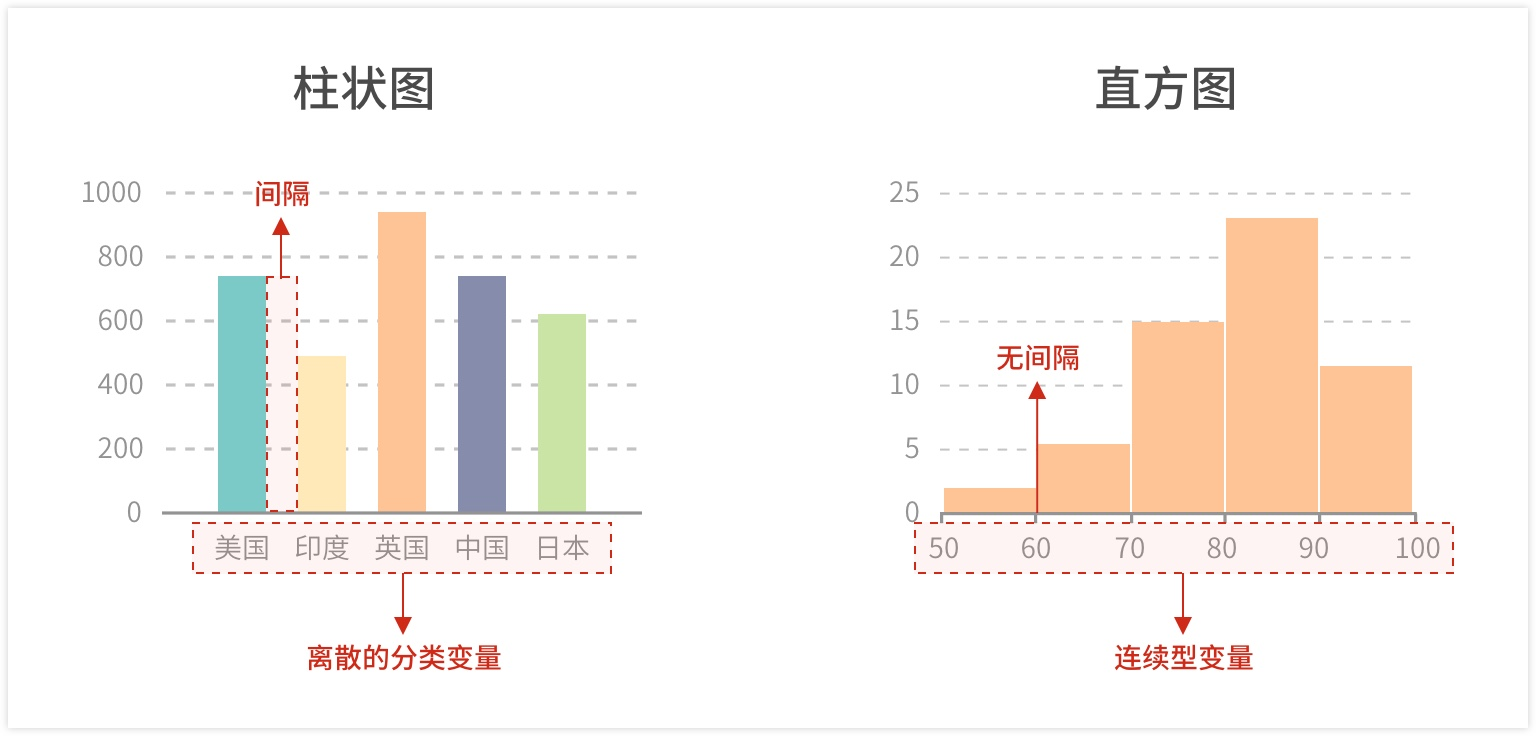
直方图用于表示数据的分布情况。一般用横轴表示数据区间,纵轴表示分布情况,柱子越高,则落在该区间的数量越大。
构建直方图,首先要确定“组距”、对数值的范围进行分区,通俗的说即是划定有几根柱子(例如0-100分,每隔20分划一个区间,共5个区间)。接着,对落在每个区间的数值进行频次计算(如落在80-100分的10人,60-80分的20人,以此类推)。 最后,绘制矩形,高度由频数决定。
注意:直方图并不等于柱状图,不能对离散的分类数据进行比较。
在前文 快速上手NumPy 中,简单讲过正态分布,也画过正态分布的直方图。下面看用pandas如何画直方图:
已知某地区成年男性身高近似服从正态分布。下面生成均值为170,标准差为5的100000个符合正态分布规律的样本数据。
height = np.random.normal(170, 5, 100000)

df = pd.DataFrame({'height': height})

df.head(5)
.dataframe tbody tr th:only-of-type { vertical-align: middle }
.dataframe tbody tr th { vertical-align: top }
.dataframe thead th { text-align: right }
| height | |
|---|---|
| 0 | 166.547946 |
| 1 | 166.847060 |
| 2 | 166.887866 |
| 3 | 175.607073 |
| 4 | 181.527058 |
绘制直方图,其中分组数为100:
df.plot(kind='hist', bins=100, figsize=(10, 5))

plt.grid(True, linestyle='--', alpha=0.8)

plt.show()
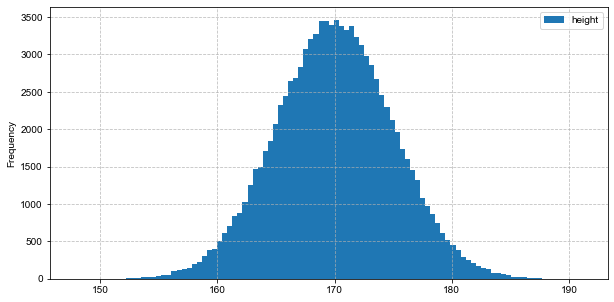
从图中可以直观地看出,大多人身高集中在170左右。
箱形图 box
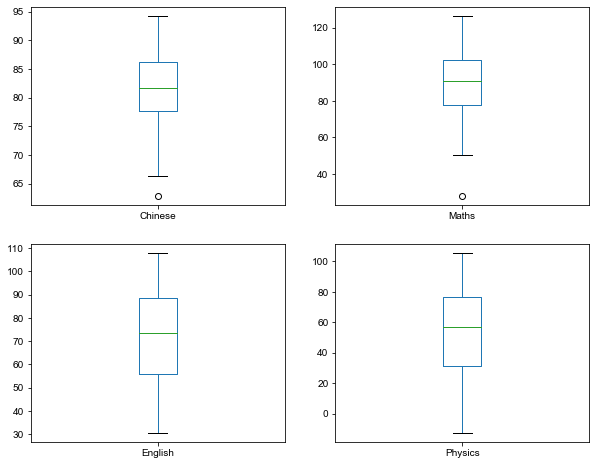
箱形图多用于数值统计,它不需要占据过多的画布空间,空间利用率高,非常适用于比较多组数据的分布情况。通过箱形图,可以很快知道一些关键的统计值,如最大值、最小值、中位数、上下四分位数等等。
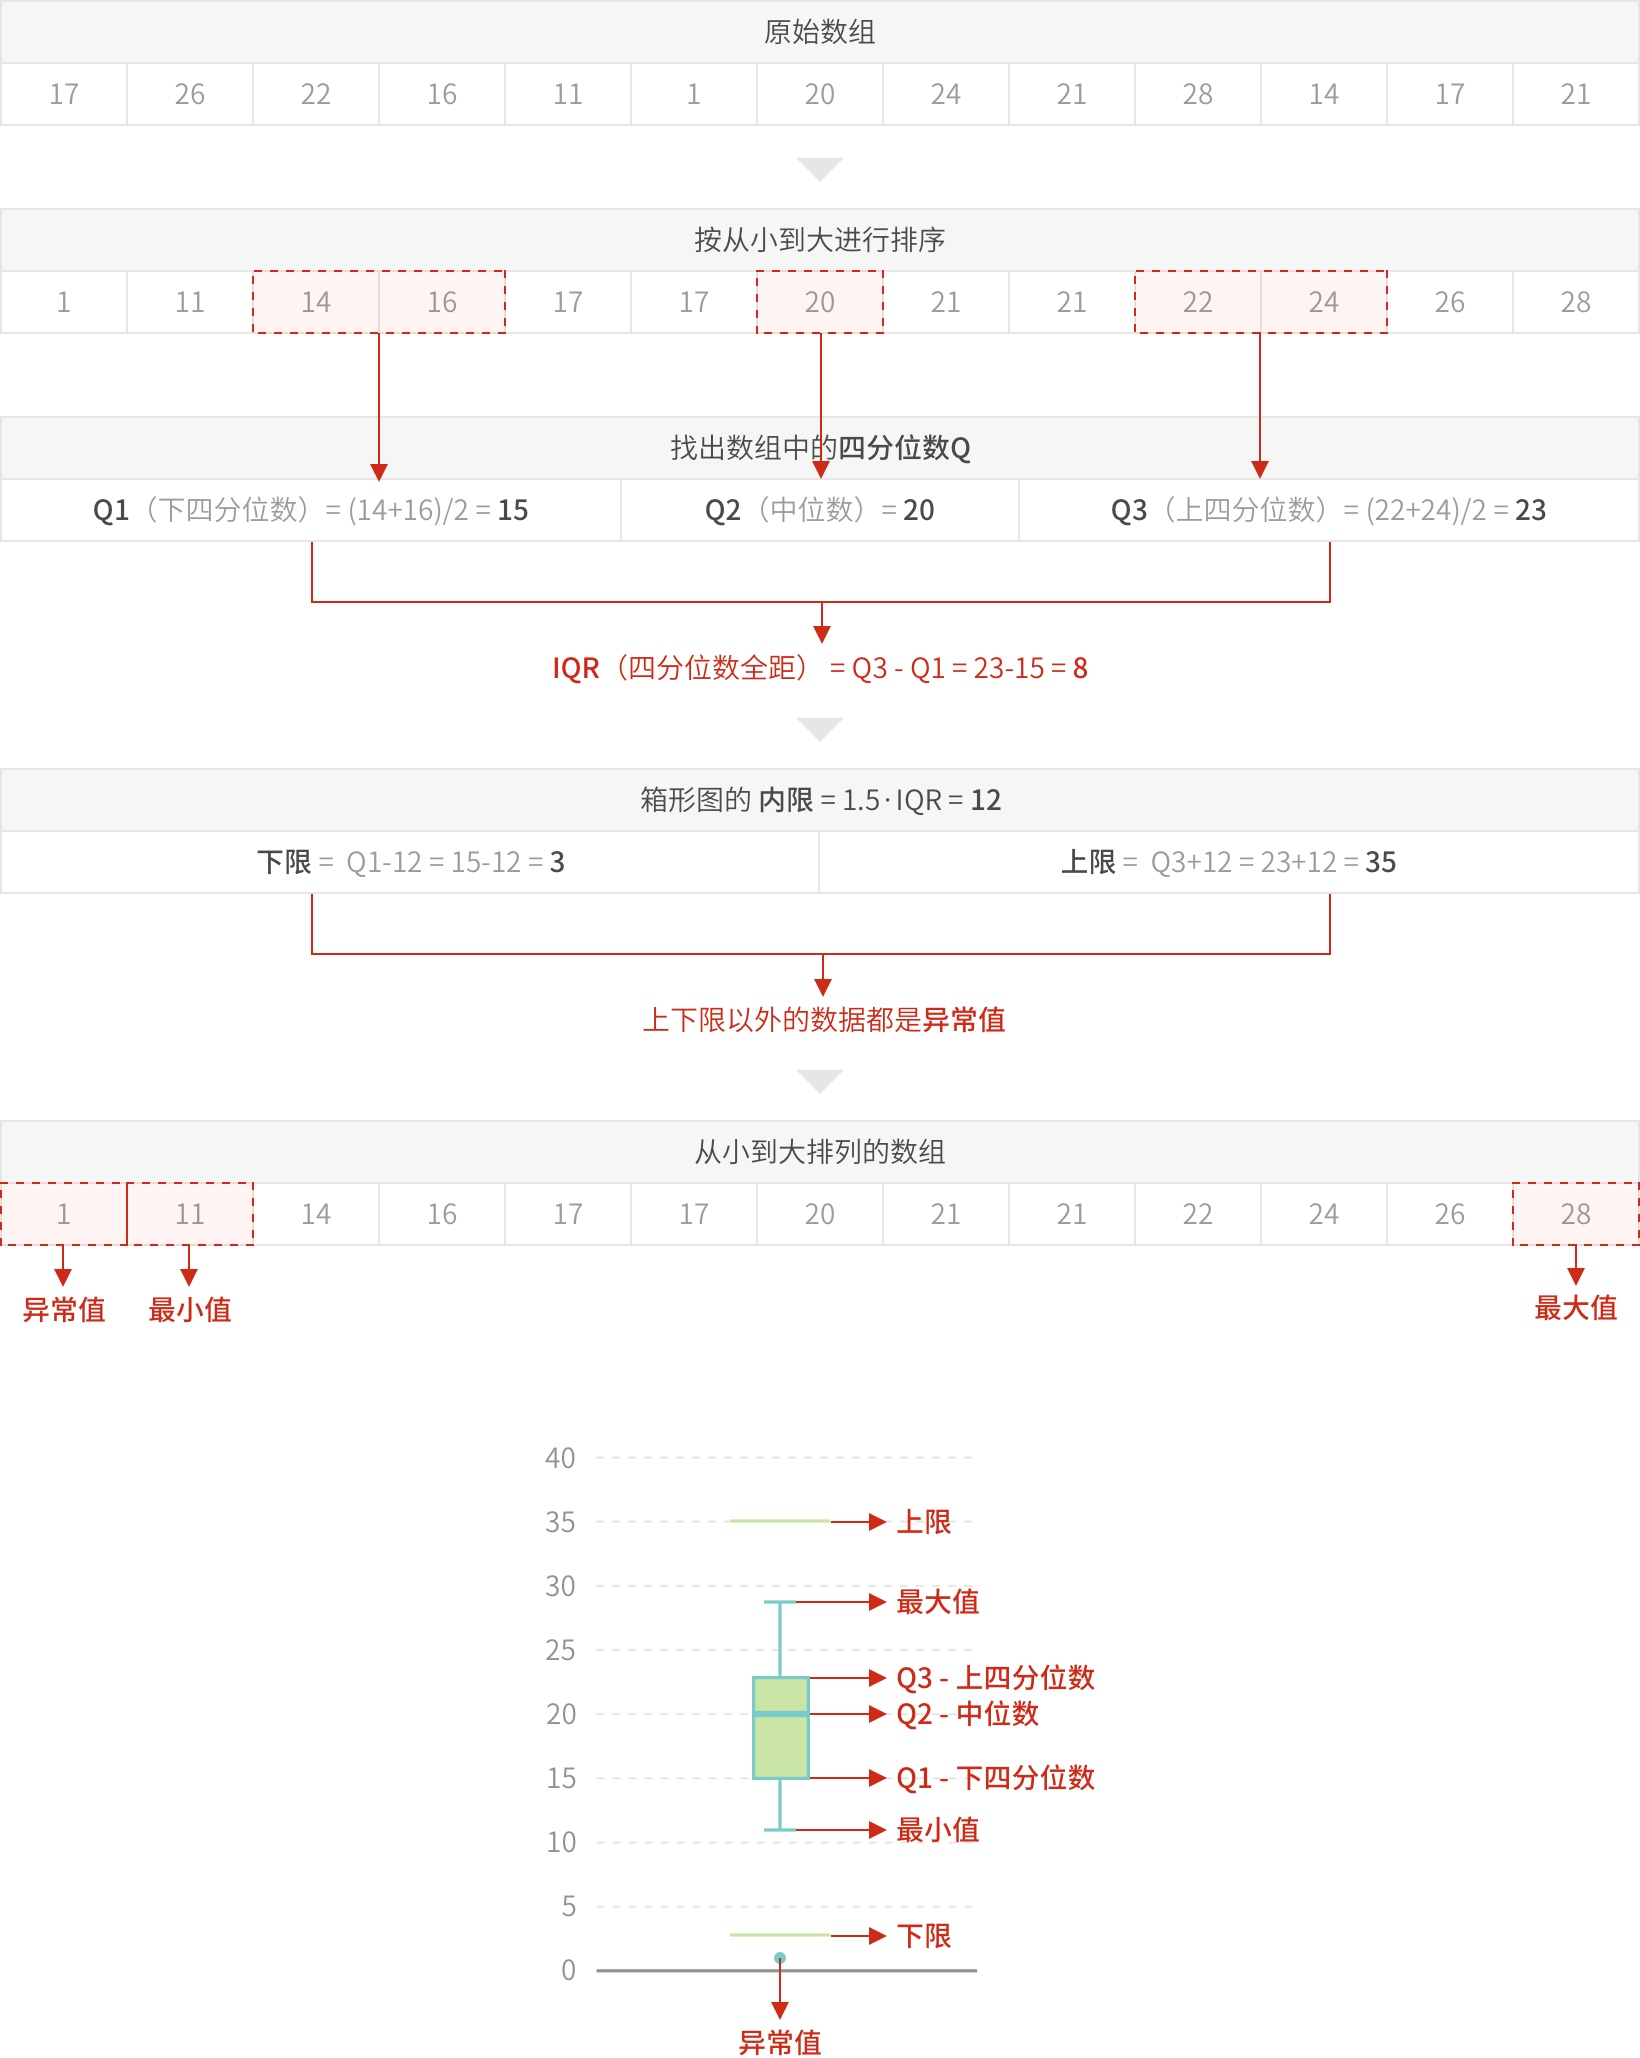
某班级30个学生在期末考试中,语文、数学、英语、物理、化学5门课的成绩数据如下:
count = 30

chinese_score = np.random.normal(80, 10, count)

maths_score = np.random.normal(85, 20, count)

english_score = np.random.normal(70, 25, count)

physics_score = np.random.normal(65, 30, count)

chemistry_score = np.random.normal(75, 5, count)

scores = pd.DataFrame({'Chinese': chinese_score, 'Maths': maths_score, 'English': english_score,

                       'Physics': physics_score, 'Chemistry': chemistry_score})

scores.head(5)
.dataframe tbody tr th:only-of-type { vertical-align: middle }
.dataframe tbody tr th { vertical-align: top }
.dataframe thead th { text-align: right }
| Chinese | Maths | English | Physics | Chemistry | |
|---|---|---|---|---|---|
| 0 | 81.985202 | 77.139479 | 78.881483 | 98.688823 | 75.849040 |
| 1 | 71.597557 | 69.960533 | 98.784664 | 72.140422 | 73.179419 |
| 2 | 80.581071 | 75.501743 | 99.491803 | 18.579709 | 67.963091 |
| 3 | 82.396994 | 113.018430 | 83.224544 | 38.406359 | 75.713590 |
| 4 | 83.153492 | 103.378598 | 59.399535 | 78.381277 | 77.020693 |
绘制箱形图如下:
scores.plot(kind='box', figsize=(10, 6))

plt.grid(True, linestyle='--', alpha=1)

plt.show()
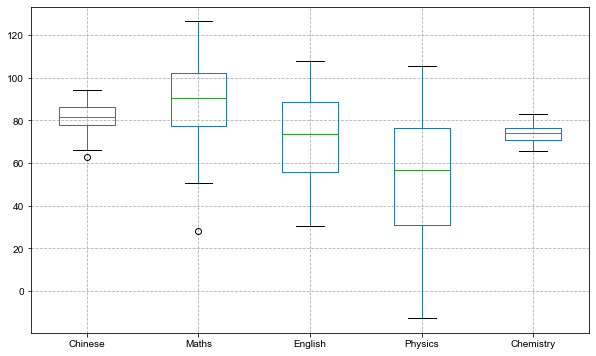
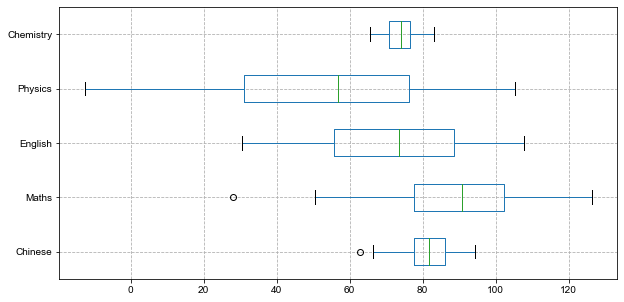
添加参数vert=False将箱形图横向展示:
scores.plot(kind='box', vert=False, figsize=(10, 5))

plt.grid(True, linestyle='--', alpha=1)

plt.show()
添加参数subplots=True,可以形成多个子图:
scores.plot(kind='box', y=['Chinese', 'Maths', 'English', 'Physics'],

            subplots=True, layout=(2, 2), figsize=(10, 8))

plt.show()
面积图 area
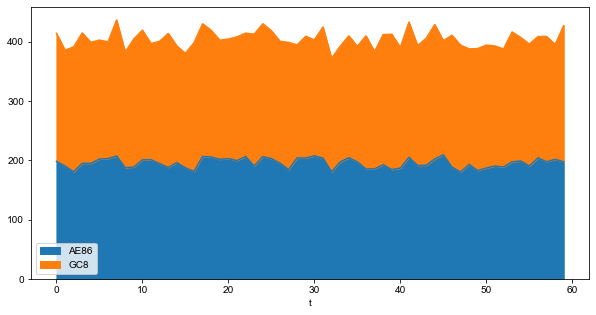
面积图,或称区域图,是一种随有序变量的变化,反映数值变化的统计图表,原理与折线图相似。而面积图的特点在于,折线与自变量坐标轴之间的区域,会由颜色或者纹理填充。
适用场景:
在连续自变量下,一组或多组数据的趋势变化以及相互之间的对比,同时也能够观察到数据总量的变化趋势。
例如,位移 = 速度 x 时间:即s=v*t; 那么x 轴是时间 t,y 轴是每个时刻的速度 v,使用面积图,不仅可以观察速度随时间变化的趋势,还可以根据面积大小来感受位移距离的长度变化。
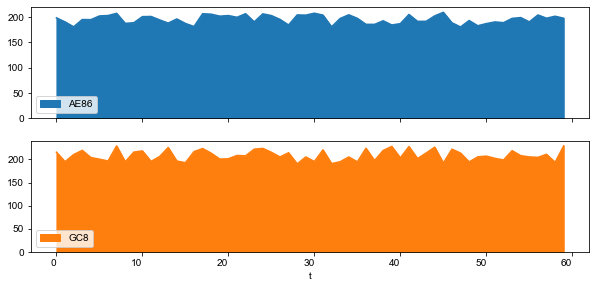
秋名山某段直线赛道上,AE86与GC8在60秒时间内的车速与时间的变化数据如下:
t = list(range(60))

v_AE86 = np.random.uniform(180, 210, len(t))

v_GC8 = np.random.uniform(190, 230, len(t))

v = pd.DataFrame({'t': t, 'AE86': v_AE86, 'GC8': v_GC8})

v.head(5)
.dataframe tbody tr th:only-of-type { vertical-align: middle }
.dataframe tbody tr th { vertical-align: top }
.dataframe thead th { text-align: right }
| t | AE86 | GC8 | |
|---|---|---|---|
| 0 | 0 | 198.183060 | 215.830409 |
| 1 | 1 | 190.186453 | 195.316343 |
| 2 | 2 | 180.464073 | 210.641824 |
| 3 | 3 | 194.842767 | 219.794681 |
| 4 | 4 | 194.620050 | 204.215492 |
面积图默认情况下是堆叠的。
v.plot(kind='area', x='t', y=['AE86', 'GC8'], figsize=(10, 5))

plt.show()
要生成未堆积的图,可以传入参数stacked=False:
v.plot(kind='area', x='t', y=['AE86', 'GC8'],

       stacked=False, figsize=(10, 5), alpha=0.4)

plt.show()
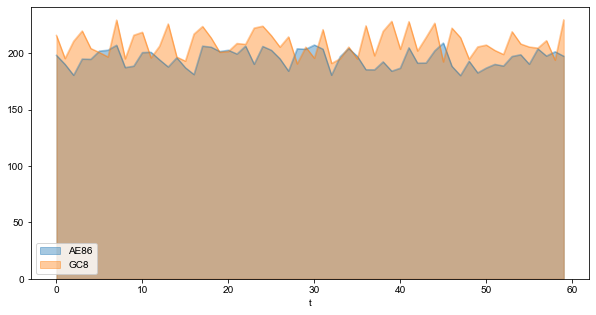
从图形与x轴围成的面积看,很显然该60秒内,GC8是略领先AE86的。温馨提示,文明驾驶,切勿飙车!
同样,添加参数subplots=True,可以形成多个子图,如下:
v.plot(kind='area', x='t', y=['AE86', 'GC8'],

       subplots=True, figsize=(10, 5), rot=0)

plt.show()
总结
本文是快速上手pandas的上篇,先介绍了为什么选用pandas,接下来介绍pandas的常用数据结构Series、DataFrame以及一系列的操作与运算,然后尝试了用pandas来读写文件,最后重点介绍了如何使用pandas快速便捷地可视化数据。
在快速上手pandas的下篇中,会涉及如何用pandas来进行数据清洗、数据合并、分组聚合、数据透视、文本处理等,敬请期待。
快速上手pandas(上)的更多相关文章
- 快速上手pandas(下)
和上文一样,先导入后面会频繁使用到的模块: In [1]: import numpy as np import pandas as pd import matplotlib.pyplot as p ...
- 【转】Webpack 快速上手(上)
嫌啰嗦想直接看最终的配置请戳这里 webpack-workbench (https://github.com/onlymisaky/webpack-workbench) 由于文章篇幅较长,为了更好的阅 ...
- Pandas快速上手(一):基本操作
本文包含一些 Pandas 的基本操作,旨在快速上手 Pandas 的基本操作. 读者最好有 NumPy 的基础,如果你还不熟悉 NumPy,建议您阅读NumPy基本操作快速熟悉. Pandas 数据 ...
- 用Docker在一台笔记本电脑上搭建一个具有10个节点7种角色的Hadoop集群(上)-快速上手Docker
如果想在一台电脑上搭建一个多节点的Hadoop集群,传统的方式是使用多个虚拟机.但这种方式占用的资源比较多,一台笔记本能同时运行的虚拟机的数量是很有限的.这个时候我们可以使用Docker.Docker ...
- 【opencv入门篇】 10个程序快速上手opencv【上】
导言:本系列博客目的在于能够在vs快速上手opencv,理论知识涉及较少,大家有兴趣可以查阅其他博客深入了解相关的理论知识,本博客后续也会对图像方向的理论进一步分析,敬请期待:) PS:官方文档永远是 ...
- 三分钟快速上手TensorFlow 2.0 (上)——前置基础、模型建立与可视化
本文学习笔记参照来源:https://tf.wiki/zh/basic/basic.html 学习笔记类似提纲,具体细节参照上文链接 一些前置的基础 随机数 tf.random uniform(sha ...
- 【Python五篇慢慢弹】快速上手学python
快速上手学python 作者:白宁超 2016年10月4日19:59:39 摘要:python语言俨然不算新技术,七八年前甚至更早已有很多人研习,只是没有现在流行罢了.之所以当下如此盛行,我想肯定是多 ...
- [译]:Xamarin.Android开发入门——Hello,Android Multiscreen快速上手
原文链接:Hello, Android Multiscreen Quickstart. 译文链接:Hello,Android Multiscreen快速上手 本部分介绍利用Xamarin.Androi ...
- [译]:Xamarin.Android开发入门——Hello,Android快速上手
返回索引目录 原文链接:Hello, Android_Quickstart. 译文链接:Xamarin.Android开发入门--Hello,Android快速上手 本部分介绍利用Xamarin开发A ...
随机推荐
- 死磕Spring之AOP篇 - Spring 事务详解
该系列文章是本人在学习 Spring 的过程中总结下来的,里面涉及到相关源码,可能对读者不太友好,请结合我的源码注释 Spring 源码分析 GitHub 地址 进行阅读. Spring 版本:5.1 ...
- QFNU 10-16 training
7-9.小字辈 思路:建立一个类,并且类中存有其父节点,其地位,其儿子节点(因为儿子节点有很多,所以要用vector进行存储),通过-1这个祖先节点进行查找.首先找到-1这个祖先节点,并且读入其他位置 ...
- [BUAA2021软工助教]个人阅读作业#2小结
作业链接 见个人阅读作业#2 优秀作业推荐 Shaun_Yao ✍️ 道法之间--软工第2次博客作业 Potassium ✍️ 构之有道,建之有法--软工个人阅读作业#2 MarkDay ✍️ < ...
- OO随笔之纠结的第二单元——多线程电梯
综述 主要任务就是写一个电梯模拟器,读入每一个人的请求然后让电梯把他们送到想去的地方. 从第一次到第三次作业,三次的主要任务都是相同的,但是每次都增加了很多的细节,每次的难度都逐步增长,电梯复杂度和瞎 ...
- SQLFlow数据流分析工具的job功能介绍
SQLFlow是一款专业的数据血缘关系分析工具,在大型数据仓库中,完整的数据血缘关系可以用来进行数据溯源.表和字段变更的影响分析.数据合规性的证明.数据质量的检查等. 一.SQLFlow 是怎样工作的 ...
- [bug] powerdesigner 设置id 自增 Properties中没有identity
参考 https://blog.csdn.net/qq_37924509/article/details/105215719
- 使用LUKS加密你的磁盘
计算机数据的安全,保密性在现在的生活中显得越来越重要.随着数字化的时代的来临,越来越多的数据被数字化,特别是更多有关于我们隐私的数据在不断生成,甚至还有我们需要离线保存的密钥等.而且通常我们使用磁盘, ...
- 测usb读写
dd if=/dev/sda of=/dev/null bs=1M count=1000每次测完 清一下 memory cacheecho 3 > /proc/sys/vm/drop_cache ...
- linux 服务开机自启动systemd方式 (Centos7)
linux 服务开机自启动systemd方式 (Centos7) 1.编写一个 /opt/hello.sh 脚本 [root@jws-ftp prometheus]# cat /opt/hello.s ...
- linux 创建网桥
由于最近项目需验证个问题,需求是要创建一个虚拟机网桥,在使用ifconfig命令查看时让docker0网桥不在第一个显示,因此,我们创建一个虚拟网桥让它排在第一位置 项目使用Centos7系统,因此使 ...
