prometheus自定义监控指标——实战
上一节介绍了pushgateway的作用、优劣以及部署使用,本机通过几个实例来重温一下自定义监控指标是如何使用的。
一、监控容器启动时间(shell)
使用prometheus已经两个月了,但从未找到容器运行时间的指标(有一个类似的指标是容器创建时间)。学会自定义监控指标后,第一个实例就应该来搞定它。
前提条件是,部署好pushagateway!
在被监控机器上(linux),创建以下脚本
#!/bin/bash

allname=`docker ps --format "{{.Names}}"`              #获取所有运行的容器名称

function dockerruntime(){

    t=`docker inspect -f '{{.State.StartedAt}}' $1`          #获取各个容器的启动时间

    t1=`date +%s -d "$t"`                                    #将时间转成时间戳

    t2=`date +%s`                                            #获取当前时间的时间戳

    let tt=t2-t1                                             #计算运行时间

    echo $tt

}

sudo rm -f a

echo """# TYPE docker_runtime gauge

# HELP docker_runtime time sec""" >> a                       #将往pushgateway上传的数据写入a文件

for i in ${allname}

do

    t=`dockerruntime $i`

    echo "docker_runtime{name=\"$i\"} $t" >> a               #格式化写入数据  不能使用单引号  会屏蔽$i的

done

curl --data-binary "@a" http://pushgatewayIP:9091/metrics/job/docker_runtime/instance/xa-lsr-billubuntu       #修改地址和参数名向特定的url上传数据 数在a文件中

sudo rm -f a    #清空临时文件
给该脚本加执行权限,执行后,登陆pushgateway的webUI
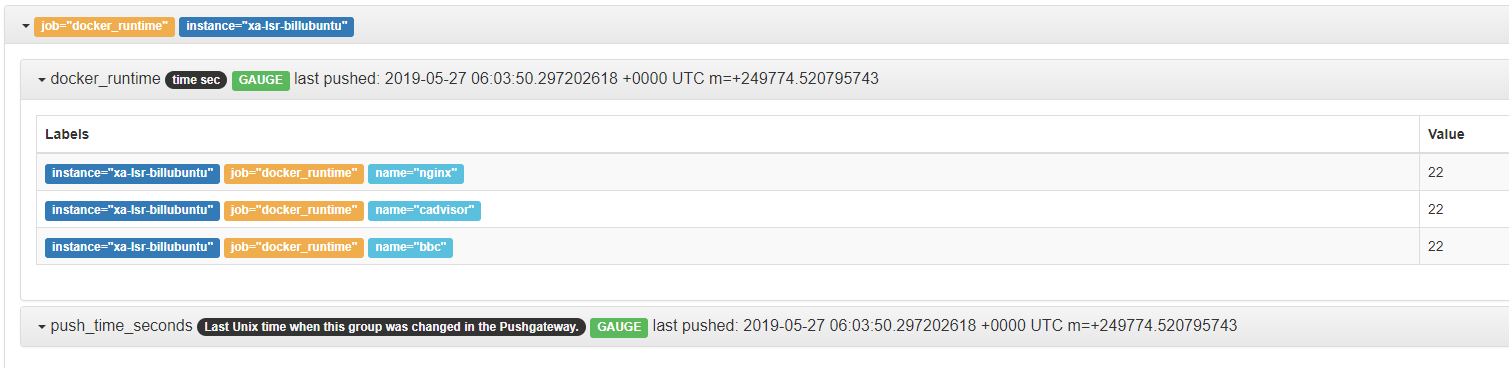
可以看到被监控机器给pushgateway,PUSH了数据,意思是在被监控机器上搜索到了三个容器,每个job的名称叫“docker_runtime”
将该脚本加入周期性计划任务中,每分钟执行一次,若对时间有要求,可以将上述脚本稍加修改,每15s或30s执行一次。
此时在prometheus中的query的查询框中输入“docker_runtime”便可获取上述数据。
【注意】
注意上传数据的类型
如果上传的数据类型是 UNTYPE 那么 prometheus将无法识别,导致整个pushgateway数据无法接受!因此需要格外关注发送的数据格式。
数据类型只有四种 counter gauge summary histogram
二、python向pushgateway发送数据
安装prometheus客户端
pip install prometheus_client
1、counter类型
#counter是可增长的,重启时候会被置成0,用于任务个数,只增不减
#使用flask构建一个建议的网页
     import prometheus_client

	from prometheus_client import Counter

	from prometheus_client.core import CollectorRegistry

	from flask import Response, Flask

	app = Flask(__name__)

	requests_total = Counter("request_count", "Total request cout of the host")

	@app.route("/metrics")

	def requests_count():

	    requests_total.inc()

	    # requests_total.inc(2)	每一次刷新会增加2

	    return Response(prometheus_client.generate_latest(requests_total),

	                    mimetype="text/plain")

	@app.route('/')

	def index():

	    requests_total.inc()

	    return "Hello World"

	if __name__ == "__main__":

	    app.run(host="0.0.0.0")
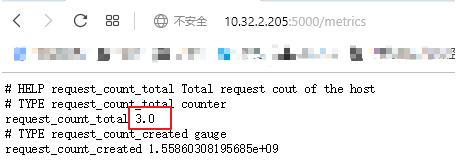
结果:
2、gauage类型
	import prometheus_client

	from prometheus_client import Counter,Gauge

	from prometheus_client.core import CollectorRegistry

	from flask import Response, Flask

	app = Flask(__name__)

	g = Gauge("random_value", "Random value of the request")

	@app.route("/metrics")

	def s():

	    with open("a.txt",'r') as f:

	        num=f.read()

	    g.set(num)

	    return Response(prometheus_client.generate_latest(g),

	                    mimetype="text/plain")

	@app.route('/')

	def index():

	    requests_total.inc()

	    return "Hello World"

	if __name__ == "__main__":

    app.run(host="0.0.0.0")
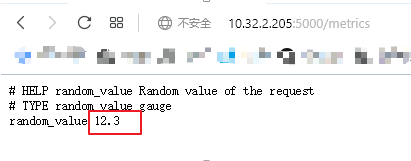
结果:
以上作用是在本地生成一个小型网站,下一步是将选定的数据发送到pushgateway
#在被监控机上写python代码
#CollectorRegistry可以同时注册多个自定义指标并返回给prometheus importprometheus_client
fromprometheus_clientimportGauge
fromprometheus_client.coreimportCollectorRegistry
importrequests defv1(): #获取监控数据的值
return2.3 defv2():
return3.60 n1=v1()
n2=v2() REGISTRY=CollectorRegistry(auto_describe=False)
#自定义指标必须利用CollectorRegistry进行注册,注册后返回给prometheus
#CollectorRegistry必须提供register,一个指标收集器可以注册多个collectoryregistry jin=Gauge("jin_kou","zhegezuoyongshijinkoudaxiao",["l1",'l2','instance'],registry=REGISTRY)
chu=Gauge("chu_kou","zhegezuoyongshichukoudaxiao",["l1",'l2','instance'],registry=REGISTRY)
#“jin_kou” 指标名称
# "zhegezuoyongshichukoudaxiao" 指标的注释信息
# "[]" 定义标签的类别及个数 jin.labels(l1="label1",l2="label2",instance="windows1").inc(n1)
chu.labels(l1="label1",l2="label2",instance="windows1").inc(n2)
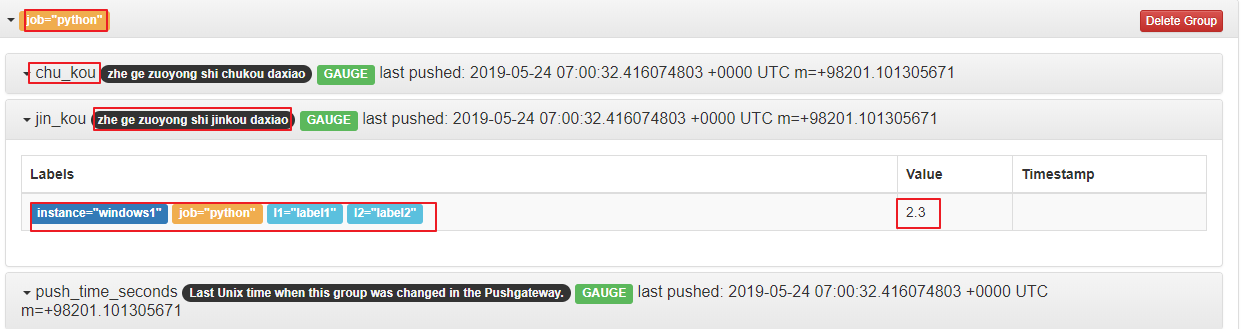
#“[]”中有几个,就需要写几个个数要完全一致 requests.post("http://pushgatewayIP:9091/metrics/job/python/",data=prometheus_client.generate_latest(REGISTRY))
#向指定的API发送post信息,将注册的信息发过去
#API中的 “python”是 job的名字
结果:
prometheus自定义监控指标——实战的更多相关文章
- prometheus自定义监控指标——入门
grafana结合prometheus提供了大量的模板,虽然这些模板几乎监控到了常见的监控指标,但是有些特殊的指标还是没能提供(也可能是我没找到指标名称).受zabbix的影响,自然而然想到了自定义监 ...
- Prometheus自定义监控内容
Prometheus自定义监控内容 一.io.micrometer的使用 1.1 Counter 1.2 Gauge 1.3 Timer 1.4 Summary 二.扩展 相关内容原文地址: 博客园: ...
- Prometheus自定义监控告警项-3
prometheus 编写告警规则 将自定义的告警规则写到独立的文件中,prometheus.yml中引用如下: rule_files: - "rules/*.yml" [root ...
- .NetCore下使用Prometheus实现系统监控和警报 (六)进阶Grafana集成自定义收集指标
Prometheus中包含了很多收集指标,那么我们怎来在Grafana中来使用呢? 接下来我们还是以之前自定义的来演示如图:我们在Prometheus中已经可以看到这个之前我们自定义的类型了 关于Gr ...
- Spring cloud微服务安全实战-7-6自定义metrics监控指标(1)
自己写代码来定义一个metrics,然后让prmetheus收走,在grafana里面定义一个panel并展示出来. prometheus的四种metrics指标.虽然所有的metrics都是数字,但 ...
- 实战 Prometheus 搭建监控系统
实战 Prometheus 搭建监控系统 Prometheus 是一款基于时序数据库的开源监控告警系统,说起 Prometheus 则不得不提 SoundCloud,这是一个在线音乐分享的平台,类似于 ...
- Prometheus Operator自定义监控项
Prometheus Operator默认的监控指标并不能完全满足实际的监控需求,这时候就需要我们自己根据业务添加自定义监控.添加一个自定义监控的步骤如下: 1.创建一个ServiceMonitor对 ...
- Spring Boot 揭秘与实战(九) 应用监控篇 - 自定义监控端点
文章目录 1. 继承 AbstractEndpoint 抽象类 2. 创建端点配置类 3. 运行 4. 源代码 Spring Boot 提供的端点不能满足我们的业务需求时,我们可以自定义一个端点. 本 ...
- Docker下实战zabbix三部曲之三:自定义监控项
通过上一章<Docker下实战zabbix三部曲之二:监控其他机器>的实战,我们了解了对机器的监控是通过在机器上安装zabbix agent来完成的,zabbix agent连接上zabb ...
随机推荐
- Jackson 序列化/反序列化时忽略某属性
https://www.iteye.com/blog/wwwcomy-2397340 博客分类: Spring jacksonread_onlyjsonignore 基于Spring MVC的RES ...
- ionic 股票列表 网络读取数据,实现下拉刷新,上拉加载
html: <ion-header> <ion-toolbar> <ion-title> 股票 </ion-title> </ion-toolba ...
- css权重等级
1.问题起因(在一次偶然编写css发现的,.div2 p>.div1 p>.p1,然后做了测试并找查相关资料) 2.解决方案 首先看哪一级的权重高 1.!important,加在样式属性值 ...
- SpringBoot 打包成war
1.修改pom.xml文件 <packaging>war</packaging> <properties> <project.build.sourceEnco ...
- cocos2d-js中jsc逆向为js攻略
笔记: 主要发现有两个工具 存档记录一下 https://github.com/OEDx/cocos-jsc-endecryptor python的 解密需要秘钥 推荐这个: https://git ...
- android Gradle下载慢,使用阿里镜像
在Project下的 build.gradle添加阿里镜像 buildscript { repositories { maven{ url 'http://maven.aliyun.com/nexus ...
- Solr缓存原理分析及配置优化
一.缓存原理 缓存,带来急速性能体验! Solr提供了一系列的内置缓存来优化查询性能.Solr的缓存原理主要涉及以下4个方面: 1.缓存大小及缓存置换法 从缓存大小的角度来看,不能将缓存设置的太大,否 ...
- 利用selenium和ffmpeg爬取m3u8 ts视频《进击的巨人》
需求 想看下动漫<进击的巨人>,发现到处被和谐,找不到资源,但是在一个视频网站找到了在线播放,https://www.55cc.cc/dongman/17890/player-2-1.ht ...
- ETL中获取公共时间参数变量释义
- win10自带截屏操作
1.win+shift+S,自由截屏 2.win+W,截屏后编辑 3.alt+PrtSc,截取当前活动界面,鼠标在微信就是微信,在浏览器就是浏览器.在桌面就是所有界面. 4.PrtScn,截取所有屏幕 ...