Prometheus 后续杂记
在后续prometheus的使用中遇到的一些问题我会在此记录
搭建初期几个问题
rule.yml中对每条告警加上主机名?
要在告警通知中加上故障机器主机名不能从prometheus的采集监控项数据中的主机名入手,需要prometheus添加主机名target,即instance="hostname:port",而不是instance="ip:port"。主机名的解析可在/etc/hosts添加或自行搭建dns服务器。在告警中引用instance变量,即实现此需求。
如何实现告警通知人分组,再在配置文件中引用组名?
只能在alertmanager配置中加。除非自己写webhook。
对prometheus的数值保留两位小数?
可以通过函数保留整数,ceil()将样本值向上保留一位整数。
报警模板
在alermanager.yml 中可以带入告警信息的模板文件
默认模板
https://github.com/prometheus/alertmanager/blob/master/template/default.tmpl
自定义模板
模板1:
{{ define "wechat.default.message" }}{{ if gt (len .Alerts.Firing) 0 -}}{{ range .Alerts }}Alerts Firing:{{ .Labels.severity }} / {{ .Labels.instance }} / {{ .Annotations.summary }} / {{ .StartsAt.Format "2006-01-02 15:04:05" }}{{- end }}{{- end }}{{ if gt (len .Alerts.Resolved) 0 -}}{{ range .Alerts }}Alerts Resolved:{{ .Labels.severity }} / {{ .Labels.instance }} / [ {{ .Annotations.summary }} ]Restored / {{ .StartsAt.Format "2006-01-02 15:04:05" }}{{- end }}{{- end }}{{- end }}
模板2:
以下是我企业微信告警的模板配置(极度简化):
{{ define "wechat.default.message" }}{{ if gt (len .Alerts.Firing) 0 -}}{{ range .Alerts }}
warning: {{ .Labels.hostname }} {{ .Labels.instance }} {{ .Annotations.summary }} {{- end }}{{- end }}{{ if gt (len
.Alerts.Resolved) 0 -}}{{ range .Alerts }}
Resolved: {{ .Labels.hostname }} {{ .Labels.instance }} {{ .Annotations.summary }} {{- end }}{{- end }}{{- end }}
告警实例:
warning: centos_CcbDbS_d3378 10.0.0.80 /data 91%
模板3:
{{ define "wechat.default.message" }}
{{ range .Alerts }}
start==
告警程序:prometheus_alert
告警级别:{{ .Labels.severity }}
告警类型:{{ .Labels.alertname }}
故障主机: {{ .Labels.instance }}
告警主题: {{ .Annotations.summary }}
告警详情: {{ .Annotations.description }}
触发时间: {{ .StartsAt.Format "2006-01-02 15:04:05" }}
end==
{{ end }}
{{ end }}
promql 函数
使用increase 计算累计监控项1h内的增量,监控取值都为整数,为什么increase处理后有小数?
increase() 函数获取区间向量中的第一个和最后一个样本并返回其增长量, 它会在单调性发生变化时(如由于采样目标重启引起的计数器复位)自动中断。由于这个值被外推到指定的整个时间范围,所以即使样本值都是整数,你仍然可能会得到一个非整数值。也就是它会根据第一个与最后一个样本的增长量与两个取样点时间长度而估算出函数中所设定的时间长度对应的增长量。
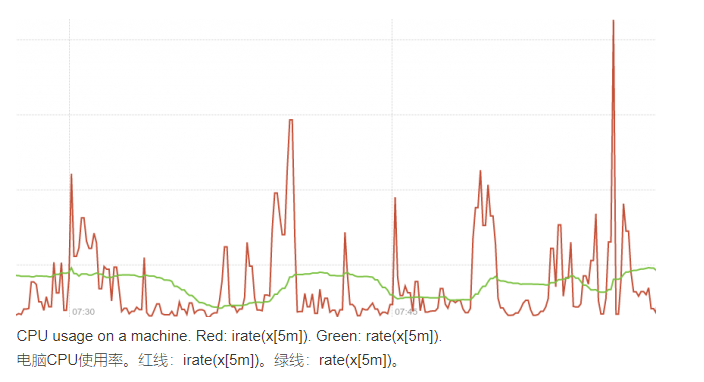
rate与irate区别
取自:https://www.zhukun.net/archives/8301
rate() 函数计算某个时间序列范围内的每秒平均增长率,基于设定范围内的第一个和最后一个数据点来计算每秒比率(允许计数器重置),(last值-first值)/时间差。自适应单调性中断(比如target重启导致的计数器重置),计算结果是推算到每个时间范围的最后而得出, 允许漏抓和抓取周期与时间范围的不完美结合,rate应该只和计数器一起使用。最适合告警和缓慢计数器的绘图,数据曲线较缓和。irate() 函数计算一段时间范围内某个时刻的每秒增长率,它只观测设定的范围内的最后两个点,并计算每秒的速率,(last值-last前一个值)/时间戳差值. 自适应单调性中断(比如target重启导致的计数器重置).irate应该只和快速的, 不稳定的计数器一起使用。irate绘图更精准。如果irate只需要最近两个点的数据,那为什么我们要传比这两个点长得多的时间范围呢?答案是,你想要限制这两点的取值范围,因为你不希望使用几个小时前的数据。还有另外一个好处,在面板(dashboards)选择比率范围(rate range)时,不需要考虑所有可能的拉取间隔(scrape intervals)。因为那样做通常会导致计算的时间比需要的长得多。如果拉取动作(scrape)变得更频繁,图像会自动提高分辨率。
alertmanager.yml中route分组告警走向
这个地方比较坑,你以为同一个告警信息匹配到的每个receiver都会发消息,其实,并不是!!!告警会自动从上级路由走到下级路由,下级路由会覆盖上级路由的设置,同级路由加上continue: true 才会继续往之后的同级路由匹配,并给所有匹配到的同级路由的receiver发信息。
举个栗子哟:
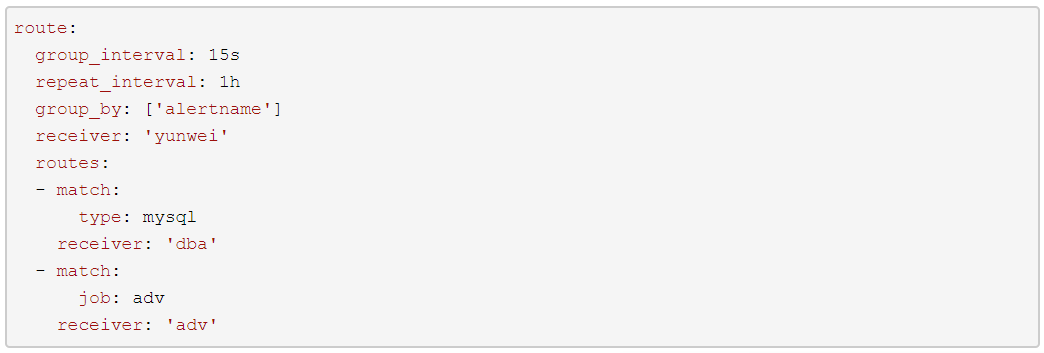
以上有三个receiver,以下有三台主机,他们的告警信息该发给谁?:
主机1(广告项目的mysql机子)标签 type: mysql job: adv;
主机2(广告项目代理机子)标签 type: ngx job: adv;
主机3 (其他项目的代理机子) 标签 type: ngx job: other
分析:
主机1:发给dba,下级路由匹配到标签type: mysql,虽然还有一个job: adv同级路由能匹配,但是同级路由匹配到一个之后不会自动匹配下一个;
主机2:发给adv;
主机3:发给yunwei,下级路由不能匹配到,故不会覆盖主路由的receiver。
以下配置发送主机1告警给三个receiver :
route:group_interval: 15srepeat_interval: 1hgroup_by: ['alertname']receiver: 'yunwei'routes:- match: #这三行表示:match下不写标签,就是match所有标签,即所有报警信息都发给yunwei组continue: true #continue 匹配到此规则的告警能继续同级routes匹配,并对同级中匹配到的所有receiver发送告警receiver: 'yunwei'- match:type: mysqlcontinue: true ####receiver: 'dba'- match:job: advcontinue: truereceiver: 'adv'
template的引用
参考:https://prometheus.io/docs/alerting/configuration/
在alertmanager中可以做到不同receiver使用不同的模板
模板1
{{ define "wechat_simple.html" }}{{ if gt (len .Alerts.Firing) 0 -}}{{ range .Alerts }}Alerts Firing:{{ .Labels.severity }} / {{ .Labels.hostname }} / {{ .Annotations.summary }} / {{ .StartsAt.Format "2006-01-02 15:04:05" }}{{- end }}{{- end }}{{ if gt (len .Alerts.Resolved) 0 -}}{{ range .Alerts }}Alerts Resolved:{{ .Labels.severity }} / {{ .Labels.hostname }} / [ {{ .Annotations.summary }} ]Restored / {{ .StartsAt.Format "2006-01-02 15:04:05" }}{{- end }}{{- end }}{{- end }}
模板2
{{ define "wechat_detail.html" }}{{ if gt (len .Alerts.Firing) 0 -}}Alerts Firing:{{ range .Alerts }}告警级别:{{ .Labels.severity }}告警类型:{{ .Labels.alertname }}Alert: {{ .Labels.test }}故障主机: {{ .Labels.instance }}告警主题: {{ .Annotations.summary }}告警详情: {{ .Annotations.description }}触发时间: {{ .StartsAt.Format "2006-01-02 15:04:05" }}{{- end }}{{- end }}{{ if gt (len .Alerts.Resolved) 0 -}}Alerts Resolved:{{ range .Alerts }}告警级别:{{ .Labels.severity }}告警类型:{{ .Labels.alertname }}故障主机: {{ .Labels.instance }}告警主题: {{ .Annotations.summary }}触发时间: {{ .StartsAt.Format "2006-01-02 15:04:05" }}恢复时间: {{ .EndsAt.Format "2006-01-02 15:04:05" }}{{- end }}{{- end }}告警链接:{{ template "__alertmanagerURL" . }}{{- end }}
alertmanager.yml 配置
global:resolve_timeout: 1mtemplates:- '/usr/local/alertmanager/template/*.tmpl' #此处需要将以上两个模板文件引用进来route:group_interval: 15srepeat_interval: 1mgroup_by: ['alertname']receiver: 'wechat1'routes:- receiver: 'wechat2'match:for: 'test'receivers:- name: 'wechat1'wechat_configs:- corp_id: 'wx8659xxxxxx'send_resolved: truemessage: '{{ template "wechat_simple.html" . }}' #此参数可引用模板文件to_user: 'jor|Ya'agent_id: '10000xx'api_secret: '3igxxxxxxxxOg'- name: 'wechat2'wechat_configs:- corp_id: 'wxxxxxxx06e'send_resolved: truemessage: '{{ template "wechat_detail.html" . }}'# to_party: 'jorney'to_user: 'joy|Yn'agent_id: '1000xxx'api_secret: '3igMMxxxxxxxx'
windows安装exporter
https://github.com/martinlindhe/wmi_exporter/releases/download/v0.3.3/wmi_exporter-0.3.3-amd64.msi
双击安装,应该是会自动开机启动(不确定),端口 9182
获取数据:ip:9182/metrics
内存使用率
今天我看到一个计算prometheus内存使用率的表达式是这样:
(1-((node_memory_Buffers_bytes+node_memory_Cached_bytes+node_memory_MemFree_bytes)/node_memory_MemTotal_bytes))*100
用命令行查看某机器的内存使用情况
[root@one nginx]# free -mtotal used free shared buff/cache availableMem: 3530 1801 58 354 1670 1179
神奇的事情发生了:buff/cache 大于available,一般来说 available=free + buff/cache
一查资料发现有这么一句:如果free内存不够用,,系统会回收buff和cache内存。但是因为内核的buff和cache不能回收,所以available <= free + buff/cache,用avaiblable算出的使用率会大于几项相加之和的使用率。
所以内存使用率用available来计算是不是更准确呢?
(1-((node_memory_MemAvailable_bytes)/node_memory_MemTotal_bytes))*100
新发现的问题:
node_memory_MemAvailable_bytes指标centos7有,centos6没有,所以第一种表达式对两个系统都适用,但是两种算法的值会有出入。
blackbox_exporter 监控url 状态返回码为0
使用blackbox_exporter 监控url,curl -i $url 返回码为302,但是收集的监控项值为0.
因为没有加重定向相关配置“no_follow_redirects: true”,默认是false。

Prometheus 后续杂记的更多相关文章
- 如何用Prometheus监控十万container的Kubernetes集群
概述 不久前,我们在文章<如何扩展单个Prometheus实现近万Kubernetes集群监控?>中详细介绍了TKE团队大规模Kubernetes联邦监控系统Kvass的演进过程,其中介绍 ...
- prometheus + grafana + node_exporter + alertmanager 的安装部署与邮件报警 (一)
大家一定要先看详细的理论教程,再开始搭建,这样报错后才容易找到突破口 参考文档 https://www.cnblogs.com/afterdawn/p/9020129.html https://www ...
- TiKV 源码解析系列文章(三)Prometheus(上)
本文为 TiKV 源码解析系列的第三篇,继续为大家介绍 TiKV 依赖的周边库 rust-prometheus,本篇主要介绍基础知识以及最基本的几个指标的内部工作机制,下篇会介绍一些高级功能的实现原理 ...
- C/C++杂记:深入虚表结构
1. 虚表与“虚函数表” 在“C/C++杂记:虚函数的实现的基本原理”一文中曾提到“虚函数表”的概念,只是为了便于理解,事实是:虚函数表并不真的独立存在,它只是虚表(virtual table)中的一 ...
- Prometheus监控学习笔记之Prometheus存储
0x00 概述 Prometheus之于kubernetes(监控领域),如kubernetes之于容器编排.随着heapster不再开发和维护以及influxdb 集群方案不再开源,heapster ...
- Prometheus监控学习笔记之全面学习Prometheus
0x00 概述 Prometheus是继Kubernetes后第2个正式加入CNCF基金会的项目,容器和云原生领域事实的监控标准解决方案.在这次分享将从Prometheus的基础说起,学习和了解Pro ...
- [转帖]Prometheus+Grafana监控Kubernetes
原博客的位置: https://blog.csdn.net/shenhonglei1234/article/details/80503353 感谢原作者 这里记录一下自己试验过程中遇到的问题: . 自 ...
- 【转载】C/C++杂记:深入虚表结构
原文:C/C++杂记:深入虚表结构 1. 虚表与“虚函数表” 在“C/C++杂记:虚函数的实现的基本原理”一文中曾提到“虚函数表”的概念,只是为了便于理解,事实是:虚函数表并不真的独立存在,它只是虚表 ...
- Prometheus TSDB分析
Prometheus TSDB分析 概述 Prometheus是著名开源监控项目,其监控任务调度给具体的服务器,该服务器到目标上抓取监控数据,然后保存在本地的TSDB中.自定义强大的PromQL语言查 ...
随机推荐
- Elasticsearch-搜索并获取数据
Elasticsearch-搜索并获取数据 在group中搜索elasticsearch curl -XGET "localhost:9200/get-together/group/_sea ...
- mysql查看锁查看
关键词:mysql锁争用,mysql锁查看 --------------------- 作者:边城cn 来源:CSDN 原文:https://blog.csdn.net/miyatang/articl ...
- Failure to transfer org.apache.maven.plugins:maven-resources-plugin:pom:2.6 的解决办法
eclipse导入mavn工程报Failure to transfer org.apache.maven.plugins:maven-resources-plugin:pom:2.6 的解决办法: 错 ...
- 一个php文件就可以把数据库的数据导出Excel表格
数据库内容太多,复制粘贴太麻烦?那就用代码实现把,把代码写好了,导出还不容易吗,访问即可导出. excel.php <?php error_reporting(E_ALL ^ E_DEPRECA ...
- UEditor之斜线表头表格的定制
效果图: 图1: 图2:
- Jade学习(一)之特性、安装
前言 流行的模板 PHP:Smarty SimpleTemplate Xtemplate Savant Java:Velocity FreeMarker Jbyte C#:Dotiquid Sharp ...
- js的小练习
<!DOCTYPE html> <html> <head> <meta charset="utf-8"> <title> ...
- PDF转图片,在线PDF转JPG/PNG
[在线DEMO](https://oktools.net/pdf2img) 原理 使用pdf.js预览图片,pdf.js将pdf通过canvas将每一页渲染出来,然后我们通过canvas的toData ...
- Laravel 中 Controller访问Model函数/常量
<?php // User.php class User extends Model { ; //进行中 const USER_TYPE_TEST = 'test'; //测试用户 // 需要在 ...
- jmeter之HTTP信息管理器、正则表达式联合使用(获取登录session
如图所示,信息管理头的信息为请求头信息,如图所示 注意事项:1)body date里面的参数要是要注意英文编写条件下,可以通过https://www.json.cn/在线的json格式刷格式 2)注意 ...