Kubernetes 1.26.0 集群部署Prometheus监控
前言
该存储库收集 Kubernetes 清单、Grafana仪表板和Prometheus 规则,结合文档和脚本,使用Prometheus Operator提供易于操作的端到端 Kubernetes 集群监控。
这个项目的内容是用jsonnet写的。
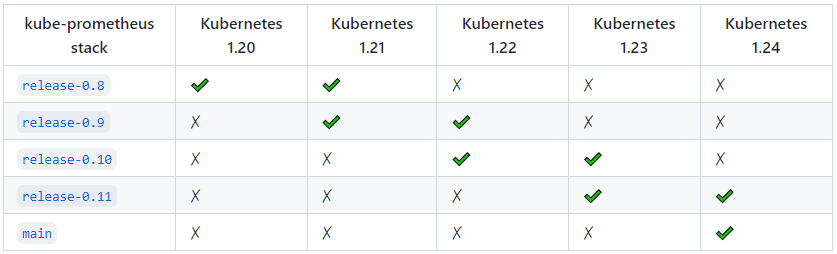
兼容性
支持以下 Kubernetes 版本并在我们在各自分支中针对这些版本进行测试时正常工作。但请注意,其他版本可能有效!
这个项目的内容是用jsonnet写的。这个项目既可以被描述为一个包,也可以被描述为一个库。
此包中包含的组件:
- The Prometheus Operator
- Highly available Prometheus
- Highly available Alertmanager
- Prometheus node-exporter
- Prometheus Adapter for Kubernetes Metrics APIs
- kube-state-metrics
- Grafana
这个堆栈用于集群监控,因此它被预先配置为从所有 Kubernetes 组件收集指标。除此之外,它还提供一组默认的仪表板和警报规则。许多有用的仪表板和警报来自kubernetes-mixin 项目,与该项目类似,它提供可组合的 jsonnet 作为库,供用户根据自己的需要进行定制。
先决条件
您将需要一个 Kubernetes 集群,仅此而已!默认情况下,假定 kubelet 使用令牌身份验证和授权,否则 Prometheus 需要一个客户端证书,这使它可以完全访问 kubelet,而不仅仅是指标。令牌认证和授权允许更细粒度和更容易的访问控制。
这意味着 kubelet 配置必须包含这些标志:
--authentication-token-webhook=true此标志启用ServiceAccount令牌可用于对 kubelet 进行身份验证。这也可以通过将 kubelet 配置值设置为 来authentication.webhook.enabled启用true。--authorization-mode=Webhook此标志使 kubelet 将使用 API 执行 RBAC 请求,以确定是否允许请求实体(在本例中为 Prometheus)访问资源,特别是该项目的/metrics端点。这也可以通过将 kubelet 配置值设置为 来authorization.mode启用Webhook。
该堆栈通过部署Prometheus Adapter提供资源指标。此适配器是一个扩展 API 服务器,Kubernetes 需要启用此功能,否则适配器没有效果,但仍会部署。
一、首先部署k8s集群
参考地址:https://www.cnblogs.com/yangzp/p/16911078.html
- [root@master ~]# kubectl get node
- NAME STATUS ROLES AGE VERSION
- master Ready control-plane 21h v1.26.0
- node1 Ready <none> 21h v1.26.0
- node2 Ready <none> 21h v1.26.0
二、下载kube-Prometheus文件
官网地址:https://github.com/prometheus-operator/kube-prometheus/tags
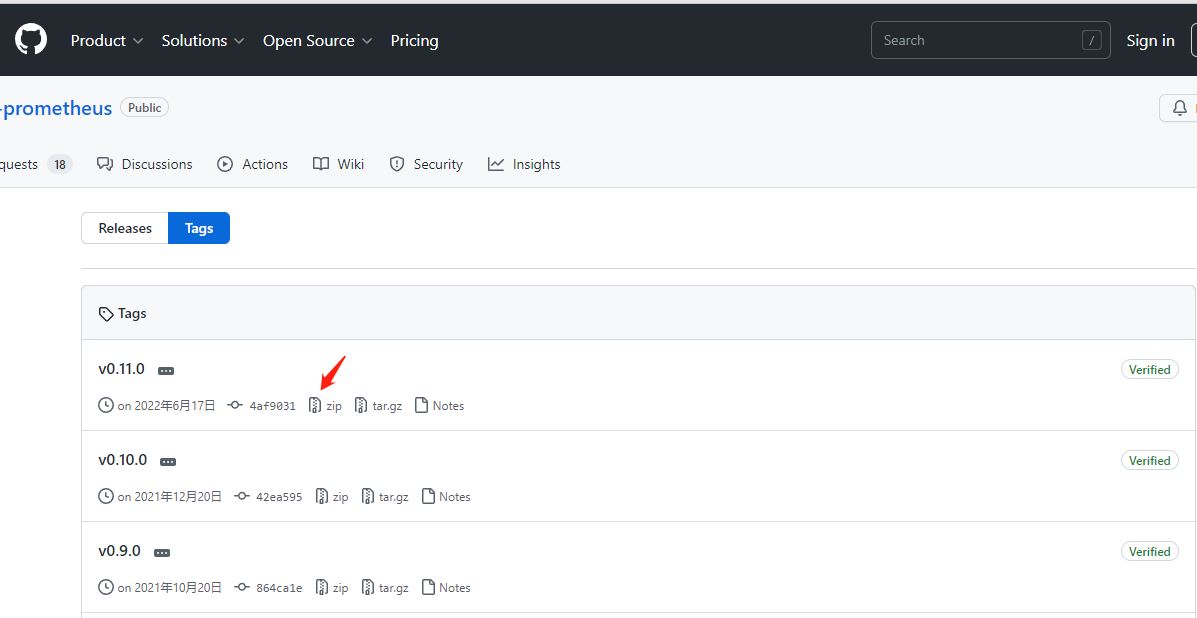
下载:
- wget https://github.com/prometheus-operator/kube-prometheus/archive/refs/tags/v0.11.0.zip
解压:
- unzip v0.11.0.zip
三、安装
- kubectl create -f manifests/setup
待定前面的容器启动后执行
- kubectl create -f manifests/
注:等待所有容器启动成功后,即可访问!
安装过程中可能会有个别镜像下载失败的情况,可以使用以下方法单独下载:
- 1、查看pod状态
- kubectl describe pod {podname} -n monitoring(名称空间)
- 2、在dockerhub上面搜索需要下载的镜像到指定服务器,网址:https://hub.docker.com/
- 3、修改镜像tag
- 格式:docker image tag 源镜像:tag 目标镜像:tag
次此出现:
- docker pull v5cn/prometheus-adapter:v0.9.1
- docker image tag v5cn/prometheus-adapter:v0.9.1 k8s.gcr.io/prometheus-adapter/prometheus-adapter:v0.9.1
- docker pull landv1001/kube-state-metrics:v2.5.0
- docker image tag landv1001/kube-state-metrics:v2.5.0 k8s.gcr.io/kube-state-metrics/kube-state-metrics:v2.5.0
四、访问
- 端口转发grafana:
- nohup kubectl --address 0.0.0.0 --namespace monitoring port-forward svc/grafana 3000 > nohupcmd.out 2>&1 &
查看所有pod状态:
- [root@master ~]# kubectl get pod -A -owide
- NAMESPACE NAME READY STATUS RESTARTS AGE IP NODE NOMINATED NODE READINESS GATES
- calico-apiserver calico-apiserver-5c555fdcd5-9vh74 1/1 Running 1 (98s ago) 22h 10.244.219.68 master <none> <none>
- calico-apiserver calico-apiserver-5c555fdcd5-n8tsb 1/1 Running 12 (5m41s ago) 100m 10.244.166.148 node1 <none> <none>
- calico-system calico-kube-controllers-8cd47c9d7-n2vb4 1/1 Running 1 (98s ago) 107m 10.244.219.70 master <none> <none>
- calico-system calico-node-8xm5f 1/1 Running 31 (5m38s ago) 22h 192.168.1.156 node1 <none> <none>
- calico-system calico-node-hcqvd 1/1 Running 1 (98s ago) 22h 192.168.1.155 master <none> <none>
- calico-system calico-node-n2qbs 1/1 Running 17 (97m ago) 22h 192.168.1.157 node2 <none> <none>
- calico-system calico-typha-6b47dbb5c8-6b86d 1/1 Running 15 (97m ago) 22h 192.168.1.157 node2 <none> <none>
- calico-system calico-typha-6b47dbb5c8-cwwx6 1/1 Running 27 (5m39s ago) 22h 192.168.1.156 node1 <none> <none>
- kube-system coredns-5bbd96d687-rg486 1/1 Running 1 (98s ago) 107m 10.244.219.69 master <none> <none>
- kube-system coredns-5bbd96d687-tf9dm 1/1 Running 3 (17m ago) 100m 10.244.166.147 node1 <none> <none>
- kube-system etcd-master 1/1 Running 1 (98s ago) 22h 192.168.1.155 master <none> <none>
- kube-system kube-apiserver-master 1/1 Running 1 (98s ago) 22h 192.168.1.155 master <none> <none>
- kube-system kube-controller-manager-master 1/1 Running 1 (98s ago) 22h 192.168.1.155 master <none> <none>
- kube-system kube-proxy-8qqg5 1/1 Running 0 22h 192.168.1.156 node1 <none> <none>
- kube-system kube-proxy-9qpck 1/1 Running 0 22h 192.168.1.157 node2 <none> <none>
- kube-system kube-proxy-zjpwx 1/1 Running 1 (98s ago) 22h 192.168.1.155 master <none> <none>
- kube-system kube-scheduler-master 1/1 Running 1 (98s ago) 22h 192.168.1.155 master <none> <none>
- monitoring alertmanager-main-0 2/2 Running 0 97m 10.244.104.24 node2 <none> <none>
- monitoring alertmanager-main-1 2/2 Running 1 (43m ago) 102m 10.244.166.141 node1 <none> <none>
- monitoring alertmanager-main-2 2/2 Running 0 97m 10.244.104.25 node2 <none> <none>
- monitoring blackbox-exporter-78b4bfdf67-kssjd 3/3 Running 0 100m 10.244.166.145 node1 <none> <none>
- monitoring grafana-86c9f7b457-g9c4n 1/1 Running 0 100m 10.244.166.143 node1 <none> <none>
- monitoring kube-state-metrics-f4d87bdfb-gx6ms 3/3 Running 0 100m 10.244.166.146 node1 <none> <none>
- monitoring node-exporter-8fgqt 2/2 Running 0 4h30m 192.168.1.157 node2 <none> <none>
- monitoring node-exporter-kcx59 2/2 Running 0 4h30m 192.168.1.156 node1 <none> <none>
- monitoring node-exporter-nqnhn 2/2 Running 2 (98s ago) 4h30m 192.168.1.155 master <none> <none>
- monitoring prometheus-adapter-8694794d86-8bfsk 1/1 Running 13 (5m38s ago) 107m 10.244.166.140 node1 <none> <none>
- monitoring prometheus-adapter-8694794d86-x4grw 1/1 Running 0 100m 10.244.104.26 node2 <none> <none>
- monitoring prometheus-k8s-0 2/2 Running 9 (5m42s ago) 102m 10.244.166.142 node1 <none> <none>
- monitoring prometheus-k8s-1 2/2 Running 0 96m 10.244.104.27 node2 <none> <none>
- monitoring prometheus-operator-867dbbcfd9-mkmdp 2/2 Running 0 100m 10.244.166.144 node1 <none> <none>
- tigera-operator tigera-operator-7795f5d79b-nrrjg 1/1 Running 28 (109s ago) 22h 192.168.1.156 node1 <none> <none>
浏览器访问:
http://master主机IP:3000
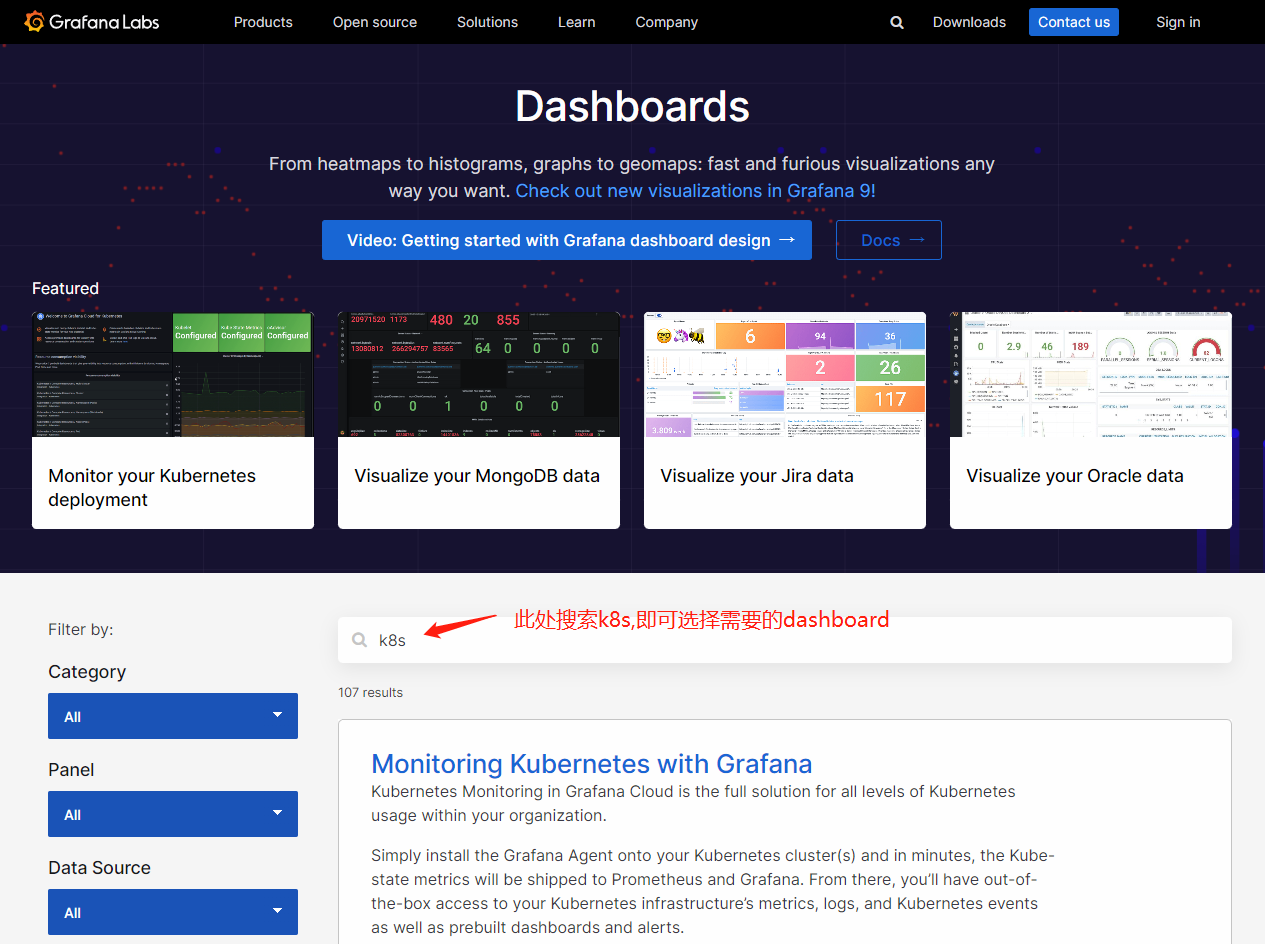
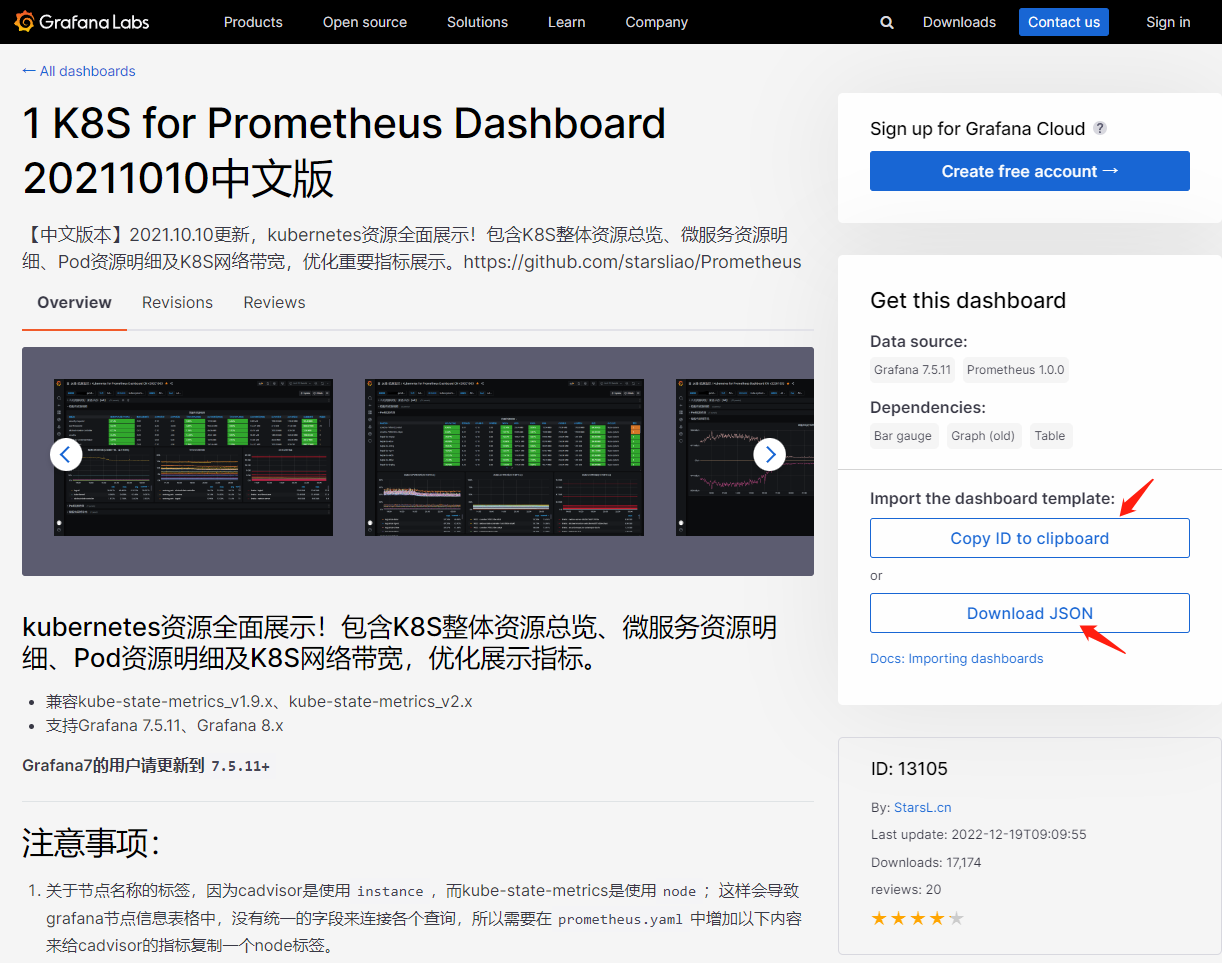
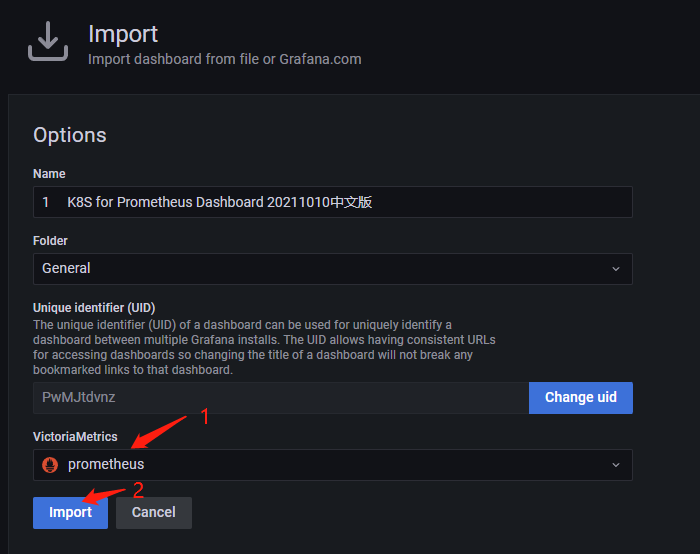
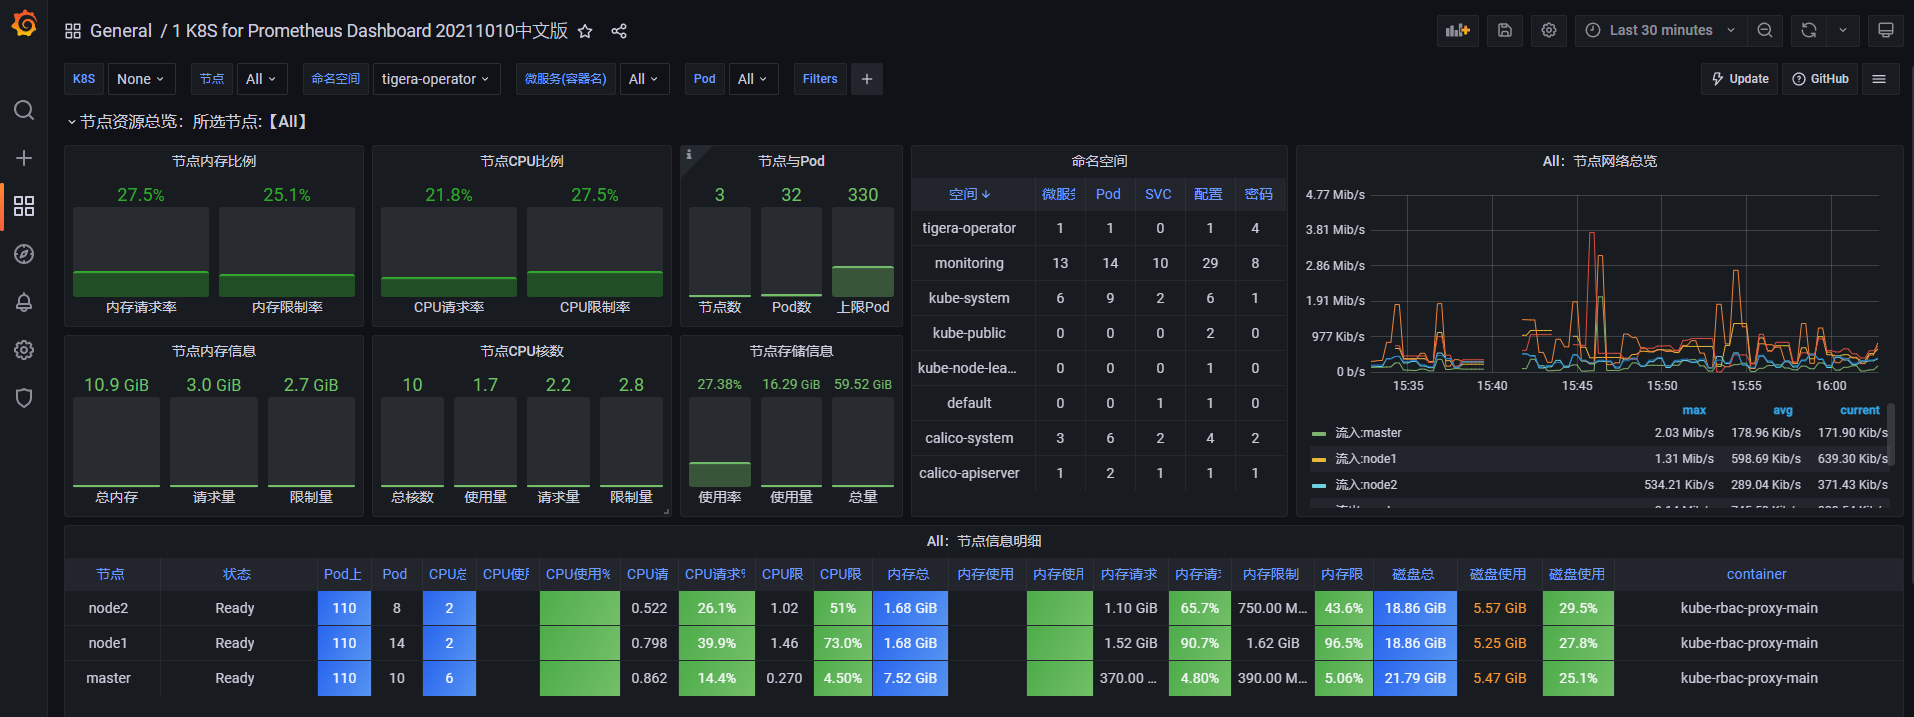
4.1 导入Prometheus Dashboard
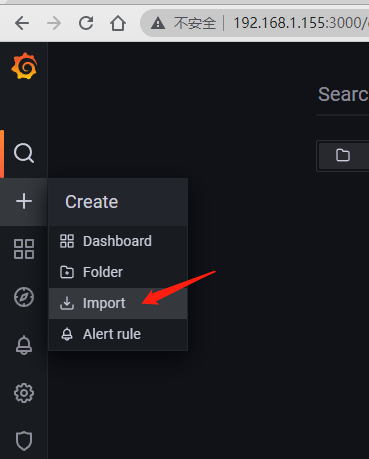
grafana访问地址:https://grafana.com/grafana/dashboards/
五、卸载
- kubectl delete --ignore-not-found=true -f manifests/ -f manifests/setup
Kubernetes 1.26.0 集群部署Prometheus监控的更多相关文章
- 基于k8s集群部署prometheus监控ingress nginx
目录 基于k8s集群部署prometheus监控ingress nginx 1.背景和环境概述 2.修改prometheus配置 3.检查是否生效 4.配置grafana图形 基于k8s集群部署pro ...
- 基于k8s集群部署prometheus监控etcd
目录 基于k8s集群部署prometheus监控etcd 1.背景和环境概述 2.修改prometheus配置 3.检查是否生效 4.配置grafana图形 基于k8s集群部署prometheus监控 ...
- redis3.0集群部署和测试
redis3.0集群部署和测试 环境介绍 两台Centos7的虚拟机模拟6个节点,A台3个master节点,B台3个slave节点A地址:172.16.81.140B地址:172.16.81.141r ...
- 二进制方式部署Kubernetes 1.6.0集群(开启TLS)
本节内容: Kubernetes简介 环境信息 创建TLS加密通信的证书和密钥 下载和配置 kubectl(kubecontrol) 命令行工具 创建 kubeconfig 文件 创建高可用 etcd ...
- Redis 3.0.0 集群部署
简述: 1.0.1:redis cluster的现状 目前redis支持的cluster特性 1):节点自动发现 2):slave->master 选举,集群容错 3):Hot reshardi ...
- Hadoop 2.6.0 集群部署
Hadoop的集群部署和单节点部署类似,配置文件不同,另外需要修改网络方面的配置 首先,准备3台虚拟机,系统为CentOS 6.6,其中一台为namenode 剩余两台为 datanode: 修改主机 ...
- hadoop 2.2.0 集群部署 坑
注意fs.defaultFS为2..0新的变量,代替旧的:fs.default.name hadoop 2.2.0 集群启动命令:bin/hdfs namenode -formatsbin/start ...
- kubernetes 1.4.5集群部署
2016/11/16 23:39:58 环境: centos7 [fu@centos server]$ uname -a Linux centos 3.10.0-327.el7.x86_64 #1 S ...
- k8s-1.15.0集群部署+dashboard
环境:外网环境硬件master-centos7.4 2核4G node1-centos7.4 2核4Gnode2-centos7.4 2核4G软件:三台服务器 :docker-19. ...
- Kubeadm搭建高可用(k8s)Kubernetes v1.24.0集群
文章转载自:https://i4t.com/5451.html 背景 Kubernetes 1.24新特性 从kubelet中移除dockershim,自1.20版本被弃用之后,dockershim组 ...
随机推荐
- Google Cloud Platform | 使用 Terraform 的分层防火墙策略自动化
[本文由Cloud Ace整理发布,更多内容请访问Cloud Ace 官网] 防火墙规则是 Google Cloud 中网络安全的重要组成部分.Google Cloud 中的防火墙大致可分为两种类型: ...
- SOFAJRaft源码阅读-Netty时间轮算法的实践
SOFAJRaft的定时任务调度器是基于Netty来实现的,所以本文将会基于Netty时间轮算法,然后再结合SOFAJRaft源码进行分析. @Author:Akai-yuan @更新时间:2023/ ...
- 浙江某男子对多端应用开发工具HBuilderX在windows下安装的解说
同学,学uni-app好啊,大致上写一套代码能生成这么多个平台的应用,我简单念一下,它们分别是Android应用.IOS应用.Web应用.微信小程序.支付宝小程序.百度小程序.字节跳动小程序.快应用. ...
- RISC-V 平台移植 RTOS
ARM 上移植实时操作系统大家可能比较熟悉,且例程较多,对于 RISC-V 内核的 MCU,可能相对比较陌生.下面结合 WCH 的 CH32V103 和 CH32V307 两款芯片来详细说下针 ...
- vue3 | isRef、unref、toRef、toRefs
isRef 检查某个值是否是ref.是返回true,否则返回false. const num = ref(10); const num1 = 20; const num2 = reactive({ d ...
- immutable.js学习笔记(八)----- immutable.js对象 和 原生对象的相互转换
一.原生对象转换为immutable.js对象 fromJS 栗子一: 栗子二: 如果数组里面有对象,对象里面有数组,怎么转换呢 复杂结构的转换 二.immutable.js对象转换为原生对象 toJ ...
- SpringBoot 2.x 在Tomcat8上无法运行,报无法访问错误
非法访问:此Web应用程序实例已停止.无法加载[].为了调试以及终止导致非法访问的 这仅是我的一个Filter重写的时候没有重写他的其他两个方法,导致我在Tomcat8上不能运行,但在Tomcat9上 ...
- 【CTO变形记】有序定无序—为什么越努力,越无力
前言:我们用自己构建的认知结构来理解和映射这个世界,通过外界的反馈来调整现有的认知.但面对的现实越来越复杂,以及面对更多的未知且陌生的情况时,我们常常试图去"修整"接受到的信息 ...
- 计算机网络基础09 TCP/IP
https://www.jianshu.com/p/066d99da7cbd 1 概念 TCP/IP[TCP(传输控制协议)和IP(网际协议)]提供点对点的链接机制,将数据应该如何封装.定址.传输.路 ...
- .net core 阿里云接口之获取临时访问凭证
假设您是一个移动App开发者,希望使用阿里云OSS服务来保存App的终端用户数据,并且要保证每个App用户之间的数据隔离.此时,您可以使用STS授权用户直接访问OSS. 使用STS授权用户直接访问OS ...