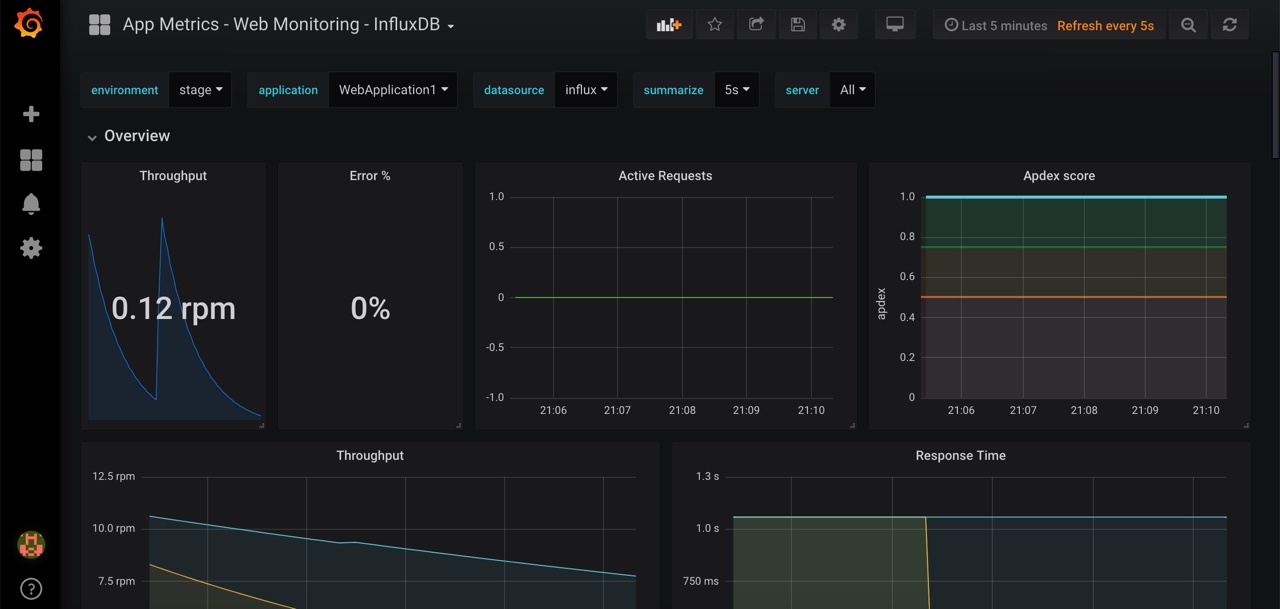
AspNet Core下利用 app-metrics+Grafana + InfluxDB实现高大上的性能监控界面
在日常系统工作中,我们为了洞察系统的问题和运作情况通常会记录日志的方式来进行分析,但是在很多情况下都是被动的在出问题后才会去查日志。在很多时候,我们可能更需要相对实时的了解整个系统或者某一时段的运行的情况,诸如系统出错的频率以及响应时间等等指标。这些动态的准实时信息对于监控整个系统的运行和健康状况非常重要,而本文的主角们能通过很好的配合帮助你实现这个目标,而且是一种高大上的实现方式。想想泡杯茶翘着二郎腿看着偌大的屏幕上有着一堆华丽的仪表和曲线图,即使看不懂也很牛B的样子啊!(谁知道我看得懂看不懂呢,是不是?)
Q: 那什么是App-Metrics?
A: App Metrics是一个开源和跨平台的.NET库,用于记录应用程序中各项指标。可以在.NET Core上运行,也可以在支持.NET 4.5.2的完整.NET框架上运行。
App Metrics对底层数据源做了很好的抽象以支持很多类型的数据库,例如:
InfluxDb、Prometheus、ElasticSearch等等。。
同时他又提供了很多Measurements比如Apdex, Gauges, Counters, Meters, Histograms 等等一大堆
1. 安装Grafana
Q: 什么是Grafana?
A: 一个类似Kibana的可视化数据开源程序,一般配合时间序列数据库进行配合来展示数据
这里为了方便使用docker来运行Grafana
docker run -d --name=grafana -p 3000:3000 grafana/grafana
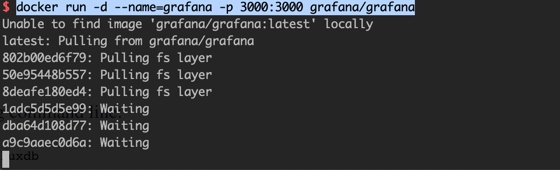 

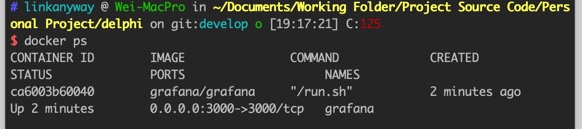
接着我们确认下是否正常运行了
docker ps -a

2. 安装 InfluxDB
InfluxDb是比较流行的时序数据库,可以根据需要替换成Prometheus同上为了方便我们还是使用docker来运行
如果你希望每次都能保持之前docker运行收集的数据可以用docker 的-v选项把目录映射到本机的目录以便持久化数据
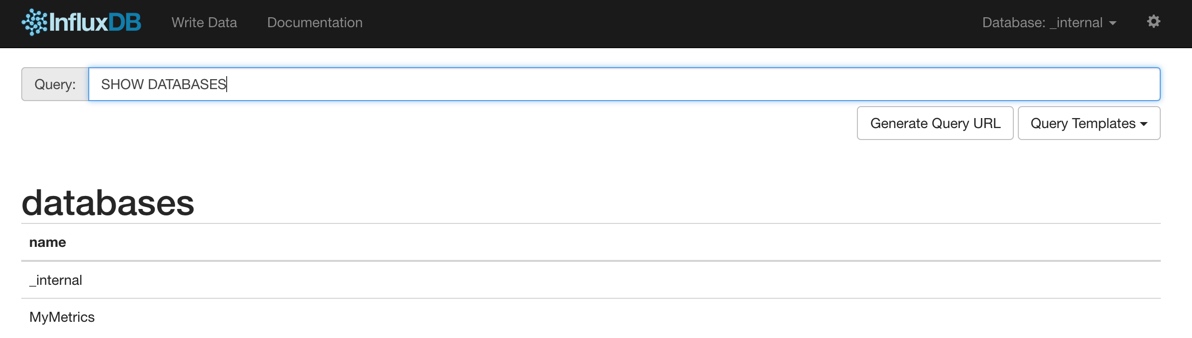
==注意influxdb有2个端口一个是admin一个database==
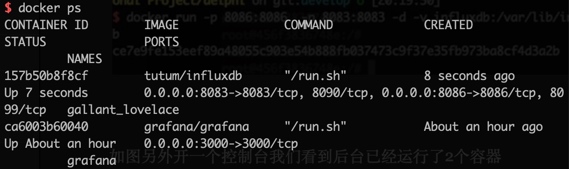
docker run -d -p 8083:8083 -p 8086:8086 --expose 8090 --expose 8099 tutum/influxdb
如图另外开一个控制台我们看到后台已经运行了2个容器

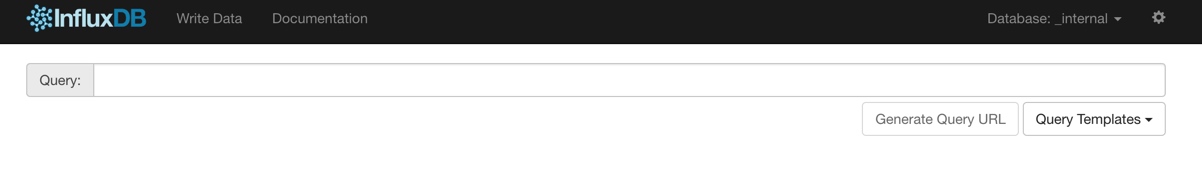
输入http://127.0.0.1:8083/ 访问InfluxDb的控制界面以便创建数据库


3. 配置AspNet Core2.x
先照常新建一个MVC项目
 
安装所需的第三方库
dotnet add package App.Metrics.Extensions.Mvc

dotnet add package App.Metrics.Formatters.Json

dotnet add package App.Metrics.Extensions.Reporting.InfluxDB
控制台显示安装成功!
 
修改Startup.cs
using System;

using System.Collections.Generic;

using System.Linq;

using System.Threading.Tasks;

using App.Metrics.Configuration;

using App.Metrics.Extensions.Reporting.InfluxDB;

using App.Metrics.Extensions.Reporting.InfluxDB.Client;

using App.Metrics.Reporting.Interfaces;

using Microsoft.AspNetCore.Builder;

using Microsoft.AspNetCore.Hosting;

using Microsoft.AspNetCore.Http;

using Microsoft.AspNetCore.HttpsPolicy;

using Microsoft.AspNetCore.Mvc;

using Microsoft.Extensions.Configuration;

using Microsoft.Extensions.DependencyInjection;

namespace WebApplication1

{

    public class Startup

    {

        public Startup(IConfiguration configuration)

        {

            Configuration = configuration;

        }

        public IConfiguration Configuration { get; }

        public void ConfigureServices(IServiceCollection services)

        {

        #region 注册 App-Metrics & 配置输出report到influxdb

            var database = "MyMetrics";

            var uri = new Uri(" http://127.0.0.1:8086 ");  //本地Docker中运行的influx实例,注意InfluxDb有2个端口别搞错

            services.AddMetrics(options =>

                {

                    options.WithGlobalTags((globalTags, info) =>

                    {

                        globalTags.Add("app", info.EntryAssemblyName);

                        globalTags.Add("env", "stage");

                    });

                })

                .AddHealthChecks()

                .AddReporting(

                    factory =>

                    {

                        factory.AddInfluxDb(

                            new InfluxDBReporterSettings

                            {

                                InfluxDbSettings = new InfluxDBSettings(database, uri),

                                ReportInterval = TimeSpan.FromSeconds(5)

                            });

                    })

                .AddMetricsMiddleware(options => options.IgnoredHttpStatusCodes = new[] {404});

        #endregion

            services.Configure<CookiePolicyOptions>(options =>

            {

                options.CheckConsentNeeded = context => true;

                options.MinimumSameSitePolicy = SameSiteMode.None;

            });

            //添加Metric Filter到mvc

            services.AddMvc(options => options.AddMetricsResourceFilter())

                .SetCompatibilityVersion(CompatibilityVersion.Version_2_1);

        }

        // This method gets called by the runtime. Use this method to configure the HTTP request pipeline.

        public void Configure(IApplicationBuilder app, IHostingEnvironment env, ILoggerFactory loggerFactory, IApplicationLifetime lifetime)

        {

            if (env.IsDevelopment())

            {

                app.UseDeveloperExceptionPage();

            }

            else

            {

                app.UseExceptionHandler("/Home/Error");

                app.UseHsts();

            }

            app.UseHttpsRedirection();

            app.UseStaticFiles();

            app.UseCookiePolicy();

           loggerFactory.AddConsole(Configuration.GetSection(" Logging "));

        app.UseMetrics();

        app.UseMetricsReporting(lifetime);

            app.UseMvc(routes =>

            {

                routes.MapRoute(

                    name: "default",

                    template: "{controller=Home}/{action=Index}/{id?}");

            });

        }

    }

}
接下来就是配置豪华的Grafana了!
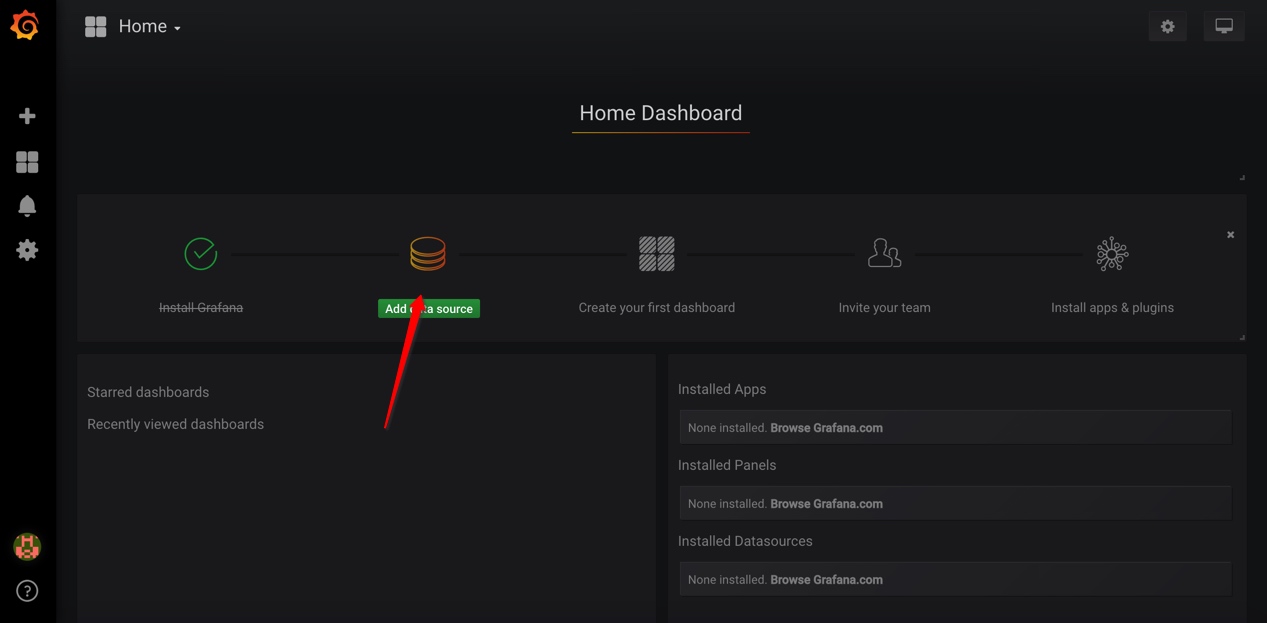
打开浏览器试着访问docker内运行的Grafana容器,默认的用户名和密码是admin/admin 不用担心,第一次登录成功后系统会要求你重新设置新的密码,很贴心!!
 
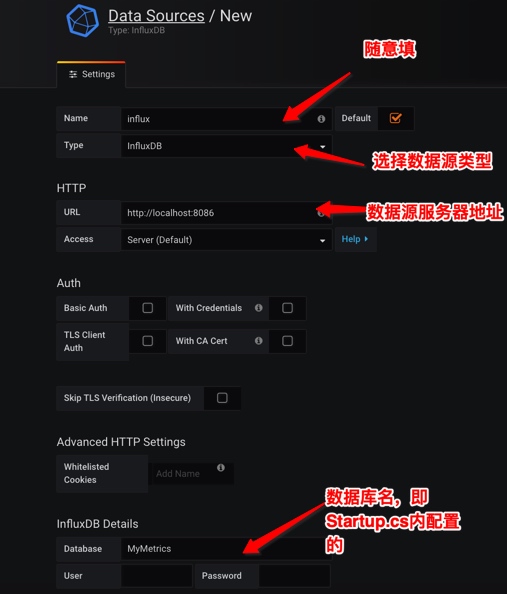
登录成功后,配置Datasource当然是选择我们之前运行的InfluxDb

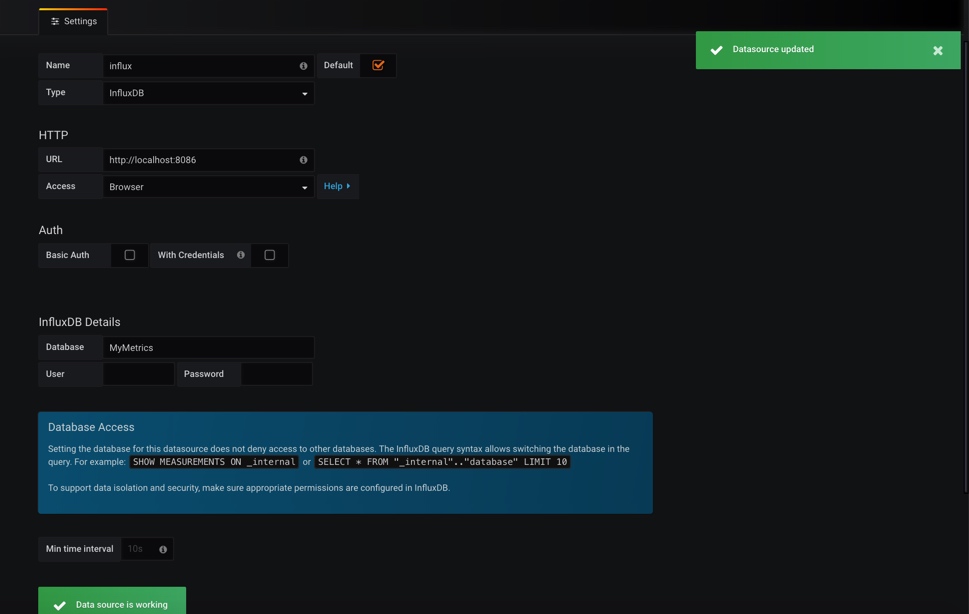
按图进行配置

提交后,如下图显示即配置成功

接着就是创建你的Dashboard,可以自己建立也可以自己配置json文件导入,网上有很多例子可以直接下载
{
"__inputs": [],
"__requires": [
{
"type": "grafana",
"id": "grafana",
"name": "Grafana",
"version": "4.2.0"
},
{
"type": "panel",
"id": "grafana-piechart-panel",
"name": "Pie Chart",
"version": "1.1.4"
},
{
"type": "panel",
"id": "graph",
"name": "Graph",
"version": ""
},
{
"type": "panel",
"id": "singlestat",
"name": "Singlestat",
"version": ""
},
{
"type": "panel",
"id": "table",
"name": "Table",
"version": ""
}
],
"annotations": {
"list": []
},
"description": "Dashboard to visualize metrics captured by App Metrics ASP.NET Core Middleware 1.2.0, tested with App.Metrics.Extensions.Reporting.InfluxDB 1.2.0 - http://app-metrics.io/",
"editable": true,
"gnetId": 2125,
"graphTooltip": 1,
"hideControls": false,
"id": null,
"links": [],
"refresh": "5s",
"rows": [
{
"collapse": true,
"height": "250",
"panels": [
{
"cacheTimeout": null,
"colorBackground": false,
"colorValue": false,
"colors": [
"rgba(245, 54, 54, 0.9)",
"rgba(237, 129, 40, 0.89)",
"rgba(50, 172, 45, 0.97)"
],
"datasource": "$datasource",
"editable": true,
"error": false,
"format": "rpm",
"gauge": {
"maxValue": 100,
"minValue": 0,
"show": false,
"thresholdLabels": false,
"thresholdMarkers": true
},
"id": 8,
"interval": "",
"links": [],
"mappingType": 1,
"mappingTypes": [
{
"name": "value to text",
"value": 1
},
{
"name": "range to text",
"value": 2
}
],
"maxDataPoints": 100,
"nullPointMode": "connected",
"nullText": null,
"postfix": "",
"postfixFontSize": "50%",
"prefix": "",
"prefixFontSize": "50%",
"rangeMaps": [
{
"from": "null",
"text": "N/A",
"to": "null"
}
],
"span": 2,
"sparkline": {
"fillColor": "rgba(31, 118, 189, 0.18)",
"full": true,
"lineColor": "rgb(31, 120, 193)",
"show": true
},
"targets": [
{
"dsType": "influxdb",
"groupBy": [
{
"params": [
"$interval"
],
"type": "time"
},
{
"params": [
"null"
],
"type": "fill"
}
],
"measurement": "application.httprequests__transactions",
"policy": "default",
"refId": "A",
"resultFormat": "time_series",
"select": [
[
{
"params": [
"rate1m"
],
"type": "field"
},
{
"params": [],
"type": "last"
}
]
],
"tags": [
{
"key": "app",
"operator": "=~",
"value": "/^$application$/"
},
{
"condition": "AND",
"key": "env",
"operator": "=~",
"value": "/^$environment$/"
},
{
"condition": "AND",
"key": "server",
"operator": "=~",
"value": "/^$server$/"
}
]
}
],
"thresholds": "",
"title": "Throughput",
"type": "singlestat",
"valueFontSize": "80%",
"valueMaps": [
{
"op": "=",
"text": "N/A",
"value": "null"
}
],
"valueName": "current"
},
{
"cacheTimeout": null,
"colorBackground": false,
"colorValue": false,
"colors": [
"rgba(50, 172, 45, 0.97)",
"rgba(237, 129, 40, 0.89)",
"rgba(245, 54, 54, 0.9)"
],
"datasource": "$datasource",
"decimals": 4,
"editable": true,
"error": false,
"format": "percent",
"gauge": {
"maxValue": 100,
"minValue": 0,
"show": false,
"thresholdLabels": false,
"thresholdMarkers": true
},
"id": 6,
"interval": null,
"links": [],
"mappingType": 1,
"mappingTypes": [
{
"name": "value to text",
"value": 1
},
{
"name": "range to text",
"value": 2
}
],
"maxDataPoints": 100,
"nullPointMode": "connected",
"nullText": null,
"postfix": "",
"postfixFontSize": "50%",
"prefix": "",
"prefixFontSize": "50%",
"rangeMaps": [
{
"from": "",
"text": "",
"to": ""
}
],
"span": 2,
"sparkline": {
"fillColor": "rgba(31, 118, 189, 0.18)",
"full": true,
"lineColor": "rgb(31, 120, 193)",
"show": true
},
"targets": [
{
"dsType": "influxdb",
"groupBy": [],
"measurement": "application.httprequests__one_minute_error_percentage_rate",
"policy": "default",
"query": "SELECT \"value\" FROM \"application.httprequests__percentage_error_requests\" WHERE $timeFilter",
"rawQuery": false,
"refId": "A",
"resultFormat": "time_series",
"select": [
[
{
"params": [
"value"
],
"type": "field"
}
]
],
"tags": [
{
"key": "env",
"operator": "=~",
"value": "/^$environment$/"
},
{
"condition": "AND",
"key": "app",
"operator": "=~",
"value": "/^$application$/"
},
{
"condition": "AND",
"key": "server",
"operator": "=~",
"value": "/^$server$/"
}
]
}
],
"thresholds": "",
"title": "Error %",
"type": "singlestat",
"valueFontSize": "80%",
"valueMaps": [
{
"op": "=",
"text": "0%",
"value": "null"
}
],
"valueName": "current"
},
{
"aliasColors": {},
"bars": false,
"datasource": "$datasource",
"editable": true,
"error": false,
"fill": 2,
"id": 13,
"interval": "$summarize",
"legend": {
"avg": false,
"current": false,
"max": false,
"min": false,
"show": false,
"total": false,
"values": false
},
"lines": true,
"linewidth": 1,
"links": [],
"nullPointMode": "connected",
"percentage": false,
"pointradius": 5,
"points": false,
"renderer": "flot",
"seriesOverrides": [],
"span": 4,
"stack": false,
"steppedLine": false,
"targets": [
{
"alias": "",
"dsType": "influxdb",
"groupBy": [
{
"params": [
"$interval"
],
"type": "time"
},
{
"params": [
"null"
],
"type": "fill"
}
],
"measurement": "application.httprequests__active",
"policy": "default",
"refId": "A",
"resultFormat": "time_series",
"select": [
[
{
"params": [
"value"
],
"type": "field"
},
{
"params": [],
"type": "last"
}
]
],
"tags": [
{
"key": "env",
"operator": "=~",
"value": "/^$environment$/"
},
{
"condition": "AND",
"key": "app",
"operator": "=~",
"value": "/^$application$/"
},
{
"condition": "AND",
"key": "server",
"operator": "=~",
"value": "/^$server$/"
}
]
}
],
"thresholds": [],
"timeFrom": null,
"timeShift": null,
"title": "Active Requests",
"tooltip": {
"msResolution": false,
"shared": true,
"sort": 0,
"value_type": "individual"
},
"type": "graph",
"xaxis": {
"mode": "time",
"name": null,
"show": true,
"values": []
},
"yaxes": [
{
"format": "short",
"label": null,
"logBase": 1,
"max": null,
"min": null,
"show": true
},
{
"format": "short",
"label": null,
"logBase": 1,
"max": null,
"min": null,
"show": true
}
]
},
{
"aliasColors": {
"application.httprequests__apdex.last": "#6ED0E0"
},
"bars": false,
"datasource": "$datasource",
"editable": true,
"error": false,
"fill": 1,
"height": "",
"id": 7,
"interval": "$summarize",
"legend": {
"avg": false,
"current": false,
"max": false,
"min": false,
"show": false,
"total": false,
"values": false
},
"lines": true,
"linewidth": 3,
"links": [],
"nullPointMode": "connected",
"percentage": false,
"pointradius": 5,
"points": false,
"renderer": "flot",
"seriesOverrides": [],
"span": 4,
"stack": false,
"steppedLine": false,
"targets": [
{
"dsType": "influxdb",
"groupBy": [
{
"params": [
"$interval"
],
"type": "time"
},
{
"params": [
"null"
],
"type": "fill"
}
],
"measurement": "application.httprequests__apdex",
"policy": "default",
"refId": "A",
"resultFormat": "time_series",
"select": [
[
{
"params": [
"score"
],
"type": "field"
},
{
"params": [],
"type": "last"
}
]
],
"tags": [
{
"key": "app",
"operator": "=~",
"value": "/^$application$/"
},
{
"condition": "AND",
"key": "env",
"operator": "=~",
"value": "/^$environment$/"
},
{
"condition": "AND",
"key": "server",
"operator": "=~",
"value": "/^$server$/"
}
]
}
],
"thresholds": [
{
"colorMode": "critical",
"fill": true,
"line": true,
"op": "lt",
"value": 0.5
},
{
"colorMode": "warning",
"fill": true,
"line": true,
"op": "gt",
"value": 0.5
},
{
"colorMode": "ok",
"fill": true,
"line": true,
"op": "gt",
"value": 0.75
}
],
"timeFrom": null,
"timeShift": null,
"title": "Apdex score",
"tooltip": {
"msResolution": false,
"shared": true,
"sort": 0,
"value_type": "individual"
},
"type": "graph",
"xaxis": {
"mode": "time",
"name": null,
"show": true,
"values": []
},
"yaxes": [
{
"format": "short",
"label": "apdex",
"logBase": 1,
"max": "1",
"min": "0",
"show": true
},
{
"format": "short",
"label": null,
"logBase": 1,
"max": null,
"min": null,
"show": false
}
]
},
{
"aliasColors": {},
"bars": false,
"datasource": "$datasource",
"editable": true,
"error": false,
"fill": 1,
"height": "350",
"id": 1,
"interval": "$summarize",
"legend": {
"avg": false,
"current": true,
"max": false,
"min": false,
"show": true,
"total": false,
"values": true
},
"lines": true,
"linewidth": 1,
"links": [],
"nullPointMode": "connected",
"percentage": false,
"pointradius": 5,
"points": false,
"renderer": "flot",
"seriesOverrides": [],
"span": 6,
"stack": false,
"steppedLine": false,
"targets": [
{
"alias": "$col",
"dsType": "influxdb",
"groupBy": [
{
"params": [
"$interval"
],
"type": "time"
},
{
"params": [
"null"
],
"type": "fill"
}
],
"measurement": "application.httprequests__transactions",
"policy": "default",
"refId": "A",
"resultFormat": "time_series",
"select": [
[
{
"params": [
"rate1m"
],
"type": "field"
},
{
"params": [],
"type": "last"
},
{
"params": [
"1 min rate"
],
"type": "alias"
}
],
[
{
"params": [
"rate5m"
],
"type": "field"
},
{
"params": [],
"type": "last"
},
{
"params": [
"5 min rate"
],
"type": "alias"
}
],
[
{
"params": [
"rate15m"
],
"type": "field"
},
{
"params": [],
"type": "last"
},
{
"params": [
"15 min rate"
],
"type": "alias"
}
]
],
"tags": [
{
"key": "env",
"operator": "=~",
"value": "/^$environment$/"
},
{
"condition": "AND",
"key": "app",
"operator": "=~",
"value": "/^$application$/"
},
{
"condition": "AND",
"key": "server",
"operator": "=~",
"value": "/^$server$/"
}
]
}
],
"thresholds": [],
"timeFrom": null,
"timeShift": null,
"title": "Throughput",
"tooltip": {
"msResolution": false,
"shared": true,
"sort": 0,
"value_type": "individual"
},
"type": "graph",
"xaxis": {
"mode": "time",
"name": null,
"show": true,
"values": []
},
"yaxes": [
{
"format": "rpm",
"label": null,
"logBase": 1,
"max": null,
"min": null,
"show": true
},
{
"format": "short",
"label": null,
"logBase": 1,
"max": null,
"min": null,
"show": true
}
]
},
{
"aliasColors": {},
"bars": false,
"datasource": "$datasource",
"editable": true,
"error": false,
"fill": 1,
"height": "350",
"id": 2,
"interval": "$summarize",
"legend": {
"alignAsTable": false,
"avg": false,
"current": false,
"max": false,
"min": false,
"rightSide": false,
"show": true,
"total": false,
"values": false
},
"lines": true,
"linewidth": 1,
"links": [],
"nullPointMode": "connected",
"percentage": false,
"pointradius": 5,
"points": false,
"renderer": "flot",
"seriesOverrides": [],
"span": 6,
"stack": false,
"steppedLine": false,
"targets": [
{
"alias": "$col",
"dsType": "influxdb",
"groupBy": [
{
"params": [
"$interval"
],
"type": "time"
},
{
"params": [
"null"
],
"type": "fill"
}
],
"measurement": "application.httprequests__transactions",
"policy": "default",
"refId": "A",
"resultFormat": "time_series",
"select": [
[
{
"params": [
"p95"
],
"type": "field"
},
{
"params": [],
"type": "last"
},
{
"params": [
"95th Percentile"
],
"type": "alias"
}
],
[
{
"params": [
"p98"
],
"type": "field"
},
{
"params": [],
"type": "last"
},
{
"params": [
"98th Percentile"
],
"type": "alias"
}
],
[
{
"params": [
"p99"
],
"type": "field"
},
{
"params": [],
"type": "last"
},
{
"params": [
"99th Percentile"
],
"type": "alias"
}
]
],
"tags": [
{
"key": "env",
"operator": "=~",
"value": "/^$environment$/"
},
{
"condition": "AND",
"key": "app",
"operator": "=~",
"value": "/^$application$/"
},
{
"condition": "AND",
"key": "server",
"operator": "=~",
"value": "/^$server$/"
}
]
}
],
"thresholds": [],
"timeFrom": null,
"timeShift": null,
"title": "Response Time",
"tooltip": {
"msResolution": false,
"shared": true,
"sort": 0,
"value_type": "individual"
},
"type": "graph",
"xaxis": {
"mode": "time",
"name": null,
"show": true,
"values": []
},
"yaxes": [
{
"format": "ms",
"label": null,
"logBase": 1,
"max": null,
"min": null,
"show": true
},
{
"format": "short",
"label": null,
"logBase": 1,
"max": null,
"min": null,
"show": true
}
]
},
{
"aliasColors": {},
"bars": false,
"datasource": "$datasource",
"editable": true,
"error": false,
"fill": 1,
"height": "",
"id": 9,
"interval": "$summarize",
"legend": {
"alignAsTable": true,
"avg": false,
"current": true,
"max": false,
"min": false,
"rightSide": true,
"show": false,
"total": false,
"values": true
},
"lines": true,
"linewidth": 1,
"links": [],
"nullPointMode": "connected",
"percentage": false,
"pointradius": 5,
"points": false,
"renderer": "flot",
"seriesOverrides": [],
"span": 6,
"stack": false,
"steppedLine": false,
"targets": [
{
"alias": "",
"dsType": "influxdb",
"groupBy": [
{
"params": [
"$interval"
],
"type": "time"
},
{
"params": [
"null"
],
"type": "fill"
}
],
"measurement": "application.httprequests__one_minute_error_percentage_rate",
"policy": "default",
"refId": "A",
"resultFormat": "time_series",
"select": [
[
{
"params": [
"value"
],
"type": "field"
},
{
"params": [],
"type": "last"
}
]
],
"tags": [
{
"key": "app",
"operator": "=~",
"value": "/^$application$/"
},
{
"condition": "AND",
"key": "env",
"operator": "=~",
"value": "/^$environment$/"
},
{
"condition": "AND",
"key": "server",
"operator": "=~",
"value": "/^$server$/"
}
]
}
],
"thresholds": [],
"timeFrom": null,
"timeShift": null,
"title": "Error Rate %",
"tooltip": {
"msResolution": false,
"shared": true,
"sort": 0,
"value_type": "individual"
},
"type": "graph",
"xaxis": {
"mode": "time",
"name": null,
"show": true,
"values": []
},
"yaxes": [
{
"format": "percent",
"label": null,
"logBase": 1,
"max": "100",
"min": "0",
"show": true
},
{
"format": "short",
"label": null,
"logBase": 1,
"max": null,
"min": null,
"show": true
}
]
},
{
"aliasColors": {},
"bars": false,
"datasource": "$datasource",
"decimals": 2,
"editable": true,
"error": false,
"fill": 1,
"height": "250px",
"id": 3,
"interval": "$summarize",
"legend": {
"alignAsTable": true,
"avg": false,
"current": true,
"max": false,
"min": false,
"rightSide": true,
"show": true,
"total": false,
"values": true
},
"lines": true,
"linewidth": 1,
"links": [],
"nullPointMode": "connected",
"percentage": false,
"pointradius": 5,
"points": false,
"renderer": "flot",
"seriesOverrides": [],
"span": 6,
"stack": false,
"steppedLine": false,
"targets": [
{
"alias": "$col",
"dsType": "influxdb",
"groupBy": [
{
"params": [
"$interval"
],
"type": "time"
},
{
"params": [
"null"
],
"type": "fill"
}
],
"measurement": "application.httprequests__error_rate",
"policy": "default",
"refId": "A",
"resultFormat": "time_series",
"select": [
[
{
"params": [
"rate1m"
],
"type": "field"
},
{
"params": [],
"type": "last"
},
{
"params": [
"1min rate"
],
"type": "alias"
}
],
[
{
"params": [
"rate5m"
],
"type": "field"
},
{
"params": [],
"type": "last"
},
{
"params": [
"5min rate"
],
"type": "alias"
}
],
[
{
"params": [
"rate15m"
],
"type": "field"
},
{
"params": [],
"type": "last"
},
{
"params": [
"15min rate"
],
"type": "alias"
}
]
],
"tags": [
{
"key": "app",
"operator": "=~",
"value": "/^$application$/"
},
{
"condition": "AND",
"key": "env",
"operator": "=~",
"value": "/^$environment$/"
},
{
"condition": "AND",
"key": "server",
"operator": "=~",
"value": "/^$server$/"
}
]
}
],
"thresholds": [],
"timeFrom": null,
"timeShift": null,
"title": "Error Rate",
"tooltip": {
"msResolution": false,
"shared": true,
"sort": 2,
"value_type": "individual"
},
"type": "graph",
"xaxis": {
"mode": "time",
"name": null,
"show": true,
"values": []
},
"yaxes": [
{
"format": "rpm",
"label": null,
"logBase": 1,
"max": null,
"min": null,
"show": true
},
{
"format": "short",
"label": null,
"logBase": 1,
"max": null,
"min": null,
"show": true
}
]
},
{
"aliasColors": {},
"cacheTimeout": null,
"combine": {
"label": "Others",
"threshold": 0
},
"datasource": "$datasource",
"editable": true,
"error": false,
"fontSize": "80%",
"format": "percent",
"height": "250px",
"id": 4,
"interval": "",
"legend": {
"percentage": true,
"show": true,
"sort": null,
"sortDesc": null,
"values": true
},
"legendType": "Right side",
"links": [],
"maxDataPoints": 3,
"nullPointMode": "connected",
"pieType": "pie",
"span": 5,
"strokeWidth": 1,
"targets": [
{
"alias": "$tag_http_status_code",
"dsType": "influxdb",
"groupBy": [
{
"params": [
"http_status_code"
],
"type": "tag"
}
],
"measurement": "application.httprequests__errors",
"policy": "default",
"refId": "A",
"resultFormat": "time_series",
"select": [
[
{
"params": [
"value"
],
"type": "field"
},
{
"params": [],
"type": "sum"
}
]
],
"tags": [
{
"key": "app",
"operator": "=~",
"value": "/^$application$/"
},
{
"condition": "AND",
"key": "env",
"operator": "=~",
"value": "/^$environment$/"
},
{
"condition": "AND",
"key": "server",
"operator": "=~",
"value": "/^$server$/"
}
]
}
],
"title": "Errors",
"type": "grafana-piechart-panel",
"valueName": "current"
},
{
"columns": [
{
"text": "Total",
"value": "total"
}
],
"datasource": "$datasource",
"editable": true,
"error": false,
"filterNull": true,
"fontSize": "100%",
"id": 24,
"interval": "",
"links": [],
"pageSize": 20,
"scroll": true,
"showHeader": true,
"sort": {
"col": 1,
"desc": true
},
"span": 7,
"styles": [
{
"dateFormat": "YYYY-MM-DD HH:mm:ss",
"pattern": "Time",
"type": "date"
},
{
"colorMode": null,
"colors": [
"rgba(245, 54, 54, 0.9)",
"rgba(237, 129, 40, 0.89)",
"rgba(50, 172, 45, 0.97)"
],
"decimals": 0,
"pattern": "/.*/",
"thresholds": [],
"type": "number",
"unit": "none"
}
],
"targets": [
{
"alias": "$tag_exception",
"dsType": "influxdb",
"groupBy": [
{
"params": [
"$interval"
],
"type": "time"
},
{
"params": [
"exception"
],
"type": "tag"
}
],
"measurement": "application.httprequests__exceptions",
"policy": "default",
"refId": "A",
"resultFormat": "time_series",
"select": [
[
{
"params": [
"value"
],
"type": "field"
},
{
"params": [],
"type": "last"
}
]
],
"tags": [
{
"key": "env",
"operator": "=~",
"value": "/^$environment$/"
},
{
"condition": "AND",
"key": "app",
"operator": "=~",
"value": "/^$application$/"
},
{
"condition": "AND",
"key": "server",
"operator": "=~",
"value": "/^$server$/"
}
]
}
],
"title": "Uncaught Exceptions Thrown",
"transform": "timeseries_aggregations",
"type": "table"
}
],
"repeat": null,
"repeatIteration": null,
"repeatRowId": null,
"showTitle": true,
"title": "Overview",
"titleSize": "h6"
},
{
"collapse": false,
"height": "300",
"panels": [
{
"aliasColors": {},
"bars": false,
"datasource": "$datasource",
"editable": true,
"error": false,
"fill": 1,
"height": "350",
"id": 16,
"interval": "$summarize",
"legend": {
"alignAsTable": true,
"avg": false,
"current": false,
"max": false,
"min": false,
"rightSide": true,
"show": true,
"sort": "current",
"sortDesc": true,
"total": false,
"values": false
},
"lines": true,
"linewidth": 1,
"links": [],
"nullPointMode": "connected",
"percentage": false,
"pointradius": 5,
"points": false,
"renderer": "flot",
"seriesOverrides": [],
"span": 6,
"stack": true,
"steppedLine": false,
"targets": [
{
"alias": "$tag_route",
"dsType": "influxdb",
"groupBy": [
{
"params": [
"$interval"
],
"type": "time"
},
{
"params": [
"route"
],
"type": "tag"
},
{
"params": [
"null"
],
"type": "fill"
}
],
"measurement": "application.httprequests__transactions_per_endpoint",
"policy": "default",
"refId": "A",
"resultFormat": "time_series",
"select": [
[
{
"params": [
"rate1m"
],
"type": "field"
},
{
"params": [],
"type": "last"
}
]
],
"tags": [
{
"key": "env",
"operator": "=~",
"value": "/^$environment$/"
},
{
"condition": "AND",
"key": "app",
"operator": "=~",
"value": "/^$application$/"
},
{
"condition": "AND",
"key": "server",
"operator": "=~",
"value": "/^$server$/"
}
]
}
],
"thresholds": [],
"timeFrom": null,
"timeShift": null,
"title": "Throughput / Endpoint",
"tooltip": {
"msResolution": false,
"shared": true,
"sort": 2,
"value_type": "individual"
},
"transparent": false,
"type": "graph",
"xaxis": {
"mode": "time",
"name": null,
"show": true,
"values": []
},
"yaxes": [
{
"format": "rpm",
"label": null,
"logBase": 1,
"max": null,
"min": null,
"show": true
},
{
"format": "short",
"label": null,
"logBase": 1,
"max": null,
"min": null,
"show": true
}
]
},
{
"aliasColors": {},
"bars": false,
"datasource": "$datasource",
"editable": true,
"error": false,
"fill": 1,
"height": "350",
"id": 17,
"interval": "$summarize",
"legend": {
"alignAsTable": true,
"avg": false,
"current": false,
"max": false,
"min": false,
"rightSide": true,
"show": true,
"total": false,
"values": false
},
"lines": true,
"linewidth": 1,
"links": [],
"nullPointMode": "connected",
"percentage": false,
"pointradius": 5,
"points": false,
"renderer": "flot",
"seriesOverrides": [],
"span": 6,
"stack": false,
"steppedLine": false,
"targets": [
{
"alias": "$tag_route",
"dsType": "influxdb",
"groupBy": [
{
"params": [
"$interval"
],
"type": "time"
},
{
"params": [
"route"
],
"type": "tag"
},
{
"params": [
"null"
],
"type": "fill"
}
],
"measurement": "application.httprequests__transactions_per_endpoint",
"policy": "default",
"refId": "A",
"resultFormat": "time_series",
"select": [
[
{
"params": [
"p95"
],
"type": "field"
},
{
"params": [],
"type": "last"
},
{
"params": [
"95th Percentile"
],
"type": "alias"
}
]
],
"tags": [
{
"key": "env",
"operator": "=~",
"value": "/^$environment$/"
},
{
"condition": "AND",
"key": "app",
"operator": "=~",
"value": "/^$application$/"
},
{
"condition": "AND",
"key": "server",
"operator": "=~",
"value": "/^$server$/"
}
]
}
],
"thresholds": [],
"timeFrom": null,
"timeShift": null,
"title": "Response Time / Endpoint",
"tooltip": {
"msResolution": false,
"shared": true,
"sort": 0,
"value_type": "individual"
},
"type": "graph",
"xaxis": {
"mode": "time",
"name": null,
"show": true,
"values": []
},
"yaxes": [
{
"format": "ms",
"label": null,
"logBase": 1,
"max": null,
"min": null,
"show": true
},
{
"format": "short",
"label": null,
"logBase": 1,
"max": null,
"min": null,
"show": true
}
]
},
{
"columns": [
{
"text": "Current",
"value": "current"
}
],
"datasource": "$datasource",
"editable": true,
"error": false,
"filterNull": false,
"fontSize": "100%",
"id": 10,
"interval": "",
"links": [],
"pageSize": null,
"scroll": true,
"showHeader": true,
"sort": {
"col": 1,
"desc": true
},
"span": 6,
"styles": [
{
"dateFormat": "YYYY-MM-DD HH:mm:ss",
"pattern": "Time",
"type": "date"
},
{
"colorMode": null,
"colors": [
"rgba(245, 54, 54, 0.9)",
"rgba(237, 129, 40, 0.89)",
"rgba(50, 172, 45, 0.97)"
],
"decimals": 2,
"pattern": "/.*/",
"thresholds": [],
"type": "number",
"unit": "ms"
}
],
"targets": [
{
"alias": "$tag_route",
"dsType": "influxdb",
"groupBy": [
{
"params": [
"$interval"
],
"type": "time"
},
{
"params": [
"route"
],
"type": "tag"
},
{
"params": [
"null"
],
"type": "fill"
}
],
"measurement": "application.httprequests__transactions_per_endpoint",
"policy": "default",
"refId": "A",
"resultFormat": "time_series",
"select": [
[
{
"params": [
"p95"
],
"type": "field"
},
{
"params": [],
"type": "last"
}
]
],
"tags": [
{
"key": "env",
"operator": "=~",
"value": "/^$environment$/"
},
{
"condition": "AND",
"key": "app",
"operator": "=~",
"value": "/^$application$/"
},
{
"condition": "AND",
"key": "server",
"operator": "=~",
"value": "/^$server$/"
}
]
}
],
"title": "Response Times / Endpoint",
"transform": "timeseries_aggregations",
"type": "table"
},
{
"columns": [
{
"text": "Current",
"value": "current"
}
],
"datasource": "$datasource",
"editable": true,
"error": false,
"filterNull": false,
"fontSize": "100%",
"id": 12,
"interval": "",
"links": [],
"pageSize": null,
"scroll": true,
"showHeader": true,
"sort": {
"col": 1,
"desc": true
},
"span": 6,
"styles": [
{
"dateFormat": "YYYY-MM-DD HH:mm:ss",
"pattern": "Time",
"type": "date"
},
{
"colorMode": null,
"colors": [
"rgba(245, 54, 54, 0.9)",
"rgba(237, 129, 40, 0.89)",
"rgba(50, 172, 45, 0.97)"
],
"decimals": 2,
"pattern": "/.*/",
"thresholds": [],
"type": "number",
"unit": "rpm"
}
],
"targets": [
{
"alias": "$tag_route",
"dsType": "influxdb",
"groupBy": [
{
"params": [
"$interval"
],
"type": "time"
},
{
"params": [
"route"
],
"type": "tag"
},
{
"params": [
"null"
],
"type": "fill"
}
],
"measurement": "application.httprequests__transactions_per_endpoint",
"policy": "default",
"refId": "A",
"resultFormat": "time_series",
"select": [
[
{
"params": [
"rate1m"
],
"type": "field"
},
{
"params": [],
"type": "last"
}
]
],
"tags": [
{
"key": "env",
"operator": "=~",
"value": "/^$environment$/"
},
{
"condition": "AND",
"key": "app",
"operator": "=~",
"value": "/^$application$/"
},
{
"condition": "AND",
"key": "server",
"operator": "=~",
"value": "/^$server$/"
}
]
}
],
"title": "Throughput / Endpoint",
"transform": "timeseries_aggregations",
"type": "table"
},
{
"columns": [
{
"text": "Current",
"value": "current"
}
],
"datasource": "$datasource",
"editable": true,
"error": false,
"filterNull": false,
"fontSize": "100%",
"id": 11,
"interval": "",
"links": [],
"pageSize": null,
"scroll": true,
"showHeader": true,
"sort": {
"col": null,
"desc": false
},
"span": 6,
"styles": [
{
"dateFormat": "YYYY-MM-DD HH:mm:ss",
"pattern": "Time",
"type": "date"
},
{
"colorMode": null,
"colors": [
"rgba(245, 54, 54, 0.9)",
"rgba(237, 129, 40, 0.89)",
"rgba(50, 172, 45, 0.97)"
],
"decimals": 0,
"pattern": "/.*/",
"thresholds": [],
"type": "number",
"unit": "percent"
}
],
"targets": [
{
"alias": "$tag_route",
"dsType": "influxdb",
"groupBy": [
{
"params": [
"$interval"
],
"type": "time"
},
{
"params": [
"route"
],
"type": "tag"
},
{
"params": [
"null"
],
"type": "fill"
}
],
"measurement": "application.httprequests__one_minute_error_percentage_rate_per_endpoint",
"policy": "default",
"refId": "A",
"resultFormat": "time_series",
"select": [
[
{
"params": [
"value"
],
"type": "field"
},
{
"params": [],
"type": "last"
}
]
],
"tags": [
{
"key": "app",
"operator": "=~",
"value": "/^$application$/"
},
{
"condition": "AND",
"key": "env",
"operator": "=~",
"value": "/^$environment$/"
},
{
"condition": "AND",
"key": "server",
"operator": "=~",
"value": "/^$server$/"
}
]
}
],
"title": "Error Request Percentage / Endpoint",
"transform": "timeseries_aggregations",
"type": "table"
},
{
"columns": [
{
"text": "Total",
"value": "total"
}
],
"datasource": "$datasource",
"editable": true,
"error": false,
"filterNull": false,
"fontSize": "100%",
"id": 25,
"interval": "",
"links": [],
"pageSize": null,
"scroll": true,
"showHeader": true,
"sort": {
"col": 1,
"desc": true
},
"span": 6,
"styles": [
{
"dateFormat": "YYYY-MM-DD HH:mm:ss",
"pattern": "Time",
"type": "date"
},
{
"colorMode": null,
"colors": [
"rgba(245, 54, 54, 0.9)",
"rgba(237, 129, 40, 0.89)",
"rgba(50, 172, 45, 0.97)"
],
"decimals": 0,
"pattern": "/.*/",
"thresholds": [],
"type": "number",
"unit": "none"
}
],
"targets": [
{
"alias": "$tag_route [$tag_exception]",
"dsType": "influxdb",
"groupBy": [
{
"params": [
"$interval"
],
"type": "time"
},
{
"params": [
"route"
],
"type": "tag"
},
{
"params": [
"exception"
],
"type": "tag"
}
],
"measurement": "application.httprequests__exceptions",
"policy": "default",
"refId": "A",
"resultFormat": "time_series",
"select": [
[
{
"params": [
"value"
],
"type": "field"
},
{
"params": [],
"type": "last"
}
]
],
"tags": [
{
"key": "env",
"operator": "=~",
"value": "/^$environment$/"
},
{
"condition": "AND",
"key": "app",
"operator": "=~",
"value": "/^$application$/"
},
{
"condition": "AND",
"key": "server",
"operator": "=~",
"value": "/^$server$/"
}
]
}
],
"title": "Uncaught Exceptions Thrown / Endpoint",
"transform": "timeseries_aggregations",
"type": "table"
}
],
"repeat": null,
"repeatIteration": null,
"repeatRowId": null,
"showTitle": true,
"title": "Endpoints",
"titleSize": "h6"
},
{
"collapse": false,
"height": "250",
"panels": [
{
"columns": [
{
"text": "Current",
"value": "current"
}
],
"datasource": "$datasource",
"editable": true,
"error": false,
"filterNull": false,
"fontSize": "100%",
"hideTimeOverride": true,
"id": 22,
"interval": "",
"links": [],
"pageSize": null,
"scroll": true,
"showHeader": true,
"sort": {
"col": 0,
"desc": true
},
"span": 9,
"styles": [
{
"dateFormat": "YYYY-MM-DD HH:mm:ss",
"pattern": "Time",
"type": "date"
},
{
"colorMode": "row",
"colors": [
"rgba(245, 54, 54, 0.9)",
"rgba(237, 129, 40, 0.89)",
"rgba(50, 172, 45, 0.97)"
],
"decimals": 1,
"pattern": "/.*/",
"thresholds": [
"0.5",
"1"
],
"type": "number",
"unit": "short"
}
],
"targets": [
{
"alias": "$tag_health_check_name",
"dsType": "influxdb",
"groupBy": [
{
"params": [
"$interval"
],
"type": "time"
},
{
"params": [
"health_check_name"
],
"type": "tag"
},
{
"params": [
"null"
],
"type": "fill"
}
],
"measurement": "application.health__results",
"policy": "default",
"refId": "A",
"resultFormat": "time_series",
"select": [
[
{
"params": [
"value"
],
"type": "field"
},
{
"params": [],
"type": "last"
}
]
],
"tags": [
{
"key": "env",
"operator": "=~",
"value": "/^$environment$/"
},
{
"condition": "AND",
"key": "app",
"operator": "=~",
"value": "/^$application$/"
},
{
"condition": "AND",
"key": "server",
"operator": "=~",
"value": "/^$server$/"
}
]
}
],
"timeFrom": null,
"title": "Results",
"transform": "timeseries_aggregations",
"transparent": true,
"type": "table"
},
{
"cacheTimeout": null,
"colorBackground": true,
"colorValue": false,
"colors": [
"rgba(245, 54, 54, 0.9)",
"rgba(237, 129, 40, 0.89)",
"rgba(50, 172, 45, 0.97)"
],
"datasource": "$datasource",
"editable": true,
"error": false,
"format": "none",
"gauge": {
"maxValue": 100,
"minValue": 0,
"show": false,
"thresholdLabels": false,
"thresholdMarkers": true
},
"hideTimeOverride": true,
"id": 19,
"interval": null,
"links": [
{
"type": "dashboard"
}
],
"mappingType": 2,
"mappingTypes": [
{
"name": "value to text",
"value": 1
},
{
"name": "range to text",
"value": 2
}
],
"maxDataPoints": 100,
"nullPointMode": "connected",
"nullText": null,
"postfix": "",
"postfixFontSize": "50%",
"prefix": "",
"prefixFontSize": "50%",
"rangeMaps": [
{
"from": "0",
"text": "Unhealthy",
"to": "0.49"
},
{
"from": "0.5",
"text": "Degraded",
"to": "0.9"
},
{
"from": "1.0",
"text": "Healthy",
"to": "2.0"
}
],
"span": 3,
"sparkline": {
"fillColor": "rgba(31, 118, 189, 0.18)",
"full": false,
"lineColor": "rgb(31, 120, 193)",
"show": false
},
"targets": [
{
"dsType": "influxdb",
"groupBy": [
{
"params": [
"$interval"
],
"type": "time"
},
{
"params": [
"null"
],
"type": "fill"
}
],
"measurement": "application.health__score",
"policy": "default",
"refId": "A",
"resultFormat": "time_series",
"select": [
[
{
"params": [
"value"
],
"type": "field"
},
{
"params": [],
"type": "last"
}
]
],
"tags": [
{
"key": "env",
"operator": "=~",
"value": "/^$environment$/"
},
{
"condition": "AND",
"key": "app",
"operator": "=~",
"value": "/^$application$/"
},
{
"condition": "AND",
"key": "server",
"operator": "=~",
"value": "/^$server$/"
}
]
}
],
"thresholds": "0.5,1",
"timeFrom": null,
"title": "",
"transparent": true,
"type": "singlestat",
"valueFontSize": "80%",
"valueMaps": [
{
"op": "=",
"text": "Unhealthy",
"value": "0"
},
{
"op": "=",
"text": "Degraded",
"value": "0.5"
},
{
"op": "=",
"text": "Healthy",
"value": "1.0"
}
],
"valueName": "current"
}
],
"repeat": null,
"repeatIteration": null,
"repeatRowId": null,
"showTitle": true,
"title": "Health",
"titleSize": "h6"
},
{
"collapse": false,
"height": "300",
"panels": [
{
"aliasColors": {},
"bars": false,
"datasource": "$datasource",
"editable": true,
"error": false,
"fill": 1,
"id": 14,
"interval": "$summarize",
"legend": {
"alignAsTable": true,
"avg": false,
"current": true,
"hideEmpty": false,
"max": false,
"min": false,
"rightSide": true,
"show": true,
"total": false,
"values": true
},
"lines": true,
"linewidth": 1,
"links": [],
"nullPointMode": "connected",
"percentage": false,
"pointradius": 5,
"points": false,
"renderer": "flot",
"seriesOverrides": [],
"span": 6,
"stack": false,
"steppedLine": false,
"targets": [
{
"alias": "$col",
"dsType": "influxdb",
"groupBy": [
{
"params": [
"$interval"
],
"type": "time"
},
{
"params": [
"null"
],
"type": "fill"
}
],
"measurement": "application.httprequests__post_size",
"policy": "default",
"refId": "A",
"resultFormat": "time_series",
"select": [
[
{
"params": [
"p95"
],
"type": "field"
},
{
"params": [],
"type": "last"
},
{
"params": [
"95th percentile"
],
"type": "alias"
}
],
[
{
"params": [
"p98"
],
"type": "field"
},
{
"params": [],
"type": "last"
},
{
"params": [
"98th percentile"
],
"type": "alias"
}
],
[
{
"params": [
"p99"
],
"type": "field"
},
{
"params": [],
"type": "last"
},
{
"params": [
"99th percentile"
],
"type": "alias"
}
],
[
{
"params": [
"last"
],
"type": "field"
},
{
"params": [],
"type": "median"
},
{
"params": [
"median"
],
"type": "alias"
}
]
],
"tags": [
{
"key": "app",
"operator": "=~",
"value": "/^$application$/"
},
{
"condition": "AND",
"key": "env",
"operator": "=~",
"value": "/^$environment$/"
},
{
"condition": "AND",
"key": "server",
"operator": "=~",
"value": "/^$server$/"
}
]
}
],
"thresholds": [],
"timeFrom": null,
"timeShift": null,
"title": "Post Request Size",
"tooltip": {
"msResolution": false,
"shared": true,
"sort": 0,
"value_type": "individual"
},
"type": "graph",
"xaxis": {
"mode": "time",
"name": null,
"show": true,
"values": []
},
"yaxes": [
{
"format": "decbytes",
"label": null,
"logBase": 1,
"max": null,
"min": null,
"show": true
},
{
"format": "short",
"label": null,
"logBase": 1,
"max": null,
"min": null,
"show": true
}
]
},
{
"aliasColors": {},
"bars": false,
"datasource": "$datasource",
"editable": true,
"error": false,
"fill": 1,
"id": 15,
"interval": "$summarize",
"legend": {
"alignAsTable": true,
"avg": false,
"current": true,
"max": false,
"min": false,
"rightSide": true,
"show": true,
"total": false,
"values": true
},
"lines": true,
"linewidth": 1,
"links": [],
"nullPointMode": "connected",
"percentage": false,
"pointradius": 5,
"points": false,
"renderer": "flot",
"seriesOverrides": [],
"span": 6,
"stack": false,
"steppedLine": false,
"targets": [
{
"alias": "$col",
"dsType": "influxdb",
"groupBy": [
{
"params": [
"$interval"
],
"type": "time"
},
{
"params": [
"null"
],
"type": "fill"
}
],
"measurement": "application.httprequests__put_size",
"policy": "default",
"refId": "A",
"resultFormat": "time_series",
"select": [
[
{
"params": [
"p95"
],
"type": "field"
},
{
"params": [],
"type": "last"
},
{
"params": [
"95th percentile"
],
"type": "alias"
}
],
[
{
"params": [
"p98"
],
"type": "field"
},
{
"params": [],
"type": "last"
},
{
"params": [
"98th percentile"
],
"type": "alias"
}
],
[
{
"params": [
"p99"
],
"type": "field"
},
{
"params": [],
"type": "last"
},
{
"params": [
"99th percentile"
],
"type": "alias"
}
],
[
{
"params": [
"median"
],
"type": "field"
},
{
"params": [],
"type": "median"
},
{
"params": [
"median"
],
"type": "alias"
}
]
],
"tags": [
{
"key": "app",
"operator": "=~",
"value": "/^$application$/"
},
{
"condition": "AND",
"key": "env",
"operator": "=~",
"value": "/^$environment$/"
},
{
"condition": "AND",
"key": "server",
"operator": "=~",
"value": "/^$server$/"
}
]
}
],
"thresholds": [],
"timeFrom": null,
"timeShift": null,
"title": "Put Request Size",
"tooltip": {
"msResolution": false,
"shared": true,
"sort": 0,
"value_type": "individual"
},
"type": "graph",
"xaxis": {
"mode": "time",
"name": null,
"show": true,
"values": []
},
"yaxes": [
{
"format": "bytes",
"label": null,
"logBase": 1,
"max": null,
"min": null,
"show": true
},
{
"format": "short",
"label": null,
"logBase": 1,
"max": null,
"min": null,
"show": true
}
]
}
],
"repeat": null,
"repeatIteration": null,
"repeatRowId": null,
"showTitle": true,
"title": "PUT & POST Request Size",
"titleSize": "h6"
}
],
"schemaVersion": 14,
"style": "dark",
"tags": [
"influxdb"
],
"templating": {
"list": [
{
"allValue": null,
"current": {},
"datasource": "$datasource",
"hide": 0,
"includeAll": false,
"label": null,
"multi": false,
"name": "environment",
"options": [],
"query": "SHOW TAG VALUES WITH KEY = \"env\"",
"refresh": 1,
"regex": "",
"sort": 1,
"tagValuesQuery": null,
"tags": [],
"tagsQuery": null,
"type": "query",
"useTags": false
},
{
"allValue": null,
"current": {},
"datasource": "$datasource",
"hide": 0,
"includeAll": false,
"label": null,
"multi": false,
"name": "application",
"options": [],
"query": "SHOW TAG VALUES WITH KEY = \"app\"",
"refresh": 1,
"regex": "",
"sort": 1,
"tagValuesQuery": null,
"tags": [],
"tagsQuery": null,
"type": "query",
"useTags": false
},
{
"current": {
"text": "AppMetricsSandbox",
"value": "AppMetricsSandbox"
},
"hide": 0,
"label": null,
"name": "datasource",
"options": [],
"query": "influxdb",
"refresh": 1,
"regex": "",
"type": "datasource"
},
{
"auto": false,
"auto_count": 30,
"auto_min": "10s",
"current": {
"text": "5s",
"value": "5s"
},
"hide": 0,
"label": null,
"name": "summarize",
"options": [
{
"selected": true,
"text": "5s",
"value": "5s"
},
{
"selected": false,
"text": "10s",
"value": "10s"
},
{
"selected": false,
"text": "30s",
"value": "30s"
},
{
"selected": false,
"text": "1m",
"value": "1m"
},
{
"selected": false,
"text": "10m",
"value": "10m"
},
{
"selected": false,
"text": "30m",
"value": "30m"
},
{
"selected": false,
"text": "1h",
"value": "1h"
},
{
"selected": false,
"text": "6h",
"value": "6h"
},
{
"selected": false,
"text": "12h",
"value": "12h"
},
{
"selected": false,
"text": "1d",
"value": "1d"
},
{
"selected": false,
"text": "7d",
"value": "7d"
},
{
"selected": false,
"text": "14d",
"value": "14d"
},
{
"selected": false,
"text": "30d",
"value": "30d"
}
],
"query": "5s,10s,30s,1m,10m,30m,1h,6h,12h,1d,7d,14d,30d",
"refresh": 2,
"type": "interval"
},
{
"allValue": null,
"current": {},
"datasource": "$datasource",
"hide": 0,
"includeAll": true,
"label": null,
"multi": true,
"name": "server",
"options": [],
"query": "SHOW TAG VALUES WITH KEY = \"server\"",
"refresh": 1,
"regex": "",
"sort": 0,
"tagValuesQuery": "",
"tags": [],
"tagsQuery": "",
"type": "query",
"useTags": false
}
]
},
"time": {
"from": "now-5m",
"to": "now"
},
"timepicker": {
"refresh_intervals": [
"5s",
"10s",
"30s",
"1m",
"5m",
"15m",
"30m",
"1h",
"2h",
"1d"
],
"time_options": [
"5m",
"15m",
"1h",
"6h",
"12h",
"24h",
"2d",
"7d",
"30d"
]
},
"timezone": "browser",
"title": "App Metrics - Web Monitoring - InfluxDB",
"version": 21
}
最后启动AspNetCore站点,再建立点post get put什么的控制器和Action随便访问几次就可以了

源代码下载处(grafana.json是文中导入的dashboard配置文件)
AspNet Core下利用 app-metrics+Grafana + InfluxDB实现高大上的性能监控界面的更多相关文章
- AspNet Core 下利用普罗米修斯+Grafana构建Metrics和服务器性能的监控 (无心打造文字不喜勿喷谢谢!)
概述 Prometheus的主要特点 组件 结构图 适用场景 不适用场景 安装node_exporter,系统性能指数收集(收集系统性能情况) 下载文件 解压并复制node_exporter应用程序到 ...
- Asp.net core下利用EF core实现从数据实现多租户(1)
前言 随着互联网的的高速发展,大多数的公司由于一开始使用的传统的硬件/软件架构,导致在业务不断发展的同时,系统也逐渐地逼近传统结构的极限. 于是,系统也急需进行结构上的升级换代. 在服务端,系统的I/ ...
- Asp.net core下利用EF core实现从数据实现多租户(3): 按Schema分离 附加:EF Migration 操作
前言 前段时间写了EF core实现多租户的文章,实现了根据数据库,数据表进行多租户数据隔离. 今天开始写按照Schema分离的文章. 其实还有一种,是通过在数据表内添加一个字段做多租户的,但是这种模 ...
- EF Core下利用Mysql进行数据存储在并发访问下的数据同步问题
小故事 在开始讲这篇文章之前,我们来说一个小故事,纯素虚构(真实的存钱逻辑并非如此) 小刘发工资后,赶忙拿着现金去银行,准备把钱存起来,而与此同时,小刘的老婆刘嫂知道小刘的品性,知道他发工资的日子,也 ...
- Asp.net core下利用EF core实现从数据实现多租户(2) : 按表分离
前言 在上一篇文章中,我们介绍了如何根据不同的租户进行数据分离,分离的办法是一个租户一个数据库. 也提到了这种模式还是相对比较重,所以本文会介绍一种更加普遍使用的办法: 按表分离租户. 这样做的好处是 ...
- 在k8s集群中,利用prometheus的jmx_exporter进行tomcat的JVM性能监控,并用grafana作前端展示
查找了很多文档,没有完全达到我要求的, 于是,作了一定的调整,成现在这样. 操作步骤如下: 一,准备好两个文件. jmx_prometheus_javaagent-0.3.1.jar jmx_expo ...
- docker-compose(grafana influxdb) + telegraf 快速搭建简单监控
灵活实现方案: 1: telegraf 为go 语言写得占用内存小 收集主机各项监控数据 定时写入 时序DB influxdb ------------------------&qu ...
- Linux下利用Valgrind工具进行内存泄露检测和性能分析
from http://www.linuxidc.com/Linux/2012-06/63754.htm Valgrind通常用来成分析程序性能及程序中的内存泄露错误 一 Valgrind工具集简绍 ...
- Apache SkyWalking 为.NET Core带来开箱即用的分布式追踪和应用性能监控
在大型网站系统设计中,随着分布式架构,特别是微服务架构的流行,我们将系统解耦成更小的单元,通过不断的添加新的.小的模块或者重用已经有的模块来构建复杂的系统.随着模块的不断增多,一次请求可能会涉及到十几 ...
随机推荐
- centos下彻底删除mysql的方法
本文记录了CentOS下MySQL的彻底卸载,供大家参考,具体内容如下: 1.查看MySQL是否安装 方式1: [root@localhost usr]# yum list installed mys ...
- python学习笔记之集合
集合:可变的数据类型,他里面的元素必须是不可变的数据类型,无序,不重复. {}'''# set1 = set({1,2,3})# set2 = {1,2,3,[2,3],{'name':'alex'} ...
- 在php中实现Redis的订阅与发布
<?php //require_once dirname(__FILE__).'/class/RedisClass.class.php'; function init_redis(){ $red ...
- (二叉树 BFS) leetcode 107. Binary Tree Level Order Traversal II
Given a binary tree, return the bottom-up level order traversal of its nodes' values. (ie, from left ...
- python8--文件操作 with。。。open语法
复习 一.类型转换 1.数字类型:int() | bool() | float() 2.str与int:int('10') | int('-10') | int('0') | float('-. ...
- 老男孩Python全栈学习 S9 日常作业 009
1.写函数,检查获取传入列表或元组对象的所有奇数位索引对应的元素,并将其作为新列表返回给调用者. def func1(List): List2 = [] for num in range(len(Li ...
- BootstrapTable-加载数据
要加载的数据:https://examples.wenzhixin.net.cn/examples/bootstrap_table/data?search=&order=asc&off ...
- C++数组的初始化
来源:https://zhidao.baidu.com/question/380723280.html int a[]={1,2,3}; 这种方式初始化,大括号里写了几个元素那么数组里就有几个元素,相 ...
- JSP/Serlet 使用fileupload上传文件
需要引用的jar commons-fileupload-1.3.1.jar commons-io-2.2.jar index.jsp <body> <center> <h ...
- Mybatis-Plus入门
1 Mybatis-Plus简介 1.1 什么是Mybatis-Plus MyBatis-Plus(简称 MP)是一个 MyBatis 的增强工具,在 MyBatis 的基础上只做增强不做改变,为简化 ...