性能调优命令之jstack
jstack是java虚拟机自带的一种线程堆栈跟踪工具。
/opt/java8/bin/jstack

Usage:

    jstack [-l] <pid>

        (to connect to running process)   #连接活动线程

    jstack -F [-m] [-l] <pid>

        (to connect to a hung process)    #连接阻塞线程

    jstack [-m] [-l] <executable> <core>

        (to connect to a core file)       #连接dump的文件

    jstack [-m] [-l] [server_id@]<remote server IP or hostname>

        (to connect to a remote debug server)     #连接远程服务器

Options:

    -F  to force a thread dump. Use when jstack <pid> does not respond (process is hung)

    -m  to print both java and native frames (mixed mode)

    -l  long listing. Prints additional information about locks

    -h or -help to print this help message
$ jstack 5611

2021-06-06 22:05:43

Full thread dump Java HotSpot(TM) Client VM (25.271-b09 mixed mode):

"RemoteInvocationHandler [#2]" #63304 daemon prio=5 os_prio=0 tid=0xe3f4bc00 nid=0x240 in Object.wait() [0xe3b3e000]

   java.lang.Thread.State: TIMED_WAITING (on object monitor)

	at java.lang.Object.wait(Native Method)

	at java.lang.ref.ReferenceQueue.remove(ReferenceQueue.java:144)

	- locked <0xea7480c8> (a java.lang.ref.ReferenceQueue$Lock)

	at hudson.remoting.RemoteInvocationHandler$Unexporter.run(RemoteInvocationHandler.java:603)

	at java.util.concurrent.Executors$RunnableAdapter.call(Executors.java:511)

	at java.util.concurrent.FutureTask.run(FutureTask.java:266)

	at hudson.remoting.AtmostOneThreadExecutor$Worker.run(AtmostOneThreadExecutor.java:118)

	at java.lang.Thread.run(Thread.java:748)

"Attach Listener" #63199 daemon prio=9 os_prio=0 tid=0xe2a52800 nid=0x7938 waiting on condition [0x00000000]

   java.lang.Thread.State: RUNNABLE

"Ping thread for channel hudson.remoting.Channel@4afd8d:channel" #24 daemon prio=5 os_prio=0 tid=0xe4637000 nid=0x1617 waiting on condition [0xe34b9000]

   java.lang.Thread.State: TIMED_WAITING (sleeping)

	at java.lang.Thread.sleep(Native Method)

	at hudson.remoting.PingThread.run(PingThread.java:95)

"Channel reader thread: channel" #9 prio=5 os_prio=0 tid=0xe3f50800 nid=0x15fa runnable [0xe3aed000]

   java.lang.Thread.State: RUNNABLE

	at java.io.FileInputStream.readBytes(Native Method)

	at java.io.FileInputStream.read(FileInputStream.java:255)

	at java.io.BufferedInputStream.fill(BufferedInputStream.java:246)

	at java.io.BufferedInputStream.read(BufferedInputStream.java:265)

	- locked <0xea4b13b0> (a java.io.BufferedInputStream)

	at hudson.remoting.FlightRecorderInputStream.read(FlightRecorderInputStream.java:92)

	at hudson.remoting.ChunkedInputStream.readHeader(ChunkedInputStream.java:72)

	at hudson.remoting.ChunkedInputStream.readUntilBreak(ChunkedInputStream.java:103)

	at hudson.remoting.ChunkedCommandTransport.readBlock(ChunkedCommandTransport.java:39)

	at hudson.remoting.AbstractSynchronousByteArrayCommandTransport.read(AbstractSynchronousByteArrayCommandTransport.java:34)

	at hudson.remoting.SynchronousCommandTransport$ReaderThread.run(SynchronousCommandTransport.java:63)

"Service Thread" #6 daemon prio=9 os_prio=0 tid=0xf7085400 nid=0x15f2 runnable [0x00000000]

   java.lang.Thread.State: RUNNABLE

"C1 CompilerThread0" #5 daemon prio=9 os_prio=0 tid=0xf7082000 nid=0x15f1 waiting on condition [0x00000000]

   java.lang.Thread.State: RUNNABLE

"Signal Dispatcher" #4 daemon prio=9 os_prio=0 tid=0xf7080800 nid=0x15f0 runnable [0x00000000]

   java.lang.Thread.State: RUNNABLE

"Finalizer" #3 daemon prio=8 os_prio=0 tid=0xf7066400 nid=0x15ef in Object.wait() [0xe45ad000]

   java.lang.Thread.State: WAITING (on object monitor)

	at java.lang.Object.wait(Native Method)

	at java.lang.ref.ReferenceQueue.remove(ReferenceQueue.java:144)

	- locked <0xea486e40> (a java.lang.ref.ReferenceQueue$Lock)

	at java.lang.ref.ReferenceQueue.remove(ReferenceQueue.java:165)

	at java.lang.ref.Finalizer$FinalizerThread.run(Finalizer.java:216)

"Reference Handler" #2 daemon prio=10 os_prio=0 tid=0xf7063800 nid=0x15ee in Object.wait() [0xe45fe000]

   java.lang.Thread.State: WAITING (on object monitor)

	at java.lang.Object.wait(Native Method)

	at java.lang.Object.wait(Object.java:502)

	at java.lang.ref.Reference.tryHandlePending(Reference.java:191)

	- locked <0xea486fe0> (a java.lang.ref.Reference$Lock)

	at java.lang.ref.Reference$ReferenceHandler.run(Reference.java:153)

"main" #1 prio=5 os_prio=0 tid=0xf7007400 nid=0x15ec in Object.wait() [0xf717d000]

   java.lang.Thread.State: TIMED_WAITING (on object monitor)

	at java.lang.Object.wait(Native Method)

	at hudson.remoting.Channel.join(Channel.java:1187)

	- locked <0xea747e30> (a hudson.remoting.Channel)

	at hudson.remoting.Launcher.main(Launcher.java:796)

	at hudson.remoting.Launcher.runWithStdinStdout(Launcher.java:718)

	at hudson.remoting.Launcher.run(Launcher.java:398)

	at hudson.remoting.Launcher.main(Launcher.java:298)

"VM Thread" os_prio=0 tid=0xf705e000 nid=0x15ed runnable

"VM Periodic Task Thread" os_prio=0 tid=0xf7087800 nid=0x15f3 waiting on condition

JNI global references: 268
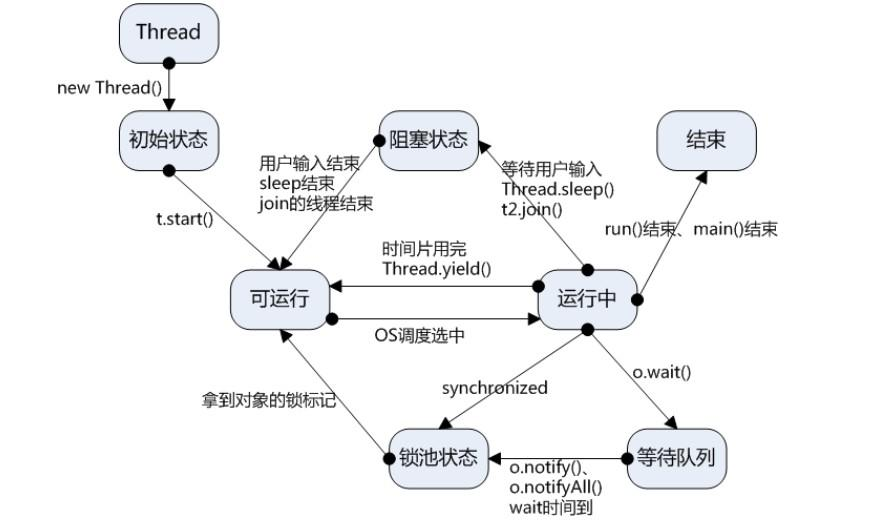
线程状态图
jstack统计线程数:
jstack 5611 | grep 'java.lang.Thread.State' | wc -l
举例说明CPU高获取其线程ID然后分析
以我们最近出现的一个实际故障为例,介绍怎么定位和解决这类问题。
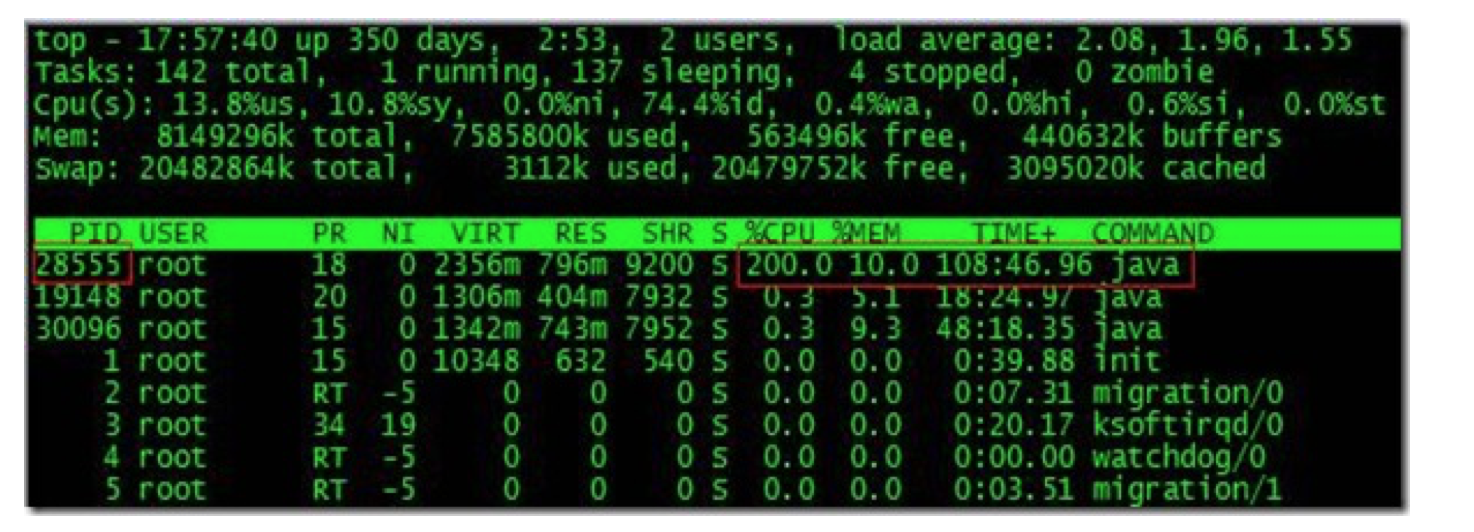
根据top命令,发现PID为28555的Java进程占用CPU高达200%,出现故障。
通过ps aux | grep PID命令,可以进一步确定是tomcat进程出现了问题。但是,怎么定位到具体线程或者代码呢?
首先显示线程列表:
ps -mp pid -o THREAD,tid,time
找到了耗时最高的线程28802,占用CPU时间快两个小时了!
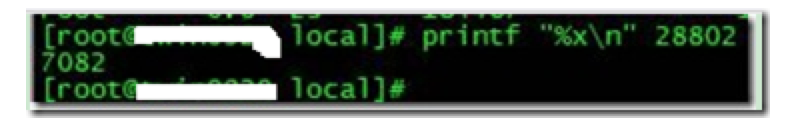
其次将需要的线程ID转换为16进制格式:
printf "%x\n" tid
最后打印线程的堆栈信息:
jstack pid |grep tid -A 30
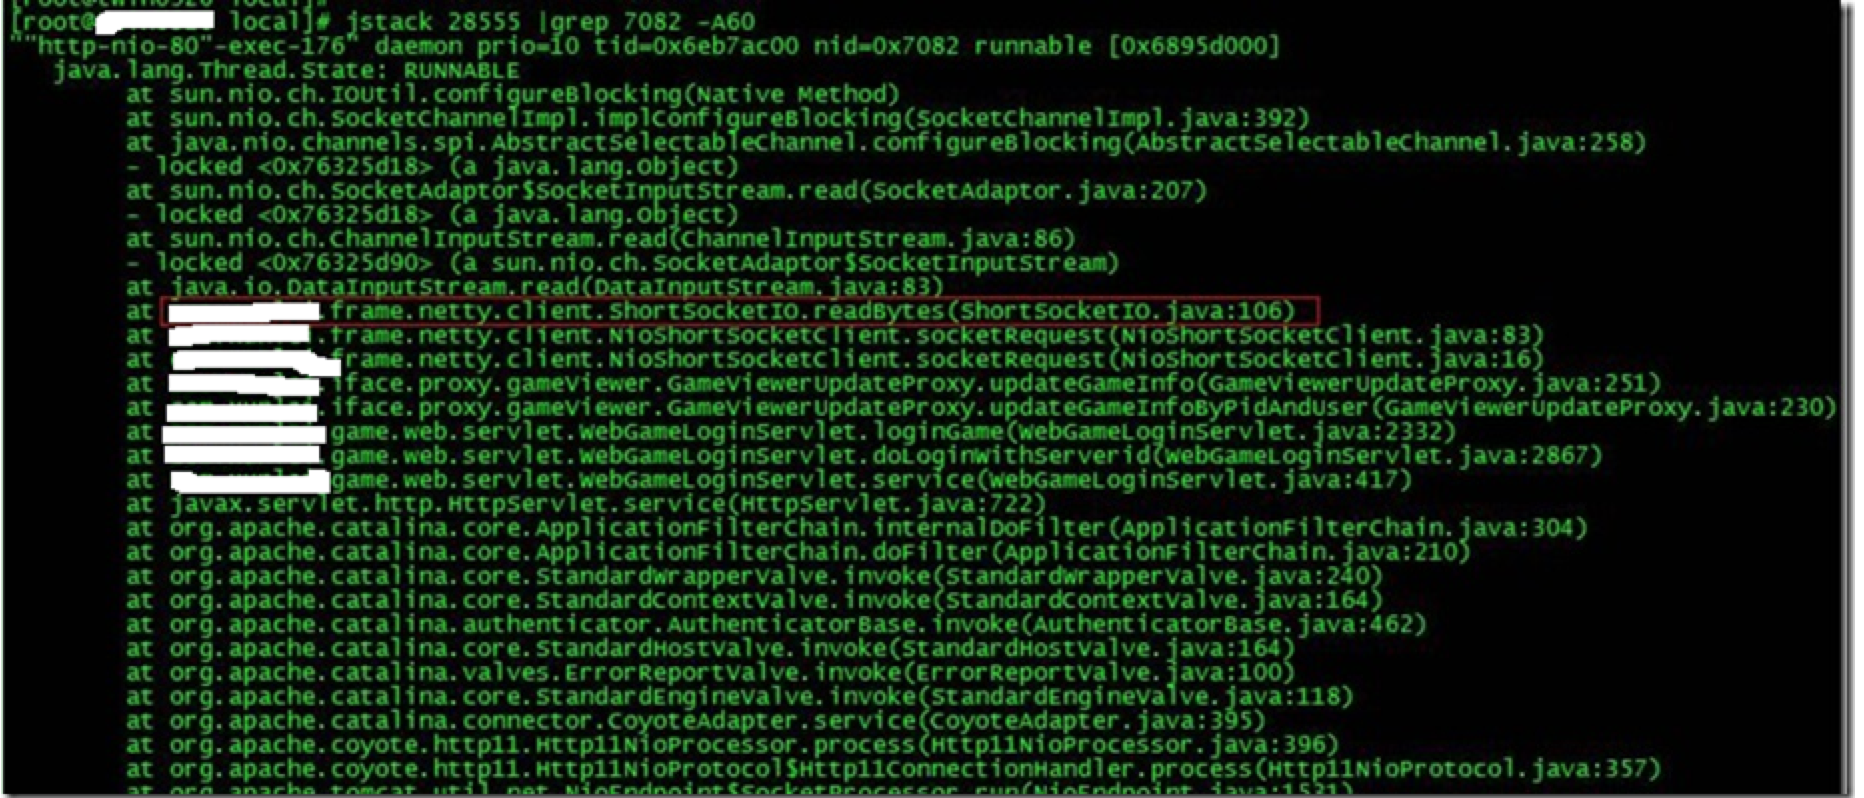
找到出现问题的代码了!
现在来分析下具体的代码:ShortSocketIO.readBytes(ShortSocketIO.java:106)
ShortSocketIO是应用封装的一个用短连接Socket通信的工具类。readBytes函数的代码如下:
public byte[] readBytes(int length) throws IOException {

    if ((this.socket == null) || (!this.socket.isConnected())) {

        throw new IOException("++++ attempting to read from closed socket");

    }

    byte[] result = null;

    ByteArrayOutputStream bos = new ByteArrayOutputStream();

    if (this.recIndex >= length) {

           bos.write(this.recBuf, 0, length);

           byte[] newBuf = new byte[this.recBufSize];

           if (this.recIndex > length) {

               System.arraycopy(this.recBuf, length, newBuf, 0, this.recIndex - length);

           }

           this.recBuf = newBuf;

           this.recIndex -= length;

    } else {

           int totalread = length;

           if (this.recIndex > 0) {

                totalread -= this.recIndex;

                bos.write(this.recBuf, 0, this.recIndex);

                this.recBuf = new byte[this.recBufSize];

                this.recIndex = 0;

    }

    int readCount = 0;

  **  while (totalread > 0) {

         if ((readCount = this.in.read(this.recBuf)) > 0) **{

                if (totalread > readCount) {

                      bos.write(this.recBuf, 0, readCount);

                      this.recBuf = new byte[this.recBufSize];

                      this.recIndex = 0;

               } else {

                     bos.write(this.recBuf, 0, totalread);

                     byte[] newBuf = new byte[this.recBufSize];

                     System.arraycopy(this.recBuf, totalread, newBuf, 0, readCount - totalread);

                     this.recBuf = newBuf;

                     this.recIndex = (readCount - totalread);

             }

             totalread -= readCount;

        }

   }

}
问题就出在加粗的代码部分。如果this.in.read()返回的数据小于等于0时,循环就一直进行下去了。而这种情况在网络拥塞的时候是可能发生的。
至于具体怎么修改就看业务逻辑应该怎么对待这种特殊情况了。
最后,总结下排查CPU故障的方法和技巧有哪些:
1、top命令:Linux命令。可以查看实时的CPU使用情况。也可以查看最近一段时间的CPU使用情况。
2、PS命令:Linux命令。强大的进程状态监控命令。可以查看进程以及进程中线程的当前CPU使用情况。属于当前状态的采样数据。
3、jstack:Java提供的命令。可以查看某个进程的当前线程栈运行情况。根据这个命令的输出可以定位某个进程的所有线程的当前运行状态、运行代码,以及是否死锁等等。
4、pstack:Linux命令。可以查看某个进程的当前线程栈运行情况。
Java 系统性能分析 命令
- cpu分析
top , pidstat(sysstat)
pid -p PID -t 1 10
vmstat 1 CPU上下文切换、运行队列、利用率
ps Hh -eo tid
pcpu 查看具体线程的CPU消耗
sar 来查看一定世界范围内以及历史的cpu消耗情况信息
查看java线程信息
jstack pid | grep 'nid=0x9999'
cs sy消耗比较高
上下文切换性能偏高, jstack -l pid, 查看on object monitorio消耗
pidstat -d -t -p pid 1 100
iostat网络io消耗
cat /proc/interruptes
sar -n FULL 1 2
性能调优命令之jstack的更多相关文章
- 盘点linux系统中的12条性能调优命令。
导读 性能调优一直是运维工程师最重要的工作之一,如果您所在的生产环境中遇到了系统响应速度慢,硬盘IO吞吐量异常,数据处理速度低于预期值的情况,又或者如CPU.内存.硬盘.网络等系统资源长期处于耗尽的状 ...
- 盘点linux操作系统中的10条性能调优命令,一文搞懂Linux系统调优
原文链接:猛戳这里 性能调优一直是运维工程师最重要的工作之一,如果您所在的生产环境中遇到了系统响应速度慢,硬盘IO吞吐量异常,数据处理速度低于预期值的情况,又或者如CPU.内存.硬盘.网络等系统资源长 ...
- 【十三】jvm 性能调优工具之 jstack
一.介绍 jstack是java虚拟机自带的一种堆栈跟踪工具.jstack用于打印出给定的java进程ID或core file或远程调试服务的Java堆栈信息,如果是在64位机器上,需要指定选项&qu ...
- Linux性能调优命令之free
功能说明 free 命令显示系统使用和空闲的内存情况,包括物理内存.交互区内存(swap)和内核缓冲区内存.共享内存将被忽略 语法 free [参数] 参数 -b : 以Byte为单位显示内存使用情况 ...
- JVM性能调优监控命令jps、jinfo、jstat、jmap+jhat、jstack使用详解
JDK本身提供了很多方便的JVM性能调优监控工具,除了集成式的VisualVM和jConsole外,还有jps.jinfo.jstat.jmap+jhat.jstack等小巧的工具,本博客希望能起抛砖 ...
- JVM性能调优监控工具jps、jstack、jmap、jhat、jstat、hprof使用详解
摘要: JDK本身提供了很多方便的JVM性能调优监控工具,除了集成式的VisualVM和jConsole外,还有jps.jstack.jmap.jhat.jstat.hprof等小巧的工具,本博客希望 ...
- JVM性能调优监控工具jps、jstack、jmap、jhat、jstat使用详解(转VIII)
JVM本身就是一个java进程,一个java程序运行在一个jvm进程中.多个java程序同时运行就会有多个jvm进程.一个jvm进程有多个线程至少有一个gc线程和一个用户线程. JDK本身提供了很多方 ...
- 《转》:JVM性能调优监控工具jps、jstack、jmap、jhat、jstat、hprof使用详解
原链接:https://my.oschina.net/feichexia/blog/196575 现实企业级Java开发中,有时候我们会碰到下面这些问题: OutOfMemoryError,内存不足 ...
- 【转】JVM性能调优监控工具jps、jstack、jmap、jhat、jstat使用详解
http://www.cnblogs.com/therunningfish/p/5524238.html JDK本身提供了很多方便的JVM性能调优监控工具,除了集成式的VisualVM和jConsol ...
随机推荐
- CentOS7 常用基础操作
系统目录结构了解 CentOS系统中没有磁盘的概念,一切皆文件,/目录下的的一个个文件夹目录就相当于磁盘了,这里简单记录几个常用的目录以及对应的作用: dev:Linux一切皆文件,包括硬件也进行了文 ...
- 01- Python语言简介
Python的简介: 创始人:Guido van Rossum(创始人) 时间:1989年 圣诞节 Python的命名:源于一个喜剧团 Monty Python Python语言排名 目前Python ...
- Thinkphp5之laypage分页插件的实现
//一下是laypage所用到的 js <script type="text/javascript" src="__STATIC__/lib/laypage/1.2 ...
- Windows 签名伪造工具的使用,Python,签名
#!/usr/bin/env python3 # LICENSE: BSD-3 # Copyright: Josh Pitts @midnite_runr import sys import stru ...
- 分子动力学模拟软件VMD的安装与使用
技术背景 在分子动力学模拟过程中会遇到一些拓扑结构非常复杂的分子模型,所谓的复杂不仅仅是包含众多的原子,还有各种原子之间的成键关系与成键类型等.这时候就非常能够体现一个好的可视化软件的重要性了,这里我 ...
- 微信小程序支付功能完整流程
支付流程 整个支付流程分为四个步骤: 获取令牌token 创建订单 预支付,获取支付参数对象pay 发起微信支付 收尾工作.跳转到订单页面,删除购物车中已购买的商品 请求方式:POST 整个支付过程中 ...
- v-on精炼
v-on的介绍 在Vue中,常使用v-on指令用于监听事件的发生,v-on指令就类似于JavaScript中的addEvelistener()方法 v-on的基本使用 <div id=" ...
- 脱壳入门----脱ASPack壳保护的DLL
前言 结合脱dll壳的基本思路,对看雪加密解密里的一个ASPack壳保护的dll进行脱壳分析. 脱壳详细过程 寻找程序的OEP 先将目标DLL拖入OD,来到壳的入口处. 然后利用堆栈平衡原理在push ...
- Java版的扫雷游戏源码
package com.xz.sl; import java.awt.BorderLayout; import java.awt.Color; import java.awt.Container; i ...
- C++ primer plus读书笔记——第5章 循环和关系表达式
第5章 循环和关系表达式 1. cout.setf(ios_base::boolalpha); cout << (100 > 3) << endl;将输出true,而不是 ...