Spring Boot Memory Performance
Relic. Quickly learn how to use Docker
and containers in general to create packaged images for easy management, testing, and deployment of software.
It has sometimes been suggested that Spring and Spring Boot are “heavyweight”, perhaps just because they allow apps to punch above their weight, providing a lot of features for not very much user
code. In this article we concentrate on memory usage and ask if we can quantify the effect of using Spring? Specifically we would like to know more about the real overhead of using Spring compared to other JVM applications. We start by creating a basic application
with Spring Boot, and look at a few different ways to measure it when it is running. Then we look at some comparison points: plain Java apps, apps that use Spring but not Spring Boot, an app that uses Spring Boot but no autoconfiguration, and some Ratpack
sample apps.
Vanilla Spring Boot App
As a baseline we build a static app with a few webjars and spring.resources.enabled=true.
This is perfectly fine for serving nice-looking static content maybe with a REST endpoint or two. The source code for the app we used to test is in
github. You can build it with the mvnw wrapper script if you have a JDK 1.8 available and on your path (mvnw). It can be launched like this:
package
$ java -Xmx32m -Xss256k -jar target/demo-0.0.1-SNAPSHOT.jar
The we add some load, just to warm up the thread pools and force all the code paths to be exercised:
$ ab -n 2000 -c 4 http://localhost:8080/
We can try and limit threads a bit in application.properties:
server.tomcat.max-threads: 4
but in the end it doesn’t make a lot of difference to the numbers. We conclude from the analysis below that it would save at most a MB with the stack size we are using. All the Spring Boot webapps
we analyse have this same configuration.
We might have to worry about how big the classpath is, in order to estimate what happens to the memory. Despite some claims in the internet that the JVM memory maps all jars on the classpath, we
actually don’t find any evidence that the size of the classpath has any effect on the running app. For reference, the size of the dependency jars (not including JDK) in the vanilla sample is 18MB:
$ jar -tvf target/demo-0.0.1-SNAPSHOT.jar | grep lib/.*.jar | awk '{tot+=$1;} END {print tot}'
18893563
This includes Spring Boot Web and Actuator starters, plus 3 or 4 webjars for static resources and the webjar locator. A completely minimal Spring Boot application including Spring and some logging
but no web server would be around 5MB of jars.
JVM Tools
To measure memory usage there are some tools in the JVM. You can get quite a lot of useful information from JConsole or JVisualVM (with the JConsole plugin so you can inspect MBeans).
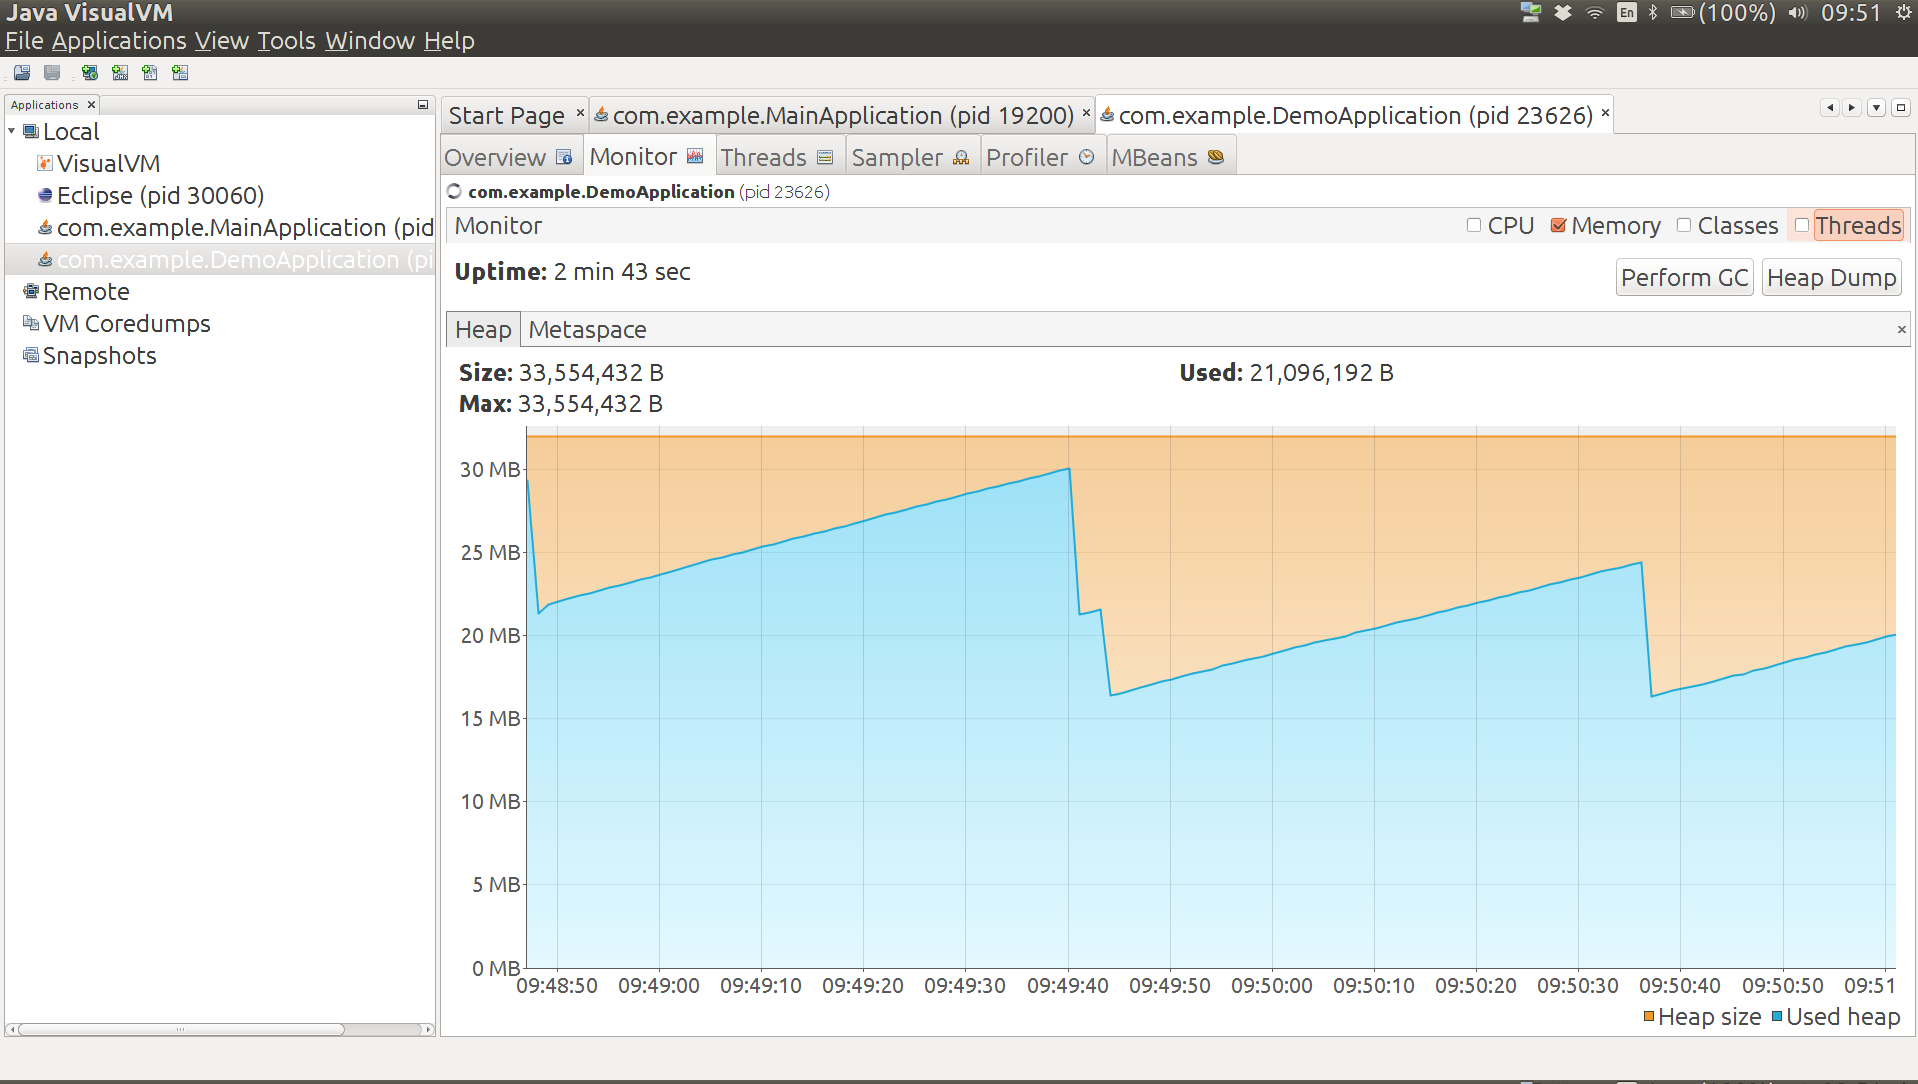
Heap usage for our vanilla app is a saw tooth, bounded above by the heap size and below by the amount of memory used in a quiescent state. The average weighs in at roughly 25MB for an app under
load (and 22MB after a manual GC). JConsole also reports 50MB non-heap usage (which is the same as you get from the java.lang:type=Memory MBean).
The non-heap usage breaks down as Metaspace: 32MB, Compressed Class Space: 4MB, Code Cache: 13MB (you can get these numbers from the java.lang:type=MemoryPool,name=* MBeans).
There are 6200 classes and 25 threads, including a few that are added by the monitoring tool that we use to measure them.
Here’s a graph of the heap usage from a quiescent app under load,
followed by a manual garbage collection (the double nick in the
middle) and a new equilibrium with a lower heap usage.
Some tools in the JVM other than JConsole might also be
interesting. The first is jps which is useful for getting the
process id of the app you want to inspect with the other tools:
$ jps
4289 Jps
4330 demo-0.0.1-SNAPSHOT.jar
Then we have the jmap histogram:
$ jmap -histo 4330 | head
num #instances #bytes class name
----------------------------------------------
1: 5241 6885088 [B
2: 21233 1458200 [C
3: 2548 1038112 [I
4: 20970 503280 java.lang.String
5: 6023 459832 [Ljava.lang.Object;
6: 13167 421344 java.util.HashMap$Node
7: 3386 380320 java.lang.Class
This data is of limited use because you can’t trace the “big” objects back to their owners. For that you need a more fully featured profiler, like YourKit. YourKit does the aggregation for you and
presents a list (although the details of how it does that are rather unclear).
Classloader statistics might also be revealing, and jmap has a way to inspect the classloaders
in an app. It needs to run as root:
$ sudo ~/Programs/jdk1.8.0/bin/jmap -clstats 4330
Attaching to process ID 4330, please wait...
Debugger attached successfully.
Server compiler detected.
JVM version is 25.60-b23
finding class loader instances ..done.
computing per loader stat ..done.
please wait.. computing liveness....................................liveness analysis may be inaccurate ...
class_loader classes bytes parent_loader alive? type
<bootstrap>21233609965 null live<internal>
0x00000000f4b0d730114760x00000000f495c890deadsun/reflect/DelegatingClassLoader@0x0000000100009df8
0x00000000f5a26120114830x00000000f495c890deadsun/reflect/DelegatingClassLoader@0x0000000100009df8
0x00000000f52ba3a811472 null deadsun/reflect/DelegatingClassLoader@0x0000000100009df8
0x00000000f5a3052018800x00000000f495c890deadsun/reflect/DelegatingClassLoader@0x0000000100009df8
0x00000000f495c890397263629020x00000000f495c8f0deadorg/springframework/boot/loader/LaunchedURLClassLoader@0x0000000100060828
0x00000000f5b639b0114730x00000000f495c890deadsun/reflect/DelegatingClassLoader@0x0000000100009df8
0x00000000f4b80a30114730x00000000f495c890deadsun/reflect/DelegatingClassLoader@0x0000000100009df8
...
total = 93630010405986 N/A alive=1, dead=92 N/A
There are loads of “dead” entries, but there is also a warning that the liveness information is not accurate. A manual GC doesn’t get rid of them.
Kernel Memory Tools
You would think that a Linux OS would provide plenty of insight into a running process, and it does, but Java processes are notoriously hard to analyse. This popular
SO link talks about some of the problems in general. Lets have a look at some of the tools that are available and see what they tell us about our app.
First up is the good old ps (the tool you use to look at processes on the command line).
You can get a lot of the same information from top. Here’s our application process:
$ ps -au
USER PID %CPU %MEM VSZ RSS TTY STAT START TIME COMMAND
dsyer 4330 2.4 2.1 2829092 169948 pts/5 Sl 18:03 0:37 java -Xmx32m -Xss256k -jar target/demo-0.0.1-SNAPSHOT.jar
...
RSS (Resident Set Size) values are in the range 150-190MB according to ps. There is
a tool calledsmem that is supposed to give a more sanitized view, and to accurately reflect non-shared memory, but the values there (for instance
of PSS) aren’t that different. Interestingly the PSS values for a non-JVM process are usually *significantly* lower than RSS, whereas for a JVM they are comparable. The JVM is very jealous of its memory.
A lower level tool is pmap, where we can look at the memory
allocations assigned to a process. Numbers from pmap don’t seem to
make much sense either:
$ pmap 4330
0000000000400000 4K r-x-- java
0000000000600000 4K rw--- java
000000000184c000 132K rw--- [ anon ]
00000000fe000000 36736K rw--- [ anon ]
00000001003e0000 1044608K ----- [ anon ]
...
00007ffe2de90000 8K r-x-- [ anon ]
ffffffffff600000 4K r-x-- [ anon ]
total 3224668K
i.e. over 3GB for a process that we know is only using 80MB. Just counting the ‘—–’ entries gives you nearly all the 3GB. At least that’s consistent with the VSZ numbers from ps,
but not very useful for capacity management.
Someone commented that the RSS values were accurate on his machine, which is interesting. They definitely didn’t work for me (Ubuntu 14.04 on Lenovo Thinkpad). Also, here’s another interesting article
on JVM memory
stats in Linux.
Scale Up Processes
A good test of how much memory is actually being used by a process is to keep launching more of them until the operating system starts to crumple. For example, to launch 40 identical vanilla processes:
$ for f in {8080..8119}; do (java -Xmx32m -Xss256k -jar target/demo-0.0.1-SNAPSHOT.jar --server.port=$f 2>&1 > target/$f.log &); done
They are all competing for memory resources so it takes them all a while to start, which is fair enough. Once they all start they serve their home pages quite efficiently (51ms latency over a crappy
LAN at 99th percentile). Once they are up and running, stopping and starting one of the processes is relatively quick (a few seconds not a few minutes).
The VSZ numbers from ps are off the scale (as expected). The RSS numbers look high too:
$ ps -au
USER PID %CPU %MEM VSZ RSS TTY STAT START TIME COMMAND
dsyer 27429 2.4 2.1 2829092 169948 pts/5 Sl 18:03 0:37 java -Xmx32m -Xss256k -jar target/demo-0.0.1-SNAPSHOT.jar --server.port=8081
dsyer 27431 3.0 2.2 2829092 180956 pts/5 Sl 18:03 0:45 java -Xmx32m -Xss256k -jar target/demo-0.0.1-SNAPSHOT.jar --server.port=8082
...
RSS values are still in the range 150-190MB. If all 40 processes were indepenently using this much memory that would account for 6.8GB, which would blow my 8GB laptop out of the water. It runs fine,
so most of that RSS value is not really independent of other processes.
The Proportional Shared Size (PSS) from smem might a better estimate we have of actual
memory usage, but in fact it is not that different from the RSS values:
$ smem
PID User Command Swap USS PSS RSS
...
27435 dsyer java -Xmx32m -Xss256k -jar 0 142340 142648 155516
27449 dsyer java -Xmx32m -Xss256k -jar 0 142452 142758 155568
...
27441 dsyer java -Xmx32m -Xss256k -jar 0 175156 175479 188796
27451 dsyer java -Xmx32m -Xss256k -jar 0 175256 175579 188900
27463 dsyer java -Xmx32m -Xss256k -jar 0 179592 179915 193224
We can hypothesize that maybe the PSS number is still hugely inflated by shared read-only memory (e.g. mapped jar files).
The 40 processes pretty much filled up the available memory on my laptop (3.6GB before the apps started), and some paging was happening, but not much. We can turn that into an estimate of the process
size: 3.6GB/40 = 90MB. Not far off the JConsole estimate.
Do Nothing Plain Java App
As a useful comparison point, let’s make a really basic Java application that stays alive when we run it so we can meaure its memory consumption:
public class Main throws Exception {
public static void main (String[] args) {
System.in.read();
}
}
Results: heap 6MB, non-heap 14MB (Code Cache 4MB, Compressed Class Space 1MB, Metaspace 9MB), 1500 classes. Hardly any classes loaded so no surprise really.
Do Nothing Spring Boot App
Now suppose we do the same thing but load a Spring application context as well:
@SpringBootApplication
public class MainApplication implements ApplicationRunner {
@Override
public void run(ApplicationArguments args) throws Exception {
System.in.read();
}
public static void main(String[] args) throws Exception {
SpringApplication.run(MainApplication.class, args);
}
}
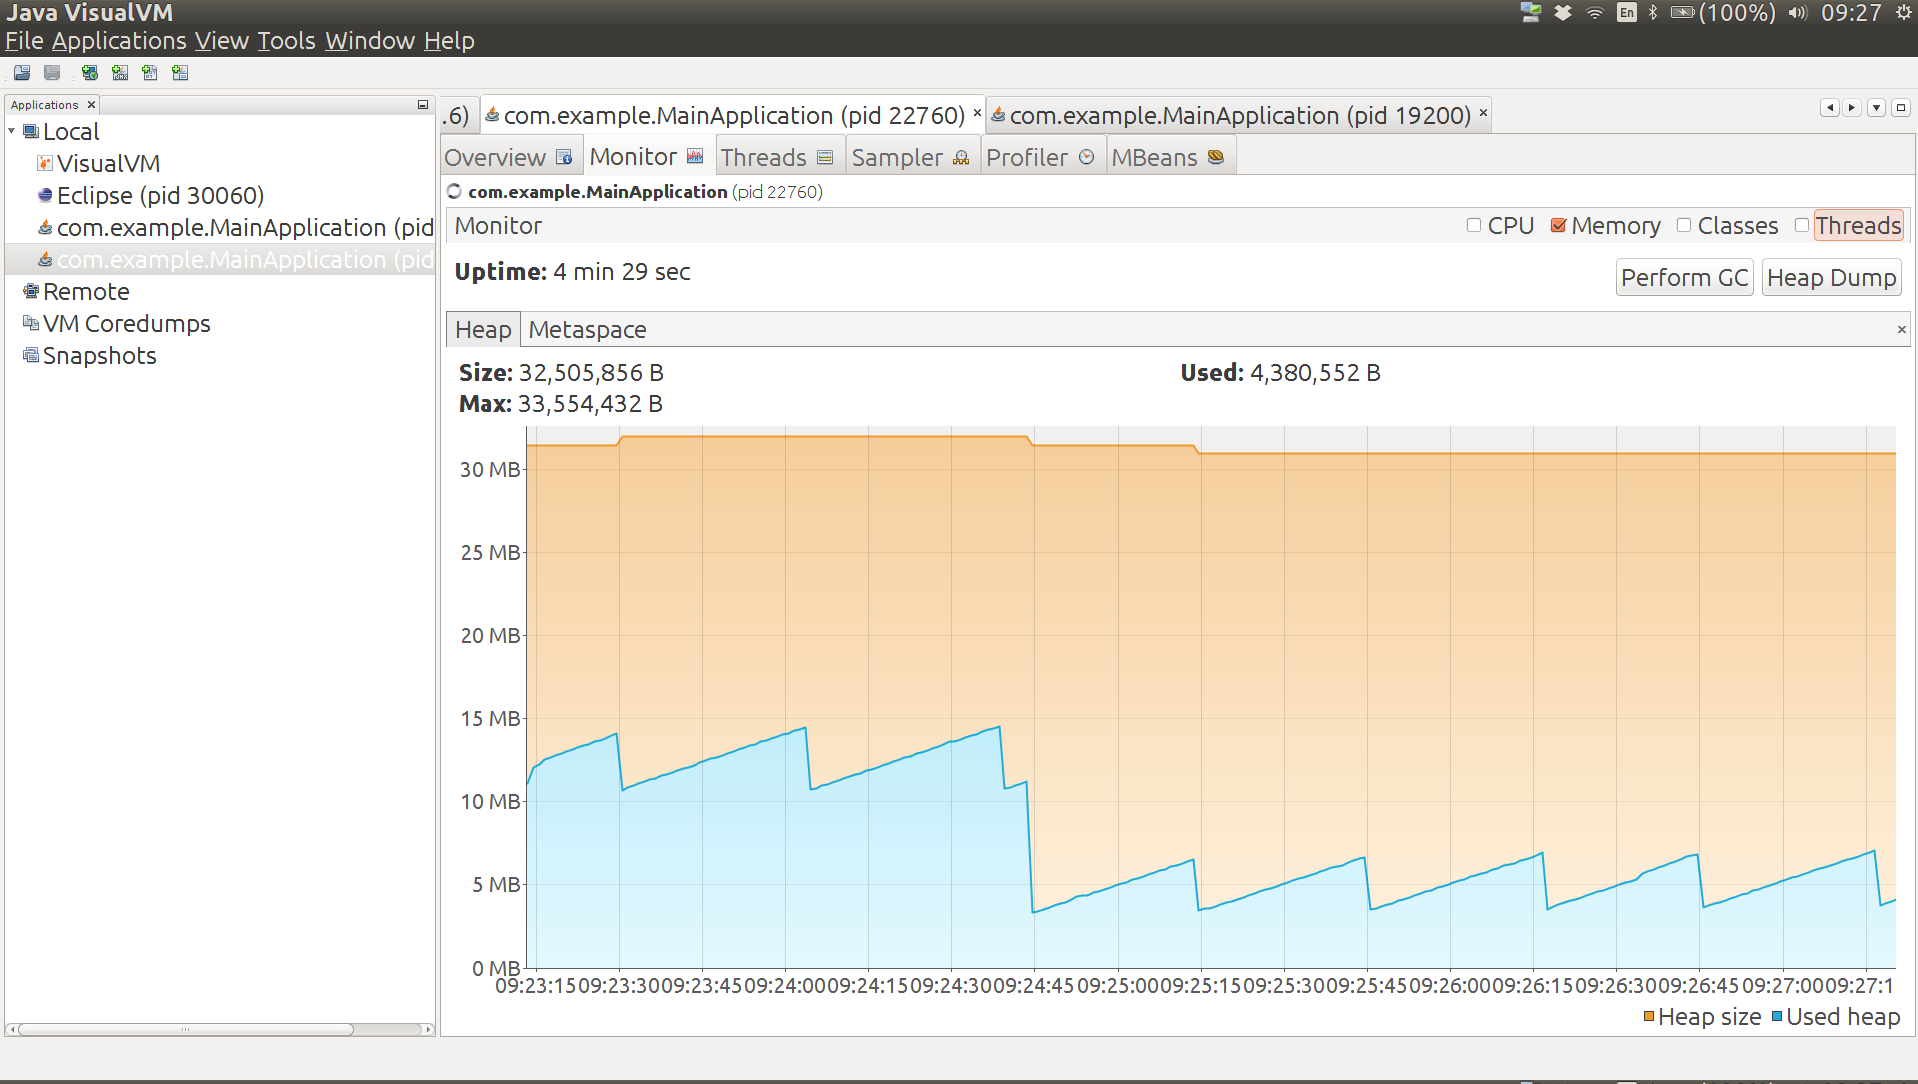
Heap 12MB (but drops to 6MB after a manual GC), non-heap 26MB (Code Cache 7MB, Compressed Class Space 2MB, Metaspace 17MB), 3200 classes. The graph below shows the heap usage from launching the
app to the end state. The big drop in the middle is the manual GC, and you can see that after this the app stabilizes at a different saw tooth.
Does Spring Boot itself (as opposed to just Spring) add a lot of overhead to this application? For starters, we can test that by removing the @SpringBootApplication annotation.
Doing that means that we load a context but don’t do any autoconfiguration. The result is: heap 11MB (drops to 5MB after a manual GC), non-heap 22MB (Code Cache 5MB, Compressed Class Space 2MB, Metaspace 15MB), 2700 classes. The Spring Boot autoconfiguration
premium, measured this way, is about 1MB heap and 4MB non-heap.
Going a step further, we can create a Spring application context manually without using any Spring Boot code at all. Doing this drops the heap usage to 10MB (drops to 5MB after a manual GC), non-heap
to 20MB (Code Cache 5MB, Compressed Class Space 2MB, Metaspace 13MB), 2400 classes. The Spring Boot total premium, measured this way, is less than 2MB heap and about 6MB non-heap memory.
Ratpack Groovy App
A simple Ratpack groovy app can be created using lazybones:
$ lazybones create ratpack .
$ ./gradlew build
$ unzip build/distributions/ratpack.zip
$ JAVA_OPTS='-Xmx32m -Xss256k' ./ratpack/bin/ratpack
$ ls -l build/distributions/ratpack/lib/*.jar | awk '{tot+=$5;} END {print tot}'
16277607
The used heap is pretty low to start with (13MB), grows to 22MB over time. Metaspace is about 34MB. JConsole reports 43MB non-heap usage. There are 31 threads.
Ratpack Java App
Here’s a really basic static app:
import ratpack.server.BaseDir;
import ratpack.server.RatpackServer;
public class DemoApplication {
public static void main(String[] args) throws Exception {
RatpackServer.start(s -> s
.serverConfig(c -> c.baseDir(BaseDir.find()))
.handlers(chain -> chain
.all(ctx -> ctx.render("root handler!"))
)
);
}
}
It runs in about 16MB heap, 28MB non-heap as a Spring Boot fat jar. As a regular gradle application it’s a bit lighter on heap (the cached jars aren’t needed) but uses the same non-heap memory.
There are 30 threads. Interestingly there is no object that is bigger than 300KB, whereas our Spring Boot apps with Tomcat generally have 10 or more objects above that level.
Variations on the Vanilla App
Running from exploded jar shaves up to 6MB off the heap (the difference is cached jar data in the launcher). Also makes startup a bit faster: less than 5s compared to as much as 7s when memory is
constrained with the fat jar.
A slimmed down version of the app with no static resources or webjars runs at 23MB heap and 41MB non-heap as exploded archive (starts in less than 3s). The non-heap usage breaks down as Metaspace:
35MB, Compressed Class Space: 4MB, Code Cache: 4MB. Spring ReflectionUtils jumps to near the top of the memory chart in YourKit with Spring 4.2.3
(2nd only to Tomcat NioEndpoint). The ReflectionUtils should
shrink under memory pressure but they don’t in practice so Spring 4.2.4 clears the caches once the context has
started, resulting in some memory savings (down to about 20MB heap). DefaultListableBeanFactory drops down to 3rd place and is almost half the size
it was with the resource chain (webjars locator) but it won’t shrink any further without removing more features.
In turns out that the NioEndpoint has a 1MB “oom parachute” that it holds onto until
it detects anOutOfMemoryError. You can customize it to zero and forgo the parachute to save an extra MB of heap, e.g:
@SpringBootApplication
public class SlimApplication implements EmbeddedServletContainerCustomizer {
@Override
public void customize(ConfigurableEmbeddedServletContainer container) {
if (container instanceof TomcatEmbeddedServletContainerFactory) {
TomcatEmbeddedServletContainerFactory tomcat = (TomcatEmbeddedServletContainerFactory) container;
tomcat.addConnectorCustomizers(connector -> {
ProtocolHandler handler = connector.getProtocolHandler();
if (handler instanceof Http11NioProtocol) {
Http11NioProtocol http = (Http11NioProtocol) handler;
http.getEndpoint().setOomParachute(0);
}
});
}
}
...
}
Using Jetty instead of Tomcat makes no difference whatsoever to the overall memory or heap, even though the NioEndpoint is
high on the “Biggest objects” list in YourKit (takes about 1MB), and there is no corresponding blip for Jetty. It also doesn’t start up any quicker.
As an example of a “real” Spring Boot app, Zipkin (Java) runs fine with with -Xmx32m -Xss256k,
at least for short periods. It settles with a heap of about 24MB and non-heap about 55MB.
The spring-cloud-stream sample sink (with Redis transport) also runs fine with -Xmx32m and similar memory usage profile (i.e. roughly 80MB total). The actuator endpoints are active but don’t do much to the memory profile. Slightly slower startup maybe.
-Xss256k
Tomcat Container
Instead of using the emedded container in Spring Boot, what if we deploy a traditional war file to a Tomcat container?
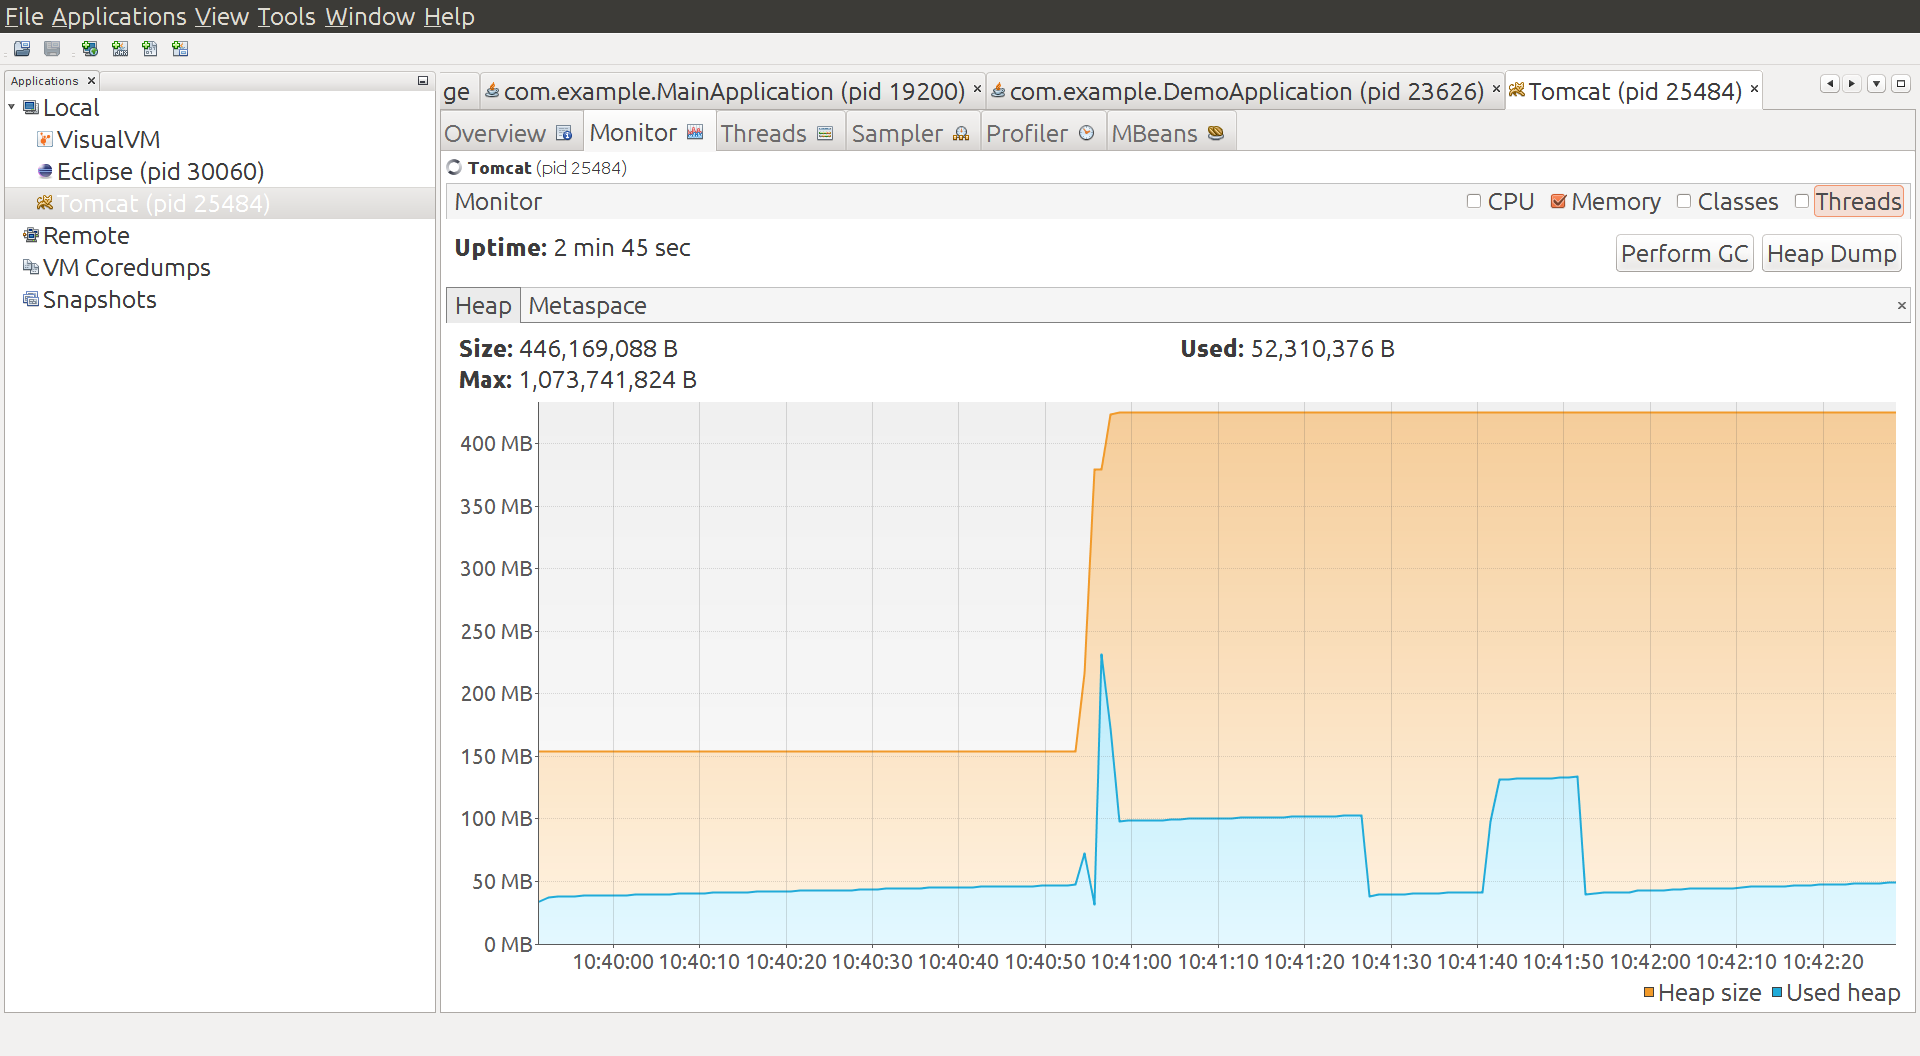
The container starts and warms up a bit and uses of order 50MB heap, and 40MB non-heap. Then we deploy a war of the vanilla Spring Boot app, and there’s a spike in heap usage, which settles down
to about 100MB. We do a manual GC and it drops down to below 50MB, and then add some load and it jumps up to about 140MB. A manual GC drops it back down to below 50MB. So we have no reason to believe this app is really using much if any additional heap compared
to the container. It uses some when under load, but it can always reclaim it under GC pressure.
Metaspace, however tells a different story, it goes up from 14MB to 41MB in the single app under load. Total non-heap usage is reported at 59MB in the final state.
Deploy Another Application
If we add another copy of the same application to the Tomcat container, trough heap consumption goes up a bit (above 50MB) and metaspace is up to 55MB. Under load heap usage jumps to 250MB or so,
but always seems to be reclaimable.
Then we add some more apps. With six apps deployed the metaspace is up to 115MB and total non-heap to 161MB. This is consistent with what we saw for a single app: each one costs us about 20MB non-heap
memory. Heap usage hits 400MB under load, so this doesn’t go up proportionally (however it is being managed from above, so maybe that’s not surprising). The trough of heap usage is up to about 130MB, so the cumulative effect of adding apps on the heap is visible
there (about 15MB per app).
When we constrain Tomcat to the same amount of heap that the six apps would have in our vanilla embedded launch (-Xmx192m)
the heap under load is more or less at its limit (190MB), and the trough after a manual GC is 118MB. Non-heap memory is reported as 154MB. The heap trough and non-heap usage is not identical but consistent with the unconstrained Tomcat instance (which actually
had a 1GB heap). Compared to the embedded containers the total memory usage, including the full heap, is a bit smaller because some of the non-heap memory is apparently shared between apps (344MB compared to 492MB). For more realistic apps that require more
heap themselves the difference will not be proportionally as big (50MB out of 8GB is negligible). Also any app that manages its own thread pool (not uncommon in real life Spring applications) will incur an additional non-heap memory penalty for the threads
it needs.
Rule of Thumb Process Sizes
A very rough estimate for actual memory usage would be the heap size plus 20 times the stack size (for the 20 threads typical in a servlet container), plus a bit, so maybe 40MB per process in our
vanilla app. That estimate is a bit low, given the JConsole numbers (50MB plus the heap, or 82MB). We can observe, though, that the non-heap usage in our apps is roughly proportional to the number of classes loaded. Once you correct for the stack size the
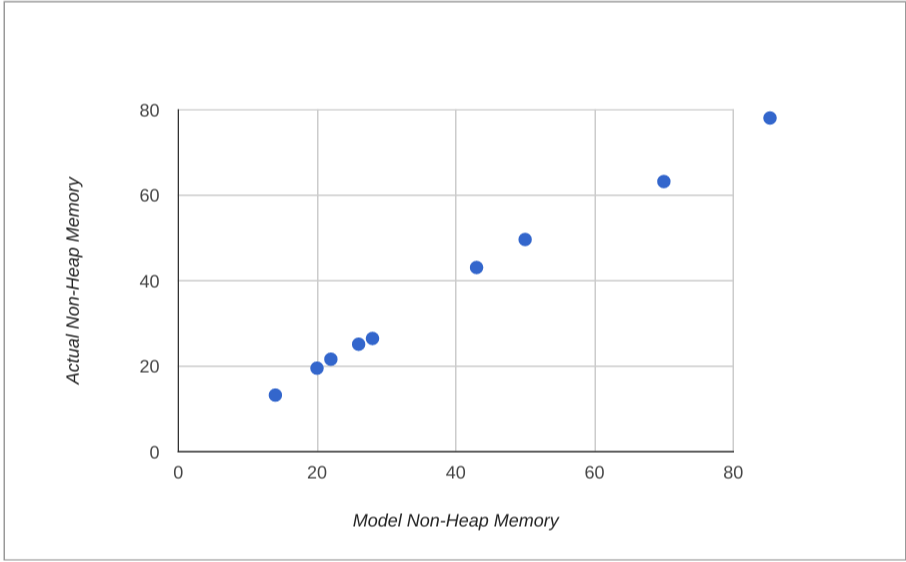
correlation improves, so a better rule of thumb might be one that is proportional to the number of classes loaded:
memory = heap + non-heap
non-heap = threads x stack + classes x 7/1000
The vanilla app loads about 6000 classes and the do nothing Java main loads about 1500. The estimate is accurate for the vanilla app and the do nothing Java app.
Adding Spring Cloud Eureka discovery only loads about another 1500 classes, and uses about 40 threads, so it should use a bit more non-heap memory, but not a lot (and indeed it does use about 70MB
with 256KB stacks, where the rule of thumb would predict 63MB).
The performance of this model for the apps we measured is shown below:
Summary of Data
Application Heap (MB) Non Heap (MB) Threads Classes Vanilla 22 50 25 6200 Plain Java 6 14 11 1500 Spring Boot 6 26 11 3200 No Actuator 5 22 11 2700 Spring Only 5 20 11 2400 Eureka Client 80* 70
40 7600 Ratpack Groovy 22 43 24 5300 Ratpack Java 16 28 22 3000
* Only the Eureka client has a larger heap: all the others are set
explicitly to -Xmx32m.
Conclusions
The effect Spring Boot on its own has on a Java application is to use a bit more heap and non-heap memory, mostly because of extra classes it has to load. The difference can be quantified as roughly
an extra 2MB heap and 12MB non-heap. In a real application that might consume many times as much for actual business purposes this is pretty insignificant. The difference between vanilla Spring and Spring Boot is a few MB total (neither here nor there really).
The Spring Boot team have only just started measuring things in this level of detail so we can probably expect optimizations in the future anyway. When we compare memory usage for apps deployed in a single Tomcat container with the same apps deployed as independent
processes, not surprisingly the single container packs the apps more densely in memory. The penalty for a standalone process is mainly related to non-heap usage though, which adds up to maybe 30MB per app when the number of apps is much larger than the number
of containers (and less otherwise). We wouldn’t expect this to increase as apps use more heap, so in most real apps it is not significant. The benefits of deploying an app as an independent process following the twelve-factor and
Cloud Native principles outweigh the cost of using a bit more memory in our opinion. As a final note, we observe that the native tools in the operating system are not nearly as good as the ones provided by the JVM, when you want to inspect a process and find
out about its memory usage.
Relic. Read more about providing a framework that gets you started on the right path to move your IT services to cloud
computing, and give you an understanding as to why certain applications should not move to the cloud.
Spring Boot Memory Performance的更多相关文章
- Spring Boot 性能优化
spring 框架给企业软件开发者提供了常见问题的通用解决方案,包括那些在未来开发中没有意识到的问题.但是,它构建的 J2EE 项目变得越来越臃肿,逐渐被 Spring Boot 所替代.Spring ...
- Spring boot 内存优化
转自:https://dzone.com/articles/spring-boot-memory-performance It has sometimes been suggested that Sp ...
- Spring Boot Logback应用日志
e Spring Boot Logback应用日志 2015-09-08 19:57 7673人阅读 评论(0) 收藏 举报 . 分类: Spring Boot(51) . 目录(?)[+] 日志对于 ...
- spring boot + embed tomcat + standalone jar的内存泄露问题
前一阵遇到了一个很坑的内存泄露问题,记录于此: 有个项目采用spring cloud重构后,部署到线上(其中有一个接口,大概每天调用量在1千万次左右),发现zabbix监控里,linux的可用内存一直 ...
- Spring BOOT PERFORMANCE
转自:http://www.alexecollins.com/spring-boot-performance/ 官方优化文档: https://spring.io/blog/2015/12/10/sp ...
- Complete Guide for Spring Boot Actuator
You are here to learn about Spring Boot Actuator for collecting metrics about your production grade ...
- 如何做自己的服务监控?spring boot 2.x服务监控揭秘
Actuator是spring boot项目中非常强大一个功能,有助于对应用程序进行监视和管理,通过 restful api请求来监管.审计.收集应用的运行情况,针对微服务而言它是必不可少的一个环节. ...
- 从实践出发:微服务布道师告诉你Spring Cloud与Spring Boot他如何选择
背景 随着公司业务量的飞速发展,平台面临的挑战已经远远大于业务,需求量不断增加,技术人员数量增加,面临的复杂度也大大增加.在这个背景下,平台的技术架构也完成了从传统的单体应用到微服务化的演进. 系统架 ...
- Spring Boot 容器选择 Undertow 而不是 Tomcat
Spring Boot 内嵌容器Undertow参数设置 配置项: # 设置IO线程数, 它主要执行非阻塞的任务,它们会负责多个连接, 默认设置每个CPU核心一个线程 # 不要设置过大,如果过大,启动 ...
随机推荐
- android Fragment相关概念简介
Fragment 详细介绍连接:http://blog.csdn.net/harvic880925/article/details/44927375 fragment是一种控制器对象,activity ...
- 创建以及加载模块【nodejs第四篇】
建立两个文件,文件一createModule.js ,文件二main.js createModule.js的代码,主要用于创建一个模块 /** * Created by Administrator o ...
- .Net跨平台中遇到的问题小结
一:创建MVC网站,需要修改Views视图文件夹下的Web.config 二:需要添加web.config中的 <system.web> <compilation debug=&qu ...
- Enum基础
enum ColorE { RED, GREEN, BLUE; } public class GetEnumContent { public static void main(Stri ...
- java计算器
由于自己的实验报告 需要用Java来写一个实验报告.自己本没有怎么学过Java,但是学的话也就认真的学一下,毕竟技术这条路线是技多不压身.于是在网站上找来了一些资料,关于Java到底是干什么的, ...
- Qgis插件开发之Qgis源码学习
Qgis源码中的拖拽.zoomin/out等各个基础功能插件的实现位于qgis_app工程中. 具体头文件为: \QGIS\src\app\qgisapp.h 根据此类可以逐个找到Qgis的基础插件的 ...
- 四轴飞行器1.6 emwin与ucgui的移植,汉字外挂字库移植和DEMO效果对比
飞控的遥控器打算自己做,这样全局都能掌握,可以通过遥控器对飞控的参数和飞行模式进行修改,而买遥控器是做不到这样的哈..以后做图传的时候,屏幕还可以实时现实摄像头拍回来的画面,挺好的哈.. 做遥控我们选 ...
- android小知识之意图(intent)
android中的意图有显示意图和隐式意图两种, 显示意图要求必须知道被激活组件的包和class 隐式意图只需要知道跳转activity的动作和数据,就可以激活对应的组件 A 主activity B ...
- Android 三大图片缓存原理、特性对比
这是我在 MDCC 上分享的内容(略微改动),也是源码解析第一期发布时介绍的源码解析后续会慢慢做的事. 从总体设计和原理上对几个图片缓存进行对比,没用到他们的朋友也可以了解他们在某些特性上的实现. 上 ...
- css em
em与px换算 任意浏览器的默认字体高度16px(16像素).所有未经调整的浏览器都符合: 1em=16px.那么,12px=0.75em,10px=0.625em.为了简化font-size的换算, ...