Linux Kernel Oops异常分析
0.linux内核异常常用分析方法
- 异常地址是否在0附近,确认是否是空指针解引用问题
- 异常地址是否在iomem映射区,确认是否是设备访问总线异常问题,如PCI异常导致的地址访问异常
- 异常地址是否在stack附近,如果相邻,要考虑是否被踩
- 比较delay reset/nmi watchdog等多种机制打印的栈信息,看看pc是否在动,确定是否是死锁
- 用SysRq判断是真死还是假死
- 通过反汇编获得发生异常的C代码段和函数,查找开源社区是否已有补丁修复
下面分别通过PowerPC和Mips64的2个异常例子详细讲解分析过程。
1.PowerPC小系统内核异常分析
1.1 异常打印
Unable to handle kernel paging request for data at address 0x36fef31e
Faulting instruction address: 0xc0088b8c
Oops: Kernel access of bad area, sig: 11 [#1]
PREEMPT SMP NR_CPUS=2
Modules linked in: ossmod tipc ohci_hcd ehci_hcd cmm uart1655x bcm334 bootflash mtdchar bsp_flash_init boardctrl 85xx_debug util
NIP: C0088B8C LR: C0088CF8 CTR: 00000000
REGS: ce283e20 TRAP: 0300 Not tainted (2.6.21.7-EMBSYS-CGEL-3.04.10.P6.F5)
MSR: 00021000 <ME> CR: 22004222 XER: 00000000
DAR: 36FEF31E, DSISR: 00800000
TASK = cffdf180[26] 'events/1' THREAD: ce282000 CPU: 1
GPR00: 00100100 CE283ED0 CFFDF180 CF528000 C09EA500 EFFEAD20 CF5188A0 00000000
GPR08: CF5188BC 00200200 36FEF31E D1FD7F9E 22004222 1010DA44 00000290 00000000
GPR16: 1011C858 100147F4 BF9BC9C4 10100000 00000001 C0460000 C06454CC 00000000
GPR24: C0640000 CE282000 C0640000 00000005 00000000 00000000 EFFE8EC0 CFFED958
NIP [C0088B8C] free_block+0xc4/0x16c
LR [C0088CF8] drain_array+0xc4/0x100
Pass 2: Checking directory structure
Pass 3: Checking directory connectivity
Pass 4: Checking reference counts
Call Trace:
[CE283ED0] [C06ABEC0] 0xc06abec0(unreliable)
[CE283EF0] [C0088CF8] drain_array+0xc4/0x100
[CE283F10] [C008A70C] cache_reap+0x94/0x13c
[CE283F30] [C003DA2C] run_workqueue+0xc4/0x198
[CE283F60] [C003E6D4] worker_thread+0x130/0x154
[CE283FB0] [C0042E80] kthread+0xd4/0x110
[CE283FF0] [C0011A70] original_kernel_thread+0x44/0x60Instruction dump:
5400cffe 0f000000 80c4001c 7d1cf214 3c000010 3d200020 80a8001c 60000100
81660000 61290200 81460004 3906001c <916a0000> 914b0004 90060000 91260004
------------[ cut here ]------------
Badness at c0011e4c [verbose debug info unavailable]
Call Trace:
[CE283C50] [C00080BC] show_stack+0x3c/0x1a0 (unreliable)
[CE283C80] [C018EA28] report_bug+0xb0/0xb8
[CE283C90] [C000EC94] program_check_exception+0xcc/0x4f8
[CE283CD0] [C0010BE4] ret_from_except_full+0x0/0x4c
[CE283D90] [C0640000] 0xc0640000
[CE283DD0] [C000E61C] die+0x1f0/0x27c
[CE283E00] [C0014B18] bad_page_fault+0x98/0xe8
[CE283E10] [C0010A88] handle_page_fault+0x7c/0x80
[CE283ED0] [C06ABEC0] 0xc06abec0
[CE283EF0] [C0088CF8] drain_array+0xc4/0x100
[CE283F10] [C008A70C] cache_reap+0x94/0x13c
[CE283F30] [C003DA2C] run_workqueue+0xc4/0x198
[CE283F60] [C003E6D4] worker_thread+0x130/0x154
[CE283FB0] [C0042E80] kthread+0xd4/0x110
[CE283FF0] [C0011A70] original_kernel_thread+0x44/0x60
1.2 Oops分析
Oops: Kernel access of bad area, sig: 11 [#1]
异常分类
Oops:内核态指令异常;
BUG:内核检测到逻辑异常(类似于assert),会影响内核的后续运行;
WARNING:类似于BUG,但是不会影响内核的后续运行;
PANIC:类似于BUG,系统不能继续运行,直接挂起或重启;
SOFTLOCK:长时间任务得不到调度;
异常信号
|
Signal |
Code |
Default Action |
Description |
|
SIGABRT |
6 |
A |
Process abort signal |
|
SIGALRM |
14 |
T |
Alarm clock |
|
SIGBUS |
10 |
A |
Access to an undefined portion of a memory object |
|
SIGCHLD |
18 |
I - Ignore the Signal |
Child process terminated, stopped, |
|
SIGCONT |
25 |
C - Continue the process |
Continue executing, if stopped. |
|
SIGFPE |
8 |
A |
Erroneous arithmetic operation. |
|
SIGHUP |
1 |
T |
Hangup. |
|
SIGILL |
4 |
A |
Illegal instruction. |
|
SIGINT |
2 |
T |
Terminal interrupt signal. |
|
SIGKILL |
9 |
T |
Kill (cannot be caught or ignored). |
|
SIGPIPE |
13 |
T - Abnormal termination of the process |
Write on a pipe with no one to read it. |
|
SIGQUIT |
3 |
A - Abnormal termination of the process |
Terminal quit signal. |
|
SIGSEGV |
11 |
A |
Invalid memory reference. |
|
SIGSTOP |
23 |
S - Stop the process |
Stop executing (cannot be caught or ignored). |
|
SIGTERM |
15 |
T |
Termination signal. |
|
SIGTSTP |
23 |
S |
Terminal stop signal. |
|
SIGTTIN |
26 |
S |
Background process attempting read. |
|
SIGTTOU |
27 |
S |
Background process attempting write. |
|
SIGUSR1 |
16 |
T |
User-defined signal 1. |
|
SIGUSR2 |
17 |
T |
User-defined signal 2. |
|
SIGPOLL |
22 |
T |
Pollable event. |
|
SIGPROF |
29 |
T |
Profiling timer expired. |
|
SIGSYS |
12 |
A |
Bad system call. |
|
SIGTRAP |
5 |
A |
Trace/breakpoint trap. |
|
SIGURG |
21 |
I |
High bandwidth data is available at a socket. |
|
SIGVTALRM |
28 |
T |
Virtual timer expired. |
|
SIGXCPU |
30 |
A |
CPU time limit exceeded. |
|
SIGXFSZ |
31 |
A |
File size limit exceeded |
Default Actions:
T - Abnormal termination of the process. The process is terminated with all the consequences of _exit() except that the status made available to wait() and waitpid() indicates abnormal termination by the specified signal.
A - Abnormal termination of the process. Additionally, implementation-defined abnormal termination actions, such as creation of a core file, may occur.
I - Ignore the signal.
S - Stop the process.
C - Continue the process, if it is stopped; otherwise, ignore the signal.
具体针对powerpc e500内核,异常与信号的对应关系如下:

所以有进程访问了超出其虚拟地址空间的地址,内核报SIGSEGV(segment fault)信号。
那是什么进程呢?
其他
#1,die_counter,表示Oops发生的次数,一般来说,如果有多条Oops,看第一条Oops信息,因为后面的Oops可能是第一条Oops的错误传播导致的。
1.3 寄存器分析
NIP: C0088B8C LR: C0088CF8 CTR: 00000000
NIP是next instruction pointer,值就是当前指令的地址。这里列出了3个寄存器的值。
LR是link register其值为上一条指令的地址。
CTR是count register,其值用于循环指令。
REGS: ce283e20 TRAP: 0300 Not tainted (2.6.21.7-EMBSYS-CGEL-3.04.10.P6.F5)
TRAP :异常处理函数入口地址;REGS :系统栈pt_regs的基址。pt_regs这个结构封装了需要在内核入口中保存的最少的状态信息。比如说每一次的系统调用、中断、陷阱、故障。
|
0x100: "(System Reset)" 0x200: "(Machine Check)" 0x300: "(Data Access)" 0x380: "(Data SLB Access)" 0x400: "(Instruction Access)" 0x480: "(Instruction SLB Access)" 0x500: "(Hardware Interrupt)" 0x600: "(Alignment)" 0x700: "(Program Check)" 0x800: "(FPU Unavailable)" 0x900: "(Decrementer)" 0xc00: "(System Call)" 0xd00: "(Single Step)" 0xf00: "(Performance Monitor)" 0xf20: "(Altivec Unavailable)" 0x1300: "(Instruction Breakpoint)" |
详细解释见《PowerPC™ e500 Core Family Reference Manual》“5.7 Interrupt Definitions”。
tainted :内核错误信息,由add_taint设置,解释如下:
|
* 'P' - Proprietary module has been loaded. * 'F' - Module has been forcibly loaded. * 'S' - SMP with CPUs not designed for SMP. * 'R' - User forced a module unload. * 'M' - System experienced a machine check exception. * 'B' - System has hit bad_page. * 'U' - Userspace-defined naughtiness. * 'D' - Kernel has oopsed before * 'A' - ACPI table overridden. * 'W' - Taint on warning. * 'C' - modules from drivers/staging are loaded. |
MSR: 00021000 <ME> CR: 22004222 XER: 00000000
DAR: 36FEF31E, DSISR: 00800000
MSR是machine state register;
CR是condition register;
XER为Integer Exception Register
DAR为data address register,其值为造成了内存访问异常的地址。E500中为Data Exception Address Register (DEAR)
DSISR为Data Storage Interrupt Status Register,是存储着发生内存访问异常原因的寄存器。E500中为Exception Syndrome Register (ESR)。0x00800000表示Store operation中的Alignment, data storage, data TLB error异常。
TASK = cffdf180[26] 'events/1' THREAD: ce282000 CPU: 1
cffdf180:进程task_struct结构体的地址;
26:进程号;
events/1:进程名;
THREAD:进程的内核栈起始地址;
CPU:当前CPU;
当前进程也就是'events/1进程,出现SIGSEGV异常了。
GPR00: 00100100 CE283ED0 CFFDF180 CF528000 C09EA500 EFFEAD20 CF5188A0 00000000
GPR08: CF5188BC 00200200 36FEF31E D1FD7F9E 22004222 1010DA44 00000290 00000000
GPR16: 1011C858 100147F4 BF9BC9C4 10100000 00000001 C0460000 C06454CC 00000000
GPR24: C0640000 CE282000 C0640000 00000005 00000000 00000000 EFFE8EC0 CFFED958
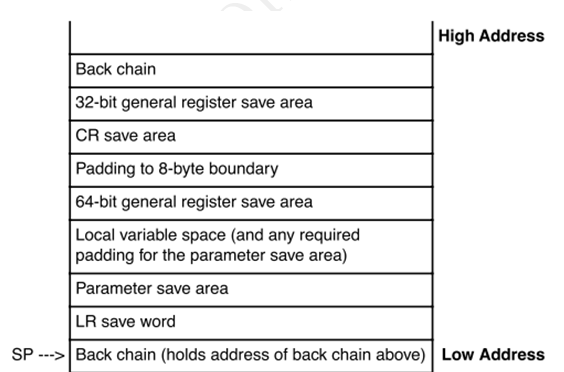
PowerPC的ABI规定的寄存器的使用规则如下:
(1)GPR0:属于易失性寄存器,ABI规定普通用户不能使用此寄存器。GCC编译器用此寄存器来保存LR寄存器,Linux PowerPC用此寄存器来传递系统调用号码。
(2)GPR1:属于专用寄存器,ABI规定用次寄存器来保存堆栈的栈顶指针。
(3)GPR2:属于专用寄存器,ABI规定普通用户不使用才寄存器,Linux PowerPC用此寄存器来保存当前进程的进程描述符地址。
(4)GPR3-GPR4:属于易失性寄存器,ABI使用这两个寄存器来保存函数的返回值,或者用来传递参数。
(5)GPR5-GPR10:也属于易失性寄存器,加上GPR3和GPR4共8个寄存器用来传递函数的参数。当函数的参数超过八个时使用堆栈来传递。
(6)GPR11-GPR12:属于易失性寄存器,ABI规定普通用户不使用该寄存器,Linux PowerPC有时用这两个寄存器来存放临时变量,但是GCC编译器没有使用这两个寄存器。
(7)GPR13:属于专用寄存器,ABI规定该寄存器sdata段的基地址指针。Linux PowerPC在系统初始化时使用该寄存器来存放临时变量。GCC有时会根据某些规则将一些常用的数据放入sdata或者sbss段中。应用程序对sdata或者sbss段数据的访问与对data和bss段数据的访问机制不同,访问sdata段的数据速度更快。
(8)GPR14-GPR31:属于非易失性寄存器。ABI使用这些寄存器来存放一些临时变量,在应用程序中可以自由使用这些变量。
1.4 调用栈分析
调用链
NIP [C0088B8C] free_block+0xc4/0x16c
LR [C0088CF8] drain_array+0xc4/0x100
Call Trace:
[CE283ED0] [C06ABEC0] 0xc06abec0(unreliable)
[CE283EF0] [C0088CF8] drain_array+0xc4/0x100
[CE283F10] [C008A70C] cache_reap+0x94/0x13c
[CE283F30] [C003DA2C] run_workqueue+0xc4/0x198
[CE283F60] [C003E6D4] worker_thread+0x130/0x154
[CE283FB0] [C0042E80] kthread+0xd4/0x110
[CE283FF0] [C0011A70] original_kernel_thread+0x44/0x60
Instruction dump:
5400cffe 0f000000 80c4001c 7d1cf214 3c000010 3d200020 80a8001c 60000100
81660000 61290200 81460004 3906001c <916a0000> 914b0004 90060000 91260004
[CE283FB0] [C0042E80] kthread+0xd4/0x110
CE283FB0:栈地址;
C0042E80:栈上保存的LR值,即函数返回地址。
kthread:函数名;
0xd4/0x110:异常指令偏移/调用函数长度。
static void free_block(struct kmem_cache *cachep, void **objpp, int nr_objects, int node)
从调用栈上看,内核在drain_array中调用free_block出现异常,查看free_block原型,对比入栈参数(CF528000 C09EA500 EFFEAD20 CF5188A0),可以发现int nr_objects, int node明显异常,可能推断调用栈可能已经被踩。
指令码
Instruction dump:
5400cffe 0f000000 80c4001c 7d1cf214 3c000010 3d200020 80a8001c 60000100
81660000 61290200 81460004 3906001c <916a0000> 914b0004 90060000 91260004
Instruction dump打印出NIP附近的指令字节码。其中<916a0000>为NIP的指令码。
反汇编定位
objump -dS vmlinux > /tmp/kernel.s
通过查找<916a0000>对应的C代码,确定具体那句C代码出现异常。
其中vmlinux为已打开调试信息的,与故障相同版本的内核镜像。
2.MIPS小系统内核异常分析
2.1 异常打印
0:Oops[#1]:
0:Cpu 0
0:Show thread info from vcpu 0
0: VCPU Stack bottom Task Ti at
0: 0 c000000595057fe0 swapper c000000595054000
0:Thread info( c000000595054000 ):
0: Process swapper (pid: 1)
0: exec_domain ffffffffc0f299b0
0: flags 100000
0: tp_value 0
0: cpu 0
0: preempt_count 2
0: regs (null)
0:STACK_END_MAGIC at va( c000000595054068 ): 57AC6E9D( =? 57AC6E9D)
0:
0:$ 0 : 0: 0000000000000000 0: 0000000000000000 0: 0000000000000000 0: 0000000000000001 0:
0:$ 4 : 0: 0000000000000000 0: 0000000000000000 0: ffffffffffffffff 0: 0000000000002976 0:
0:$ 8 : 0: 0000000000007fff 0: 000000000000000a 0: 5f73746172747570 0: 000000000000006c 0:
0:$12 : 0: 0000000000000068 0: 000000000000004c 0: ffffffffc10bc384 0: c000000593338000 0:
0:$16 : 0: 0000000000000000 0: ffffffffc10e42b8 0: ffffffffc10e0000 0: ffffffffc10e0000 0:
0:$20 : 0: 0000000000000000 0: 0000000000000080 0: 0000000000000080 0: 0000000000000000 0:
0:$24 : 0: 0000000000000006 0: ffffffffc06501a8 0: 0: 0:
0:$28 : 0: c000000595054000 0: c000000595057c88 0: 0000000000000000 0: ffffffffc087bf40 0:
0:Hi : 0000000000000000
0:Lo : 0000000000000000
0:epc : ffffffffc087c4b4 _bcore_cleanup+0x34/0x190
0: Not tainted
0:ra : ffffffffc087bf40 _init+0x3e8/0x480
0:Status: 5400ffe3 0:KX 0:SX 0:UX 0:KERNEL 0:EXL 0:IE 0:
0:Cause : 00800008
0:BadVA : 0000000000000008
0:PrId : 000c1102 (XLP316 A2 )
0:<d>Modules linked in: 0:
0:Process swapper (pid: 1, threadinfo=c000000595054000, task=c000000595053898, tls=0000000000000000)
0:Stack : 0: ffffffffffffffff 0: ffffffffc10e0000 0: c000000595193240 0: 0000000000000001 0:
0: ffffffffc104365c 0: ffffffffc087bf40 0: 000001fac104365c 0: ffffffffc087cb30 0:
0: ffffffffc087c3a8 0: 0000000000000000 0: ffffffffc0f4a778 0: c000000595193000 0:
0: c000000595193240 0: 0000000000000001 0: ffffffffc10e0000 0: c000000595193240 0:
0: 0000000000000001 0: ffffffffc104365c 0: 0000000000000000 0: 0000000000000080 0:
0: 0000000000000080 0: ffffffffc1043c44 0: 00008a17bc300000 0: ffffffffc10e0000 0:
0: c00000059333dd40 0: 0000000000000000 0: 3800000000000000 0: 0000000000000000 0:
0: 000000009333dd40 0: ffffffffc1043638 0: 000000005400ffe0 0: ffffffffbfff00fe 0:
0: ffffffffc1070000 0: ffffffffc1063200 0: 0000000000000001 0: ffffffffc104365c 0:
0: 0000000000000000 0: 0000000000000080 0: 0000000000000080 0: 0000000000000000 0:
0: ... 0:
0:Call Trace: [jiffies: 0xfffff79f]
0:[<ffffffffc087c4b4>] _bcore_cleanup+0x34/0x190
0:[<ffffffffc087bf40>] _init+0x3e8/0x480
0:[<ffffffffc1043c44>] bcmxgs_init_module+0x5e8/0xc00
0:[<ffffffffc060eebc>] do_one_initcall+0x3c/0x1a0
0:[<ffffffffc102cc04>] kernel_init+0x220/0x2b8
0:[<ffffffffc062c730>] kernel_thread_helper+0x10/0x20
0:
0:
Code: 0: ffbf0028 0: 0000802d 0: 663142b8 0:<dc420008> 0: 0040f809 0: 00000000 0: 0202102a 0: 1040001d 0: 00000000
0:
0:<4>Disabling lock debugging due to kernel taint
2.2 异常信号
异常与信号之间的关系:

2.3 线程信息分析
0:Cpu 0:这2个0为当前CPU核ID;
0:Show thread info from vcpu 0
0: VCPU Stack bottom Task Ti at
0: 0 c000000595057fe0 swapper c000000595054000
VCPU:CPU核;
Stack bottom:栈底指针;
Task:线程名;
Ti at:线程thread_info结构体指针;
0:Thread info( c000000595054000 ):
0: Process swapper (pid: 1)
0: exec_domain ffffffffc0f299b0
0: flags 100000
0: tp_value 0
0: cpu 0
0: preempt_count 2
0: regs (null)
0:STACK_END_MAGIC at va( c000000595054068 ): 57AC6E9D( =? 57AC6E9D)
flags :线程标志位,具体标记如下表。此时值为TIF_FIXADE,表示有address errors。Thread info( c000000595054000 ):产生异常的线程信息;下面的字段为thread_info结构体中的字段信息。其中,
preempt_count:为抢占计数。为0时,内核可以安全的执行抢占此线程。不为0,表示当前进程持有锁不能释放CPU控制权(不能被抢占)。
STACK_END_MAGIC:栈底部的魔幻数,可以辅助判断栈是否被踩。
#define TIF_SIGPENDING		1	/* signal pending */

#define TIF_NEED_RESCHED	2	/* rescheduling necessary */

#define TIF_SYSCALL_AUDIT	3	/* syscall auditing active */

#define TIF_SECCOMP		4	/* secure computing */

#define TIF_NOTIFY_RESUME	5	/* callback before returning to user */

#define TIF_RESTORE_SIGMASK	9	/* restore signal mask in do_signal() */

#define TIF_USEDFPU		16	/* FPU was used by this task this quantum (SMP) */

#define TIF_POLLING_NRFLAG	17	/* true if poll_idle() is polling TIF_NEED_RESCHED */

#define TIF_MEMDIE		18

#define TIF_FREEZE		19

#define TIF_FIXADE		20	/* Fix address errors in software */

#define TIF_LOGADE		21	/* Log address errors to syslog */

#define TIF_32BIT_REGS		22	/* also implies 16/32 fprs */

#define TIF_32BIT_ADDR		23	/* 32-bit address space (o32/n32) */

#define TIF_FPUBOUND		24	/* thread bound to FPU-full CPU set */

#define TIF_LOAD_WATCH		25	/* If set, load watch registers */

#define TIF_XKPHYS_MEM_EN	26

#define TIF_XKPHYS_IO_EN	27

#define TIF_SYSCALL_TRACE	31	/* syscall trace active */
2.4 寄存器分析
0:$ 0 : 0: 0000000000000000 0: 0000000000000000 0: 0000000000000000 0: 0000000000000001 0:
0:$ 4 : 0: 0000000000000000 0: 0000000000000000 0: ffffffffffffffff 0: 0000000000002976 0:
0:$ 8 : 0: 0000000000007fff 0: 000000000000000a 0: 5f73746172747570 0: 000000000000006c 0:
0:$12 : 0: 0000000000000068 0: 000000000000004c 0: ffffffffc10bc384 0: c000000593338000 0:
0:$16 : 0: 0000000000000000 0: ffffffffc10e42b8 0: ffffffffc10e0000 0: ffffffffc10e0000 0:
0:$20 : 0: 0000000000000000 0: 0000000000000080 0: 0000000000000080 0: 0000000000000000 0:
0:$24 : 0: 0000000000000006 0: ffffffffc06501a8 0: 0: 0:
0:$28 : 0: c000000595054000 0: c000000595057c88 0: 0000000000000000 0: ffffffffc087bf40 0:
0:Hi : 0000000000000000
0:Lo : 0000000000000000
0:epc : ffffffffc087c4b4 _bcore_cleanup+0x34/0x190
0: Not tainted
0:ra : ffffffffc087bf40 _init+0x3e8/0x480
0:Status: 5400ffe3 0:KX 0:SX 0:UX 0:KERNEL 0:EXL 0:IE 0:
0:Cause : 00800008
0:BadVA : 0000000000000008
0:PrId : 000c1102 (XLP316 A2 )
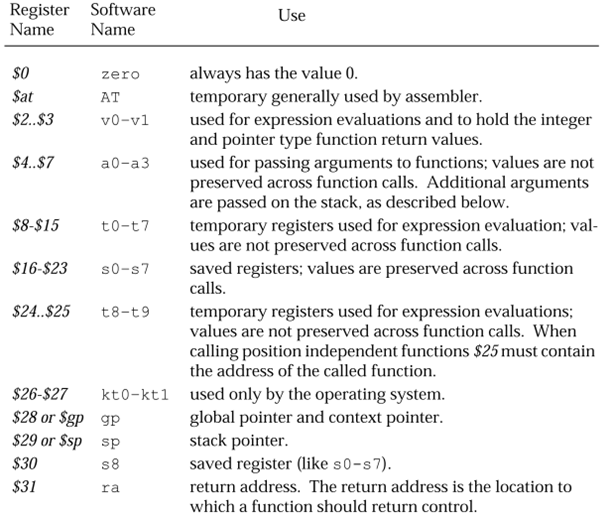
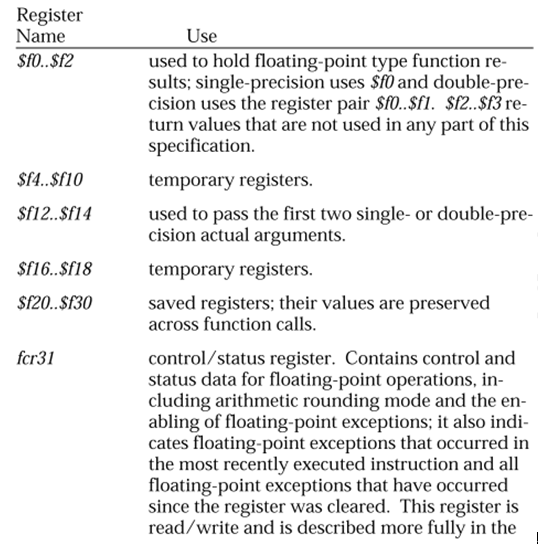
Mips核心寄存器组有4组,分别是GP, COP0, COP1, COP2。
其中COP0几个重要的寄存器解释如下:
Status:c0p0状态cp0_status。其中EXL标示在异常模式中,具体解释请参照《参考资料6.7 第193页》
Cause:00800008,标示 TLB exception(load or instruction fetch)
BadVA:产生异常的虚拟地址,如地址错误、无效的TLB,TLB modified等等。
2.5 调用栈分析
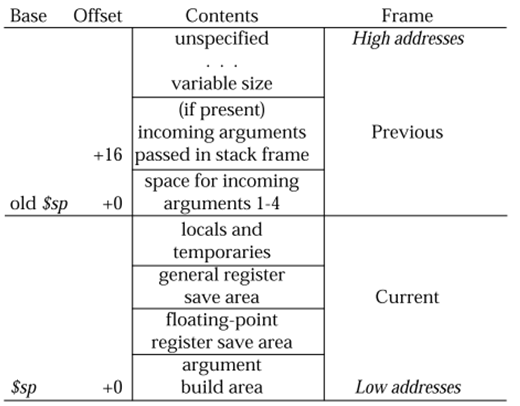
0:Process swapper (pid: 1, threadinfo=c000000595054000, task=c000000595053898, tls=0000000000000000)
0:Stack : 0: ffffffffffffffff 0: ffffffffc10e0000 0: c000000595193240 0: 0000000000000001 0:
0: ffffffffc104365c 0: ffffffffc087bf40 0: 000001fac104365c 0: ffffffffc087cb30 0:
0: ffffffffc087c3a8 0: 0000000000000000 0: ffffffffc0f4a778 0: c000000595193000 0:
0: c000000595193240 0: 0000000000000001 0: ffffffffc10e0000 0: c000000595193240 0:
0: 0000000000000001 0: ffffffffc104365c 0: 0000000000000000 0: 0000000000000080 0:
0: 0000000000000080 0: ffffffffc1043c44 0: 00008a17bc300000 0: ffffffffc10e0000 0:
0: c00000059333dd40 0: 0000000000000000 0: 3800000000000000 0: 0000000000000000 0:
0: 000000009333dd40 0: ffffffffc1043638 0: 000000005400ffe0 0: ffffffffbfff00fe 0:
0: ffffffffc1070000 0: ffffffffc1063200 0: 0000000000000001 0: ffffffffc104365c 0:
0: 0000000000000000 0: 0000000000000080 0: 0000000000000080 0: 0000000000000000 0:
0: ... 0:
0:Call Trace: [jiffies: 0xfffff79f]
0:[<ffffffffc087c4b4>] _bcore_cleanup+0x34/0x190
0:[<ffffffffc087bf40>] _init+0x3e8/0x480
0:[<ffffffffc1043c44>] bcmxgs_init_module+0x5e8/0xc00
0:[<ffffffffc060eebc>] do_one_initcall+0x3c/0x1a0
0:[<ffffffffc102cc04>] kernel_init+0x220/0x2b8
0:[<ffffffffc062c730>] kernel_thread_helper+0x10/0x20
0:
0:
Code: 0: ffbf0028 0: 0000802d 0: 663142b8 0:<dc420008> 0: 0040f809 0: 00000000 0: 0202102a 0: 1040001d 0: 00000000
0:
Call Trace:出现异常线程的调用栈信息。Stack:出现异常线程的堆栈信息。
Code:异常附近的指令码打印。其中0:<dc420008>为epc处的指令码,对应代码位置为(epc : ffffffffc087c4b4 _bcore_cleanup+0x34/0x190)。具体代码需要反汇编定位。
反汇编定位方法与Powerpc的相同。
分析代码可知,异常由于访问了BadVA : 0000000000000008的非法地址,查看_bcore_cleanup代码,可知此时bde指针没有初始化,是空指针,所以bde->num_devices的地址刚好是0000000000000008,导致异常。
异常代码段如下:
_bcore_cleanup(void)
{
for (unit = 0; unit < bde->num_devices(BDE_ALL_DEVICES); unit++)
6.参考资料
6.1 http://en.wikipedia.org/wiki/Unix_signal
6.2 http://www.powerlinuxchina.net/club/viewthread.php?tid=981
6.3 《PowerPC™ e500 Application Binary Interface User’s Guide》
6.4 《PowerPC™ e500 Core Family Reference Manual》
6.5 《MPC8572E PowerQUICC™ III Integrated Host Processor Family Reference Manual》
6.6 《SYSTEM V APPLICATION BINARY INTERFACE – MIPS RISC Processor Supplement》
6.7 《XLP 300-/300-Lite-Series-Processor Programmer’s Register Reference Guide》
6.8 http://blog.chinaunix.net/uid-16459552-id-3459993.html
6.9 http://blog.chinaunix.net/uid-16459552-id-3257539.html
6.10 http://www.linuxspy.info/2249/tainted-kernel/
--EOF--
Linux Kernel Oops异常分析的更多相关文章
- Linux kernel workqueue机制分析
Linux kernel workqueue机制分析 在内核编程中,workqueue机制是最常用的异步处理方式.本文主要基于linux kernel 3.10.108的workqueue文档分析其基 ...
- 如何解读Linux Kernel OOPS信息
OOPS信息解读 root@firefly:~/mnt/module# insmod oops_module.ko [ 867.140514] Unable to handle kernel NULL ...
- linux kernel make构建分析
前言 之前对uboot的构建进行了分析,现在再对linux kernel的构建进行分析.几年前的确也分析过,但是只是停留在笔记层面,没有转为文章,这次下定决定来完善它. 环境 同样,采用的还是zynq ...
- Linux kernel workqueue机制分析【转】
转自:http://www.linuxsir.org/linuxjcjs/15346.html 在内核编程中,workqueue机制是最常用的异步处理方式.本文主要基于linux kernel 3.1 ...
- Linux Kernel CMPXCHG函数分析
原文地址:http://blog.csdn.net/penngrove/article/details/44175387 最近看到Linux Kernel cmpxchg的代码,对实现很不理解.上网查 ...
- linux kernel input 子系统分析
Linux 内核为了处理各种不同类型的的输入设备 , 比如说鼠标 , 键盘 , 操纵杆 , 触摸屏 , 设计并实现了一个对上层应用统一的试图的抽象层 , 即是Linux 输入子系统 . 输入子系统的层 ...
- Linux Kernel ---- PCI Driver 分析
自己笔记使用. Kernel 版本 4.15.0 (ubuntu 18.04,intel skylake) 最近想学习VGA驱动去了解 DDCCP / EDID 等协议,然后顺便了解下驱动是如何工作的 ...
- linux kernel 字符设备详解
有关Linux kernel 字符设备分析: 参考:http://blog.jobbole.com/86531/ 一.linux kernel 将设备分为3大类,字符设备,块设备,网络设备. 字符设备 ...
- Understanding a Kernel Oops!
Understanding a kernel panic and doing the forensics to trace the bug is considered a hacker's job. ...
随机推荐
- php基础之gd图像生成、缩放、logo水印和简单验证码实现
gd库是php最常用的图片处理库之一(另外一个是imagemagick),可以生成图片.验证码.水印.缩略图等等.要使用gd库首先需要开启gd库扩展,windows系统下需要在php.ini中将ext ...
- oracle 11g express 快速入门
创建表空间CREATE TABLESPACE testdb LOGGING DATAFILE 'F:\oracle\app\oracle\oradata\XE\testdb.dbf' SIZE 100 ...
- UITableViewCell的重用机制
UITabelView一般会显示大量数据,如果有多少条数据就新建多少个cell,那么对于内存来说是种极大的负担,这样自然是不合理的,所以才会有重用机制 比如一个家庭办酒席,一共有13桌,每桌20个菜, ...
- ETL简介
1.ETL的定义 ETL分别是“Extract”.“ Transform” .“Load”三个单词的首字母缩写也就是“抽取”.“转换”.“装载”,但我们日常往往简称其为数据抽取. ETL是BI/DW( ...
- 带有“非简单参数”的函数为什么不能包含 "use strict" 指令
非简单参数就是 ES6 里新加的参数语法,包括:1.默认参数值.2.剩余参数.3.参数解构.本文接下来要讲的就是 ES7 为什么禁止在使用了非简单参数的函数里使用 "use strict&q ...
- [Machine Learning & Algorithm] 随机森林(Random Forest)
1 什么是随机森林? 作为新兴起的.高度灵活的一种机器学习算法,随机森林(Random Forest,简称RF)拥有广泛的应用前景,从市场营销到医疗保健保险,既可以用来做市场营销模拟的建模,统计客户来 ...
- Java开发规范摘录
对于规范的 JAVA 派生类,尽量用 eclipse工具来生成文件格式,避免用手写的头文件/实现文件. 尽量避免一行的长度超过 200 个字符,因为很多终端和工具不能很好处理之.缩进8格 ,impor ...
- (zz)linux awk
博文转载自http://www.cnblogs.com/ggjucheng/archive/2013/01/13/2858470.html 谢谢原作者.条理很清楚,由浅入深.敲了每一行命令,正确无误. ...
- 第七届山东省ACM省赛
激动人心的省赛终于结束了…平静下来再回头看真的感觉一波三折…先是赛前毫无预兆的查出突发性耳聋…伴随而来的就是左耳听力下降.轻微耳鸣.极个别情况下的头晕…不过这都还好,毕竟药物可以恢复…热身赛只过了一道 ...
- js导出表格数据
考虑到浏览器兼容性问题,采用原生js和后台交互下载网页数据 js: var table = $('.table-panel table'); // Header var tdData ="& ...