Prometheus配置文件
在prometheus监控系统,prometheus的职责是采集,查询和存储和推送报警到alertmanager。本文主要介绍下prometheus的配置文件。
全局配置文件简介
默认配置文件
按 Ctrl+C 复制代码

按 Ctrl+C 复制代码
- global: 此片段指定的是prometheus的全局配置, 比如采集间隔,抓取超时时间等。
- rule_files: 此片段指定报警规则文件, prometheus根据这些规则信息,会推送报警信息到alertmanager中。
- scrape_configs: 此片段指定抓取配置,prometheus的数据采集通过此片段配置。
- alerting: 此片段指定报警配置, 这里主要是指定prometheus将报警规则推送到指定的alertmanager实例地址。
- remote_write: 指定后端的存储的写入api地址。
- remote_read: 指定后端的存储的读取api地址。
global片段主要参数

  # How frequently to scrape targets by default.

  [ scrape_interval: <duration> | default = 1m ]      # 抓取间隔

  # How long until a scrape request times out.

  [ scrape_timeout: <duration> | default = 10s ]     # 抓取超时时间

  # How frequently to evaluate rules.

  [ evaluation_interval: <duration> | default = 1m ]   # 评估规则间隔

  # The labels to add to any time series or alerts when communicating with

  # external systems (federation, remote storage, Alertmanager).

  external_labels:                                                  # 外部一些标签设置

    [ <labelname>: <labelvalue> ... ]
scrapy_config片段主要参数
一个scrape_config 片段指定一组目标和参数, 目标就是实例,指定采集的端点, 参数描述如何采集这些实例, 主要参数如下
- scrape_interval: 抓取间隔,默认继承global值。
- scrape_timeout: 抓取超时时间,默认继承global值。
- metric_path: 抓取路径, 默认是/metrics
- scheme: 指定采集使用的协议,http或者https。
- params: 指定url参数。
- basic_auth: 指定认证信息。
- *_sd_configs: 指定服务发现配置
- static_configs: 静态指定服务job。
- relabel_config: relabel设置。
static_configs样例
scrape_configs:

  # The job name is added as a label `job=<job_name>` to any timeseries scraped from this config.

  - job_name: 'prometheus'

    # metrics_path defaults to '/metrics'

    # scheme defaults to 'http'.

    static_configs:

    - targets: ['localhost:9090']

  - job_name: "node"

    static_configs:

    - targets:

      - "192.168.100.10:20001"
      - "192.168.100.11:20001
      - "192.168.100.12:20001"
file_sd_configs样例
scrape_configs:

  # The job name is added as a label `job=<job_name>` to any timeseries scraped from this config.

  - job_name: 'prometheus'

    # metrics_path defaults to '/metrics'

    # scheme defaults to 'http'.

    static_configs:

    - targets: ['localhost:9090']

  - job_name: "node"

    file_sd_configs:

    - refresh_interval: 1m

      files:

      - "/usr/local/prometheus/prometheus/conf/node*.yml"
 # 独立文件配置如下 cat conf/node-dis.conf

- targets:
  - "192.168.100.10:20001"
  - "192.168.100.11:20001"
  - "192.168.100.12:20001"

或者可以这样配置 [root@node00 conf]# cat node-dis.yml

- targets:
  - "192.168.100.10:20001"
  labels:
    hostname: node00
- targets:
  - "192.168.100.11:20001"
  labels:
    hostname: node01
- targets:
  - "192.168.100.12:20001"
  labels:
    hostname: node02
通过file_fd_files 配置后我们可以在不重启prometheus的前提下, 修改对应的采集文件(node_dis.yml), 在特定的时间内(refresh_interval),prometheus会完成配置信息的载入工作。
consul_sd_file样例
由于consul的配置需要有consul的服务提供, 这里简单部署下consul的服务。
# 进入下载目录
[root@node00 prometheus]# cd /usr/src/
# 下载

[root@node00 src]# wget https://releases.hashicorp.com/consul/1.6.1/consul_1.6.1_linux_amd64.zip
# 解压

[root@node00 src]# unzip consul_1.6.1_linux_amd64.zip

Archive:  consul_1.6.1_linux_amd64.zip

  inflating: consul
# 查看

[root@node00 src]# ls

consul  consul_1.6.1_linux_amd64.zip  debug  kernels  node_exporter-0.18.1.linux-amd64.tar.gz  prometheus-2.12.0.linux-amd64.tar.gz
# 查看文件类型

[root@node00 src]# file consul

consul: ELF 64-bit LSB executable, x86-64, version 1 (SYSV), statically linked, not stripped
# 防止到系统bin目录

[root@node00 src]# mv consul /usr/local/bin/
# 确保环境变量包含

[root@node00 src]# echo $PATH

/usr/local/sbin:/usr/local/bin:/usr/sbin:/usr/bin:/root/bin


# 运行测试

[root@node00 consul.d]# consul agent -dev
# 测试获取成员
[root@node00 ~]# consul members

# 创建配置目录

[root@node00 ~]#mkdir /etc/consul.d

[root@node00 consul.d]# cat prometheus-node.json

{
  "addresses": {
                        "http": "0.0.0.0",
                        "https": "0.0.0.0"
           },
  "services": [{
                "name": "prometheus-node",
                "tags": ["prometheus","node"],
                "port": 20001
             }]

}
# 指定配置文件运行
consul  agent -dev -config-dir=/etc/consul.d
打开web管理界面 192.169.100.10:8500,查看相应的服务信息。

上面我们可以看到有2个service , 其中prometheus-node是我们定义的service。
和prometheus集成样例:
scrape_configs:
  # The job name is added as a label `job=<job_name>` to any timeseries scraped from this config.
  - job_name: 'prometheus'

    # metrics_path defaults to '/metrics'
    # scheme defaults to 'http'.
    static_configs:
    - targets: ['localhost:9090']

  - job_name: "node"
    consul_sd_configs:
    - server: localhost:8500
      services:
      - prometheus-node
    #  tags:
    #  - prometheus
    #  - node
    #- refresh_interval: 1m
  - job_name: 'node_exporter'

    consul_sd_configs:

      - server: 'consul_ip:8500'

        services: ['node_exporter']
# 匹配service关键字
- job_name: 'service'
consul_sd_configs:
- server: 'consul_ip:8500'
services: []
relabel_configs:
- source_labels: [__meta_consul_tags]
regex: .*service.*
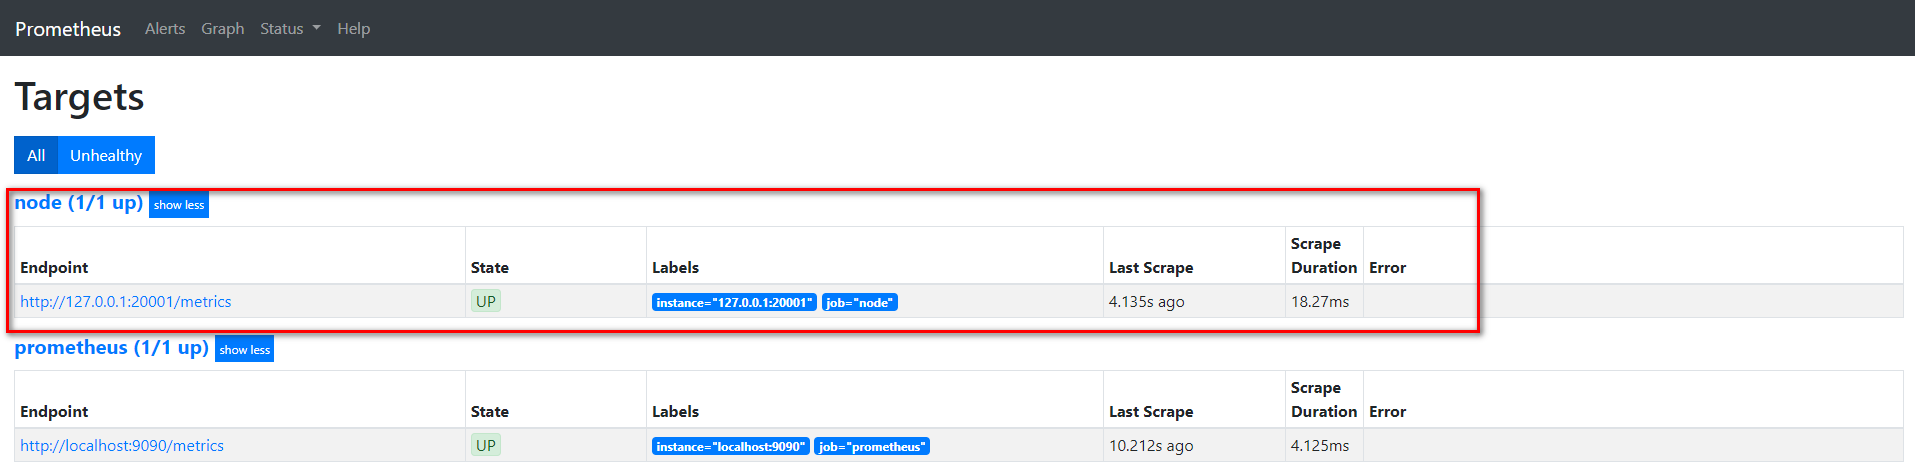
action: keep在prometheus的target界面上我们看到服务注册发现的结果。
我们通过api接口给该service添加一个节点, 看看是否可以同步过来。
[root@node00 ~]# curl -XPUT -d@node01.json  127.0.0.1:8500/v1/catalog/register
true
[root@node00 ~]# cat node01.json
{
        "id":"0cc931ea-9a3a-a6ff-3ef5-e0c99371d77d",
        "Node": "node01",
        "Address": "192.168.100.11",
        "Service":
                {
                        "Port": 20001,
                        "ID": "prometheus-node",
                        "Service": "prometheus-node"
                }
}
在consul和prometheus中查看
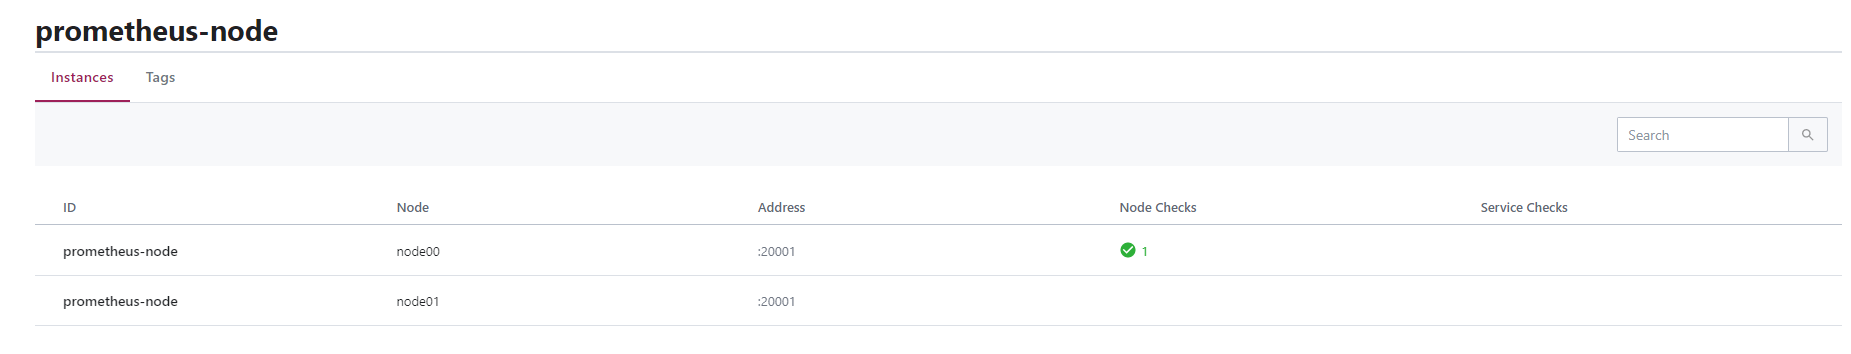
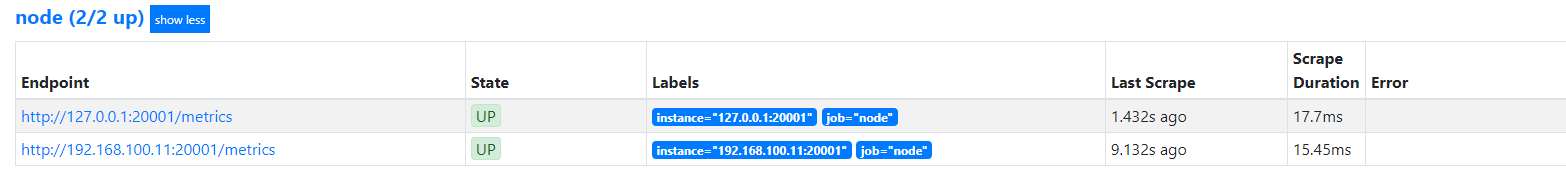
可以发现通过向consul中特定服务加入节点, 就可以在prometheus动态变动采集的实例地址。
Prometheus配置文件的更多相关文章
- Prometheus 配置文件详解
Prometheus 配置文件详解 官方文档:https://prometheus.io/docs/prometheus/latest/configuration/configuration/ 指标说 ...
- Prometheus 配置文件中 metric_relabel_configs 配置--转载
Prometheus 配置文件中 metric_relabel_configs 配置 参考1:https://www.baidu.com/link?url=YfpBgnD1RoEthqXOL3Lgny ...
- prometheus学习系列五: Prometheus配置文件
在prometheus监控系统,prometheus的职责是采集,查询和存储和推送报警到alertmanager.本文主要介绍下prometheus的配置文件. 全局配置文件简介 默认配置文件 [ro ...
- Kubernetes集群部署史上最详细(二)Prometheus监控Kubernetes集群
使用Prometheus监控Kubernetes集群 监控方面Grafana采用YUM安装通过服务形式运行,部署在Master上,而Prometheus则通过POD运行,Grafana通过使用Prom ...
- prometheus — 基于文件的服务发现
基于文件的服务发现方式不需要依赖其他平台与第三方服务,用户只需将要新的target信息以yaml或json文件格式添加到target文件中 ,prometheus会定期从指定文件中读取target信息 ...
- prometheus监控示例
prometheus架构图 prometheus 各组件介绍 Prometheus Server: 使用pull方式采集监控数据,在该组件上配置监控数据的采集和告警规则. Client Library ...
- Prometheus+AlertManager实现邮件报警
AlertManager下载 https://prometheus.io/download/ 解压 添加配置文件test.yml,配置收发邮件邮箱 参考配置: global: smtp_smartho ...
- Prometheus 监控进程
Process-exporter process-exporter可以用来检测所选进程的存活状态 下载process-exporter 下载地址:https://github.com/ncabatof ...
- Prometheus监控学习笔记之360基于Prometheus的在线服务监控实践
0x00 初衷 最近参与的几个项目,无一例外对监控都有极强的要求,需要对项目中各组件进行详细监控,如服务端API的请求次数.响应时间.到达率.接口错误率.分布式存储中的集群IOPS.节点在线情况.偏移 ...
随机推荐
- OpenJML入门
目录 OpenJML 获取 下载 使用 Linux Windows Parsing and Type-checking Extended Static Checking Runtime Asserti ...
- Java关于 class类的基础方法
Class类的方法 1. getClasses 和 getDeclaredClasses getDeclaredClasses 获取到类里所有的的class ,interface 包括了private ...
- dpkg文件缺失问题
sudo apt-get update 命中:1 http://security.ubuntu.com/ubuntu bionic-security InRelease 命中:2 ht ...
- ERROR: Cannot uninstall 'chardet'. It is a distutils installed project and thus we cannot accurately determine which files belong to it which would lead to only a partial uninstall.
pip 安装 docker库报错: ERROR: Cannot uninstall 'chardet'. It is a distutils installed project and thus we ...
- android 更新版本
1.UpdateManager package com.rfid.util; import java.io.File; import java.io.FileOutputStream; import ...
- iOS数组遍历
对于一个数组 NSArray *array = @[@"111",@"222",@"333",@"444",@" ...
- Ajax -异步请求 -jquery中ajax分类 -第一层 $.ajax -第二层($.get /$.post) -第三层($.getJson/$.getScript) -相应演示
Ajax 1.标准请求响应时浏览器的动作(同步操作) 1.1浏览器请求什么资源,跟随显示什么资源2.ajax:异步请求. 2.1局部刷新,通过异步请求,请求到服务器资源数据后,通过脚本修改页面中部分内 ...
- Easy sssp(spfa判负环与求最短路)
#include<bits/stdc++.h> using namespace std; int n,m,s; struct node{ int to,next,w; }e[]; bool ...
- P1559 运动员最佳匹配问题[最大费用最大流]
题目描述 羽毛球队有男女运动员各n人.给定2 个n×n矩阵P和Q.P[i][j]是男运动员i和女运动员j配对组成混合双打的男运动员竞赛优势:Q[i][j]是女运动员i和男运动员j配合的女运动员竞赛优势 ...
- MyEclipse激活代码
package TestCase; import java.io.BufferedReader; import java.io.IOException; import java.io.InputStr ...