可以用 Python 编程语言做哪些神奇好玩的事情?
作者:造数科技
链接:https://www.zhihu.com/question/21395276/answer/219747752
使用Python绘图
我们先来看看,能画出哪样的图
<img src="https://pic2.zhimg.com/v2-a8031dd3c7b213eba1f5b2530d3d79f5_b.png" data-rawwidth="550" data-rawheight="450" class="origin_image zh-lightbox-thumb" width="550" data-original="https://pic2.zhimg.com/v2-a8031dd3c7b213eba1f5b2530d3d79f5_r.png">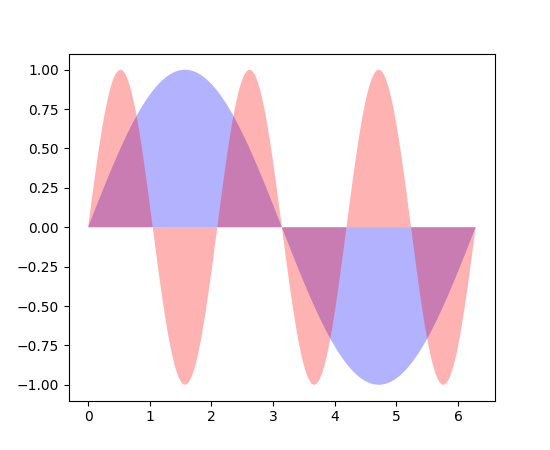
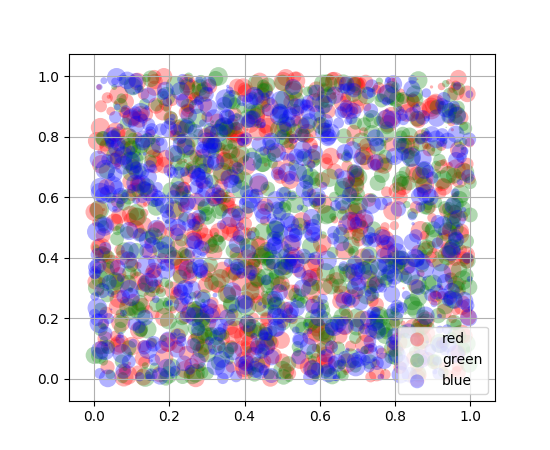
更强大的是,每张图片下都有提供源代码,可以直接拿来用,修改参数即可。

"""

===============

Basic pie chart

===============

Demo of a basic pie chart plus a few additional features.

In addition to the basic pie chart, this demo shows a few optional features:

    * slice labels

    * auto-labeling the percentage

    * offsetting a slice with "explode"

    * drop-shadow

    * custom start angle

Note about the custom start angle:

The default ``startangle`` is 0, which would start the "Frogs" slice on the

positive x-axis. This example sets ``startangle = 90`` such that everything is

rotated counter-clockwise by 90 degrees, and the frog slice starts on the

positive y-axis.

"""

import matplotlib.pyplot as plt

# Pie chart, where the slices will be ordered and plotted counter-clockwise:

labels = 'Frogs', 'Hogs', 'Dogs', 'Logs'

sizes = [15, 30, 45, 10]

explode = (0, 0.1, 0, 0)  # only "explode" the 2nd slice (i.e. 'Hogs')

fig1, ax1 = plt.subplots()

ax1.pie(sizes, explode=explode, labels=labels, autopct='%1.1f%%',

        shadow=True, startangle=90)

ax1.axis('equal')  # Equal aspect ratio ensures that pie is drawn as a circle.

plt.show()
<img src="https://pic3.zhimg.com/v2-f85e431df208c510be1c4a1ef579aaea_b.png" data-rawwidth="800" data-rawheight="900" class="origin_image zh-lightbox-thumb" width="800" data-original="https://pic3.zhimg.com/v2-f85e431df208c510be1c4a1ef579aaea_r.png">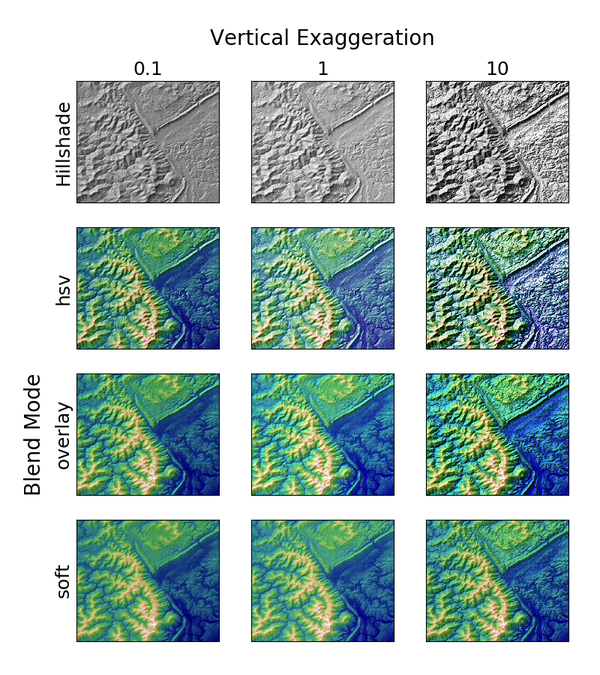
"""

Demonstrates the visual effect of varying blend mode and vertical exaggeration

on "hillshaded" plots.

Note that the "overlay" and "soft" blend modes work well for complex surfaces

such as this example, while the default "hsv" blend mode works best for smooth

surfaces such as many mathematical functions.

In most cases, hillshading is used purely for visual purposes, and *dx*/*dy*

can be safely ignored. In that case, you can tweak *vert_exag* (vertical

exaggeration) by trial and error to give the desired visual effect. However,

this example demonstrates how to use the *dx* and *dy* kwargs to ensure that

the *vert_exag* parameter is the true vertical exaggeration.

"""

import numpy as np

import matplotlib.pyplot as plt

from matplotlib.cbook import get_sample_data

from matplotlib.colors import LightSource

dem = np.load(get_sample_data('jacksboro_fault_dem.npz'))

z = dem['elevation']

#-- Optional dx and dy for accurate vertical exaggeration --------------------

# If you need topographically accurate vertical exaggeration, or you don't want

# to guess at what *vert_exag* should be, you'll need to specify the cellsize

# of the grid (i.e. the *dx* and *dy* parameters).  Otherwise, any *vert_exag*

# value you specify will be relative to the grid spacing of your input data

# (in other words, *dx* and *dy* default to 1.0, and *vert_exag* is calculated

# relative to those parameters).  Similarly, *dx* and *dy* are assumed to be in

# the same units as your input z-values.  Therefore, we'll need to convert the

# given dx and dy from decimal degrees to meters.

dx, dy = dem['dx'], dem['dy']

dy = 111200 * dy

dx = 111200 * dx * np.cos(np.radians(dem['ymin']))

#-----------------------------------------------------------------------------

# Shade from the northwest, with the sun 45 degrees from horizontal

ls = LightSource(azdeg=315, altdeg=45)

cmap = plt.cm.gist_earth

fig, axes = plt.subplots(nrows=4, ncols=3, figsize=(8, 9))

plt.setp(axes.flat, xticks=[], yticks=[])

# Vary vertical exaggeration and blend mode and plot all combinations

for col, ve in zip(axes.T, [0.1, 1, 10]):

    # Show the hillshade intensity image in the first row

    col[0].imshow(ls.hillshade(z, vert_exag=ve, dx=dx, dy=dy), cmap='gray')

    # Place hillshaded plots with different blend modes in the rest of the rows

    for ax, mode in zip(col[1:], ['hsv', 'overlay', 'soft']):

        rgb = ls.shade(z, cmap=cmap, blend_mode=mode,

                       vert_exag=ve, dx=dx, dy=dy)

        ax.imshow(rgb)

# Label rows and columns

for ax, ve in zip(axes[0], [0.1, 1, 10]):

    ax.set_title('{0}'.format(ve), size=18)

for ax, mode in zip(axes[:, 0], ['Hillshade', 'hsv', 'overlay', 'soft']):

    ax.set_ylabel(mode, size=18)

# Group labels...

axes[0, 1].annotate('Vertical Exaggeration', (0.5, 1), xytext=(0, 30),

                    textcoords='offset points', xycoords='axes fraction',

                    ha='center', va='bottom', size=20)

axes[2, 0].annotate('Blend Mode', (0, 0.5), xytext=(-30, 0),

                    textcoords='offset points', xycoords='axes fraction',

                    ha='right', va='center', size=20, rotation=90)

fig.subplots_adjust(bottom=0.05, right=0.95)

plt.show()
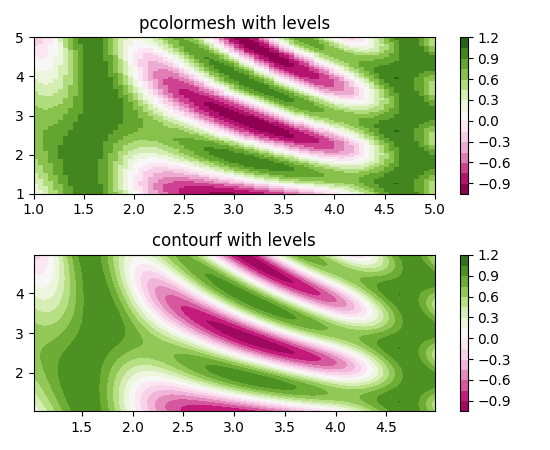
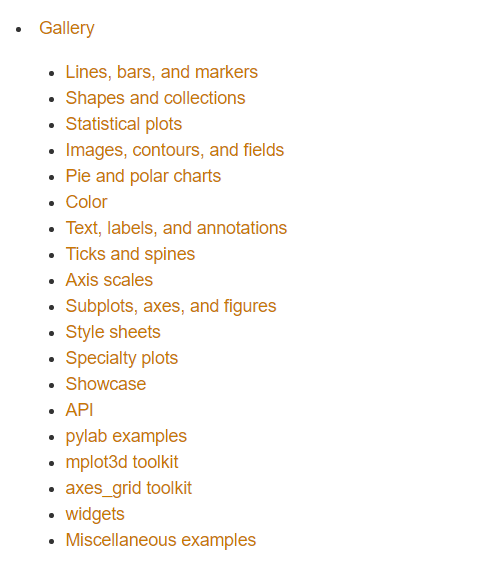
图片来自Matplotlib官网 Thumbnail gallery
这是图片的索引,可以看看有没有自己需要的
<img src="https://pic1.zhimg.com/v2-1be30f4fb48a08d508a8c354d540dea0_b.png" data-rawwidth="485" data-rawheight="561" class="origin_image zh-lightbox-thumb" width="485" data-original="https://pic1.zhimg.com/v2-1be30f4fb48a08d508a8c354d540dea0_r.png">
Stop plotting your data - annotate your data and let it visualize itself.
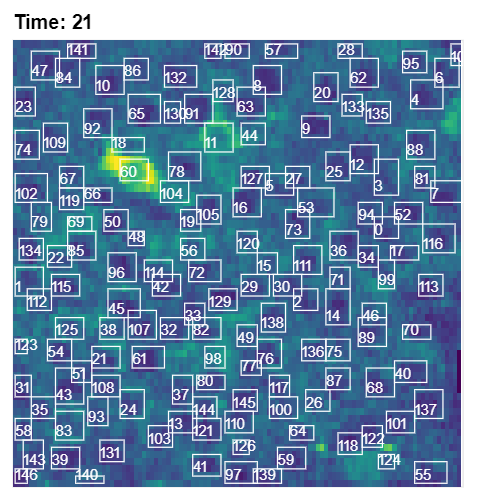
http://holoviews.org/getting_started/Gridded_Datasets.html
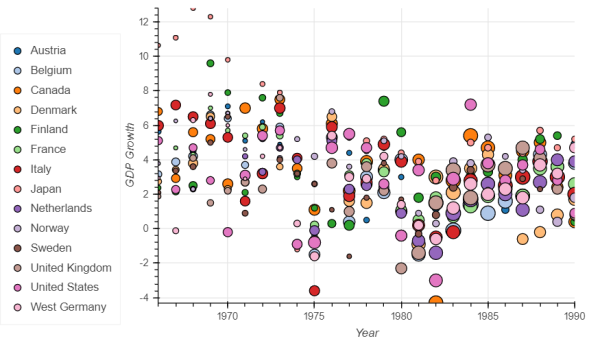
http://holoviews.org/gallery/demos/bokeh/scatter_economic.html
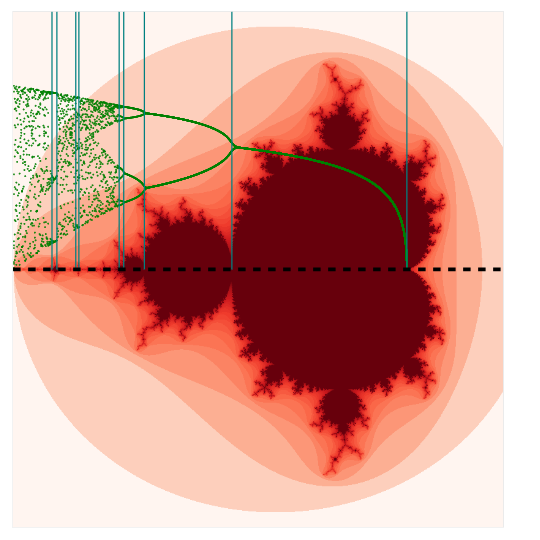
http://holoviews.org/gallery/demos/bokeh/verhulst_mandelbrot.html
<img src="https://pic4.zhimg.com/v2-d305a75b64dcd09e4c889b84d333ca37_b.png" data-rawwidth="500" data-rawheight="500" class="origin_image zh-lightbox-thumb" width="500" data-original="https://pic4.zhimg.com/v2-d305a75b64dcd09e4c889b84d333ca37_r.png">
可以用 Python 编程语言做哪些神奇好玩的事情?的更多相关文章
- 可以用 Python 编程语言做哪些神奇好玩的事情?除了生孩子不能,其他全都行!
坦克大战 源自于一个用Python写各种小游戏的github合集,star数1k.除了坦克大战外,还包含滑雪者.皮卡丘GOGO.贪吃蛇.推箱子.拼图等游戏. 图片转铅笔画 帮助你快速生成属于自己的铅笔 ...
- 孤陋寡闻了吧?Python 居然可以做这30件神奇好玩的事情(附教程)
知乎上有个浏览超过400万的问题:可以用 Python 编程语言做哪些神奇好玩的事情? 我先举一个很不专业的栗子...... 然后再找几个人抬一堆例子来...... 不是很稀饭<复联>嘛, ...
- 你都用python来做什么?
首页发现话题 提问 你都用 Python 来做什么? 关注问题写回答 编程语言 Python 编程 Python 入门 Python 开发 你都用 Python 来做什么? 发现很 ...
- Python 编程语言要掌握的技能之一:使用数字与字符串的技巧
最佳实践 1. 少写数字字面量 “数字字面量(integer literal)” 是指那些直接出现在代码里的数字.它们分布在代码里的各个角落,比如代码 del users[0] 里的 0 就是一个数字 ...
- 3.Python编程语言基础技术框架
3.Python编程语言基础技术框架 3.1查看数据项数据类型 type(name) 3.2查看数据项数据id id(name) 3.3对象引用 备注Python将所有数据存为内存对象 Python中 ...
- 学了Python可以做什么工作
学了Python可以做什么工作 用 Python 写爬虫 据我所知很多初学 Python 的人都是使用它编写爬虫程序.小到抓取一个小黄图网站,大到一个互联网公司的商业应用.通过 Python 入门爬虫 ...
- Python能做什么,自学Python效果怎么样?
短时间掌握一门技能是现代社会的需求.生活节奏越来越快,现在不是大鱼吃小鱼,而是快鱼吃慢鱼的时代,人的时间比机器的时间更值钱.Python作为一种轻量级编程语言,语言简洁开发快,没那么多技巧,受到众多追 ...
- Python 编程语言要掌握的技能之一:编写条件分支代码的技巧
Python 里的分支代码 Python 支持最为常见的 if/else 条件分支语句,不过它缺少在其他编程语言中常见的 switch/case 语句. 除此之外,Python 还为 for/whil ...
- Python 编程语言要掌握的技能之一:善用变量来改善代码质量
如何为变量起名 在计算机科学领域,有一句著名的格言(俏皮话): There are only two hard things in Computer Science: cache invalidati ...
随机推荐
- vue.js移动端app实战2:首页
貌似有部分人要求写的更详细,这里多写一点vuel-cli基础的配置 什么是vue-cli? 官方的解释是:A simple CLI for scaffolding Vue.js projects, 简 ...
- LFLiveKit架构简介
LFLiveSession LFLiveSession 是整个sdk的核心,提供对外部的主要接口.主要功能有:管理推流开关.管理音视频录制及渲染.管理录制渲染后的音视频编码.管理编码后的数据上传.管理 ...
- java出现The type java.lang.Object cannot be resolved. It is indirectly referenced.....解决办法
当你在Eclipse引用不同版本JDK工程时会发生该问题.由于你开发环境中应用了多个版 本的JDK 或JRE导致的.Eclipse会按照最初的开发环境默认选择对应的Jre.如Eclipse上有jdk1 ...
- 从Javascript单线程谈Event Loop
假如面试回答js的运行机制时,你可能说出这么一段话:"Javascript的事件分同步任务和异步任务,遇到同步任务就放在执行栈中执行,而碰到异步任务就放到任务队列之中,等到执行栈执行完毕之后 ...
- 关于CGI:Tomcat、PHP、Perl、Python和FastCGI之间的关系
如前文所述,Web服务器是一个很简单的东西,并不负责动态网页的构建,只能转发静态网页.同时Apache也说,他能支持perl,生成动态网页.这个支持perl,其实是apache越位了,做了一件额外的事 ...
- android下网络通信流程
新版本android中进行socket编程有了新的要求和规定,在主线程中不能进行socket的创建和通信.所以一般都在线程中使用socket编程 这样在线程中使用就需要出现子线程与主线程交互的问题. ...
- uploadify 在chrome上崩溃的解决办法
使用Uploadify进行文件上传,Chrome经常会报“喔唷,崩溃啦”的错误,见下图: 很显然,这是Chrome浏览器缓存功能,所导致的问题.从LOG里也能看到:正常的情况下,会请求文件(jquer ...
- 总结一些php的面试题
1.PHP语言的一大优势是跨平台,什么是跨平台?一.PHP基础: PHP的运行环境最优搭配为Apache+MySQL+PHP,此运行环境可以在不同操作系统(例如windows.Linux等)上配置,不 ...
- Jmeter+badboy环境搭建
[JMeter安装] 1. 访问官网 下载jmeter包 http://jmeter.apache.org/ 2. 解压到安装目录 D:\Program Files (x86)\apache-jmet ...
- 为什么新生代内存需要有两个Survivor区
转载自:http://blog.csdn.net/antony9118/article/details/51425581 在JVM的新生代内存中,为什么除了Eden区,还要设置两个Survivor区? ...