统计编程的框架与R语言统计分析基础——摘(2)统计分析之线性回归
一、线性回归
1、简单线性回归
a、
> x = women

> x

   height weight

1      58    115

2      59    117

3      60    120

4      61    123

5      62    126

6      63    129

7      64    132

8      65    135

9      66    139

10     67    142

11     68    146

12     69    150

13     70    154

14     71    159

15     72    164

> fit = lm(weight ~ height, data=x)

> summary(fit)

Call:

lm(formula = weight ~ height, data = x)

Residuals:

    Min      1Q  Median      3Q     Max

-1.7333 -1.1333 -0.3833  0.7417  3.1167

Coefficients:

             Estimate Std. Error t value Pr(>|t|)

(Intercept) -87.51667    5.93694  -14.74 1.71e-09 ***

height        3.45000    0.09114   37.85 1.09e-14 ***

---

Signif. codes:  0 ‘***’ 0.001 ‘**’ 0.01 ‘*’ 0.05 ‘.’ 0.1 ‘ ’ 1

Residual standard error: 1.525 on 13 degrees of freedom

Multiple R-squared:  0.991,    Adjusted R-squared:  0.9903

F-statistic:  1433 on 1 and 13 DF,  p-value: 1.091e-14

> fitted(fit)

       1        2        3        4        5        6        7        8        9

112.5833 116.0333 119.4833 122.9333 126.3833 129.8333 133.2833 136.7333 140.1833

      10       11       12       13       14       15

143.6333 147.0833 150.5333 153.9833 157.4333 160.8833

> women$weight

 [1] 115 117 120 123 126 129 132 135 139 142 146 150 154 159 164

> residuals(fit)

          1           2           3           4           5           6           7

 2.41666667  0.96666667  0.51666667  0.06666667 -0.38333333 -0.83333333 -1.28333333

          8           9          10          11          12          13          14

-1.73333333 -1.18333333 -1.63333333 -1.08333333 -0.53333333  0.01666667  1.56666667

         15

 3.11666667

> plot(women$height, women$weight)

> abline(fit)

b、
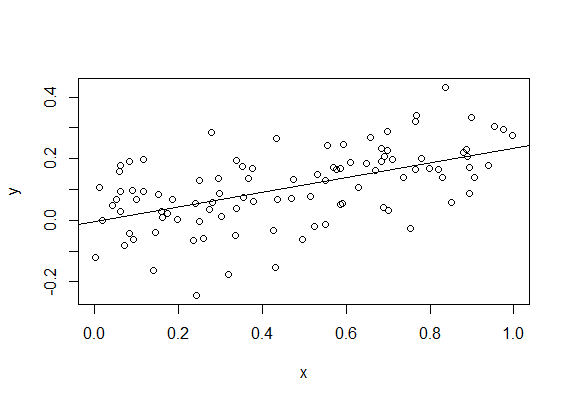
> x = runif(100)

> y = 0.2*x + 0.1*rnorm(100)

> fit = lm(y~x)

> summary(fit)

Call:

lm(formula = y ~ x)

Residuals:

      Min        1Q    Median        3Q       Max

-0.299493 -0.056850  0.004709  0.066714  0.237272

Coefficients:

             Estimate Std. Error t value Pr(>|t|)

(Intercept) -0.002891   0.019688  -0.147    0.884

x            0.236938   0.036158   6.553 2.64e-09 ***

---

Signif. codes:  0 ‘***’ 0.001 ‘**’ 0.01 ‘*’ 0.05 ‘.’ 0.1 ‘ ’ 1

Residual standard error: 0.1037 on 98 degrees of freedom

Multiple R-squared:  0.3047,    Adjusted R-squared:  0.2976

F-statistic: 42.94 on 1 and 98 DF,  p-value: 2.639e-09

> plot(x,y)

> abline(fit)

c、
> y = 0.2*x + 0.01*rnorm(100)

> fit = lm(y~x)

> summary(fit)

Call:

lm(formula = y ~ x)

Residuals:

      Min        1Q    Median        3Q       Max

-0.019936 -0.005549 -0.001135  0.004598  0.026435

Coefficients:

             Estimate Std. Error t value Pr(>|t|)

(Intercept) -0.002684   0.001837  -1.461    0.147

x            0.203561   0.003374  60.326   <2e-16 ***

---

Signif. codes:  0 ‘***’ 0.001 ‘**’ 0.01 ‘*’ 0.05 ‘.’ 0.1 ‘ ’ 1

Residual standard error: 0.009678 on 98 degrees of freedom

Multiple R-squared:  0.9738,    Adjusted R-squared:  0.9735

F-statistic:  3639 on 1 and 98 DF,  p-value: < 2.2e-16

> plot(x,y)

> abline(fit)

2、多项式线性回归
a、
> fit2 = lm(weight ~ height + I(height^2), data=women)

> summary(fit2)

Call:

lm(formula = weight ~ height + I(height^2), data = women)

Residuals:

     Min       1Q   Median       3Q      Max

-0.50941 -0.29611 -0.00941  0.28615  0.59706

Coefficients:

             Estimate Std. Error t value Pr(>|t|)

(Intercept) 261.87818   25.19677  10.393 2.36e-07 ***

height       -7.34832    0.77769  -9.449 6.58e-07 ***

I(height^2)   0.08306    0.00598  13.891 9.32e-09 ***

---

Signif. codes:  0 ‘***’ 0.001 ‘**’ 0.01 ‘*’ 0.05 ‘.’ 0.1 ‘ ’ 1

Residual standard error: 0.3841 on 12 degrees of freedom

Multiple R-squared:  0.9995,    Adjusted R-squared:  0.9994

F-statistic: 1.139e+04 on 2 and 12 DF,  p-value: < 2.2e-16

> plot(women$height, women$weight)

> lines(women$height, fitted(fit2))

b、
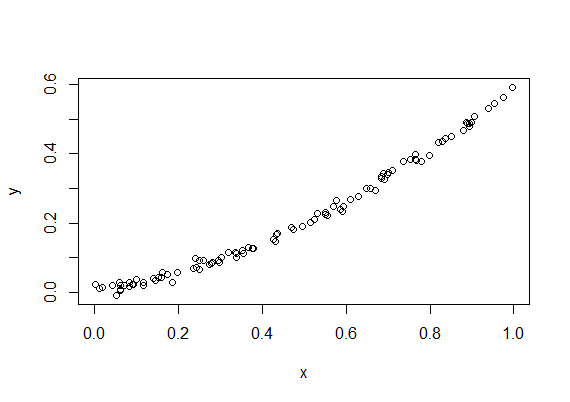
> y = 0.4*x**2 + 0.2*x + 0.01*rnorm(100)

> fit = lm(y~x + I(x^2))

> summary(fit)

Call:

lm(formula = y ~ x + I(x^2))

Residuals:

       Min         1Q     Median         3Q        Max

-0.0243909 -0.0058432 -0.0000949  0.0056788  0.0245737

Coefficients:

            Estimate Std. Error t value Pr(>|t|)

(Intercept) 0.003611   0.002727   1.324    0.189

x           0.189098   0.013571  13.934   <2e-16 ***

I(x^2)      0.400631   0.013806  29.018   <2e-16 ***

---

Signif. codes:  0 ‘***’ 0.001 ‘**’ 0.01 ‘*’ 0.05 ‘.’ 0.1 ‘ ’ 1

Residual standard error: 0.009857 on 97 degrees of freedom

Multiple R-squared:  0.9966,    Adjusted R-squared:  0.9965

F-statistic: 1.418e+04 on 2 and 97 DF,  p-value: < 2.2e-16

> plot(x,y)

3、多元线性回归
> states = as.data.frame(state.x77[, c("Murder", "Population", "Illiteracy", "Income", "Frost")])

> cor(states)

               Murder Population Illiteracy     Income      Frost

Murder      1.0000000  0.3436428  0.7029752 -0.2300776 -0.5388834

Population  0.3436428  1.0000000  0.1076224  0.2082276 -0.3321525

Illiteracy  0.7029752  0.1076224  1.0000000 -0.4370752 -0.6719470

Income     -0.2300776  0.2082276 -0.4370752  1.0000000  0.2262822

Frost      -0.5388834 -0.3321525 -0.6719470  0.2262822  1.0000000

> install.packages("car")

> library(car)

> scatterplotMatrix(states, spread=FALSE, lty.smooth=2, main="Scatter Plot Matrix")

> fit = lm(Murder ~ Population + Illiteracy + Income + Frost, data=states)

> summary(fit)

Call:

lm(formula = Murder ~ Population + Illiteracy + Income + Frost,

    data = states)

Residuals:

    Min      1Q  Median      3Q     Max

-4.7960 -1.6495 -0.0811  1.4815  7.6210

Coefficients:

             Estimate Std. Error t value Pr(>|t|)

(Intercept) 1.235e+00  3.866e+00   0.319   0.7510

Population  2.237e-04  9.052e-05   2.471   0.0173 *

Illiteracy  4.143e+00  8.744e-01   4.738 2.19e-05 ***

Income      6.442e-05  6.837e-04   0.094   0.9253

Frost       5.813e-04  1.005e-02   0.058   0.9541

---

Signif. codes:  0 ‘***’ 0.001 ‘**’ 0.01 ‘*’ 0.05 ‘.’ 0.1 ‘ ’ 1

Residual standard error: 2.535 on 45 degrees of freedom

Multiple R-squared:  0.567,    Adjusted R-squared:  0.5285

F-statistic: 14.73 on 4 and 45 DF,  p-value: 9.133e-08
4、有叫互项的多元线性回归
> fit = lm(mpg ~ hp + wt + hp:wt, data=mtcars)

> summary(fit)

Call:

lm(formula = mpg ~ hp + wt + hp:wt, data = mtcars)

Residuals:

    Min      1Q  Median      3Q     Max

-3.0632 -1.6491 -0.7362  1.4211  4.5513

Coefficients:

            Estimate Std. Error t value Pr(>|t|)

(Intercept) 49.80842    3.60516  13.816 5.01e-14 ***

hp          -0.12010    0.02470  -4.863 4.04e-05 ***

wt          -8.21662    1.26971  -6.471 5.20e-07 ***

hp:wt        0.02785    0.00742   3.753 0.000811 ***

---

Signif. codes:  0 ‘***’ 0.001 ‘**’ 0.01 ‘*’ 0.05 ‘.’ 0.1 ‘ ’ 1

Residual standard error: 2.153 on 28 degrees of freedom

Multiple R-squared:  0.8848,    Adjusted R-squared:  0.8724

F-statistic: 71.66 on 3 and 28 DF,  p-value: 2.981e-13
马力与车重的叫互项是显著的,说明:响应变量与其中一个预测变量的关系依赖于另外一个预测变量的水平。
> install.packages("effects")

> library(effects)

> plot(effect("hp:wt", fit, list(wt=c(2.2, 3.2, 4.2))), multiline=TRUE)

统计编程的框架与R语言统计分析基础——摘(2)统计分析之线性回归的更多相关文章
- 统计编程的框架与R语言统计分析基础——摘(1)
清屏命令ctrl+L 一.基础 1.产生数据结构 a.直接输入 b.冒号,1:10 c.seq函数 d.rep函数 > 1:10 [1] 1 2 3 4 5 6 7 8 9 10 > 10 ...
- R语言语法基础二
R语言语法基础二 重塑数据 增加行和列 # 创建向量 city = c("Tampa","Seattle","Hartford"," ...
- R语言语法基础一
R语言语法基础一 Hello world #这里是注释 myString = "hello world" print(myString) [1] "hello world ...
- R语言学习-基础篇1
###第一周:R基础 rm(list = ls()) #ctr+L###矩阵相乘,函数diag()a=matrix(1:12,nrow=3,ncol=4)b=matrix(1:12,nrow=4,n ...
- 转载 R语言颜色基础设置
原文链接:http://www.biostatistic.net/thread-5065-1-1.html R语言在画图形的时候,经常遇到颜色设定问题,用户可以根据color.rgb值和hsv值来设定 ...
- 吴裕雄--天生自然 R语言开发学习:基本统计分析(续三)
#---------------------------------------------------------------------# # R in Action (2nd ed): Chap ...
- 吴裕雄--天生自然 R语言开发学习:基本统计分析
#---------------------------------------------------------------------# # R in Action (2nd ed): Chap ...
- R语言学习-基础篇
从五月10日开始自学R in action,将我的学习所得逐渐发布在博客上. chapter1.新手上路 工作空间:存储着所有用户定义的对象(向量,矩阵,函数,数据框,列表): 当前的工目录保存是R用 ...
- R语言画图基础参数设置
Graphical Parameters You can customize many features of your graphs (fonts, colors, axes, titles) th ...
随机推荐
- swift--使用 is 和 as 操作符来实现类型检查和转换 / AnyObject与Any的区别
声明几个类: //动物类 class Animal{ } //陆地动物类 class terricole: Animal { } //海洋动物类 class SeaAnimals: Animal { ...
- Linux ulimit 命令
ulimit命令用来限制系统用户对 shell 资源的访问,常见用法如下: [root@localhost ~]$ ulimit -a # 查看当前所有的资源限制 [root@localhost ~] ...
- 利用html实现类似于word自动生成的目录的效果
在word中的自动生成目录当中,我们会看到是这样的目录结构: 嗯,自动生成固然是简单,但是在html当中,却没有一个合适的标签来去做.今天后台导出PDF的时候告诉我,他需要用html做一个这样的结构, ...
- php学习八:封装
一:在php中,用class关键字来创建一个类,即进行封装:在类里面有成员属性和方法行为组成: 1.成员属性:用关键字var来声明,可以给初始值也可以不给;现在var废弃,用public来声明,pub ...
- PyQt4 菜单栏 + 工具栏 + 状态栏 + 中心部件 生成一个文本编辑部件示例
我们将创建一个菜单栏.一个工具栏.一个状态栏和一个中心部件. #!/usr/bin/python # -*- coding:utf-8 -*- import sys from PyQt4 import ...
- iOS - 布局重绘机制相关方法的研究
iOS View布局重绘机制相关方法 布局 - (void)layoutSubviews - (void)layoutIfNeeded- (void)setNeedsLayout —————————— ...
- openstack的glance、nova、cinder使用ceph做后端存储
块设备与 OPENSTACK 通过 libvirt 你可以把 Ceph 块设备用于 OpenStack ,它配置了 QEMU 到 librbd 的接口. Ceph 把块设备映像条带化为对象并分布到集群 ...
- C++面向对象类的实例题目十二
题目描述: 写一个程序计算正方体.球体和圆柱体的表面积和体积 程序代码: #include<iostream> #define PAI 3.1415 using namespace std ...
- java高级---->Thread之Condition的使用
Condition 将 Object 监视器方法(wait.notify 和 notifyAll)分解成截然不同的对象,以便通过将这些对象与任意 Lock 实现组合使用,为每个对象提供多个等待 set ...
- LeetCode——Kth Largest Element in an Array
Description: Find the kth largest element in an unsorted array. Note that it is the kth largest elem ...
