python 特征选择 绘图 + mine
demo代码:
# _*_coding:UTF-8_*_

import numpy as np

import sys

import pandas as pd

from pandas import Series,DataFrame

import numpy as np

import sys

from sklearn import preprocessing

from sklearn.ensemble import ExtraTreesClassifier

import os

from minepy import MINE

def iterbrowse(path):

    for home, dirs, files in os.walk(path):

        for filename in files:

            yield os.path.join(home, filename)

def get_data(filename):

    white_verify = []

    with open(filename) as f:

        lines = f.readlines()

        data = {}

        for line in lines:

            a = line.split("\t")

            if len(a) != 78:

                print(line)

                raise Exception("fuck")

            white_verify.append([float(n) for n in a[3:]])

    return white_verify

if __name__ == '__main__':

    # pdb.set_trace()

    neg_file = "cc_data/black_all.txt"

    pos_file = "cc_data/white_all.txt"

    X = []

    y = []

    if os.path.isfile(pos_file):

        if pos_file.endswith('.txt'):

            pos_set = np.genfromtxt(pos_file)

        elif pos_file.endswith('.npy'):

            pos_set = np.load(pos_file)

        X.extend(pos_set)

        y += [0] * len(pos_set)

    if os.path.isfile(neg_file):

        if neg_file.endswith('.txt'):

            neg_set = np.genfromtxt(neg_file)

        elif neg_file.endswith('.npy'):

            neg_set = np.load(neg_file)

        '''

        X.extend(list(neg_set) * 5)

        y += [1] * (5 * len(neg_set))

        '''

        X.extend(neg_set)

        y += [1] * len(neg_set)

    print("len of X:", len(X))

    print("X sample:", X[:3])

    print("len of y:", len(y))

    print("y sample:", y[:3])

    X = [x[3:] for x in X]

    print("filtered X sample:", X[:3])

    cols = [str(i + 6) for i in range(len(X[0]))]

    clf = ExtraTreesClassifier()

    clf.fit(X, y)

    print (clf.feature_importances_)

    print "Features sorted by their score:"

    print sorted(zip(clf.feature_importances_, cols), reverse=True)

    black_verify = []

    for f in iterbrowse("todo/top"):

        print(f)

        black_verify += get_data(f)

    # ValueError: operands could not be broadcast together with shapes (1,74) (75,) (1,74)

    print(black_verify)

    black_verify_labels = [3] * len(black_verify)

    white_verify = get_data("todo/white_verify.txt")

    print(white_verify)

    white_verify_labels = [2] * len(white_verify)

    unknown_verify = get_data("todo/pek_feature74.txt")

    print(unknown_verify)

    # extend data

    X = np.concatenate((X, black_verify))

    y += black_verify_labels

    X = np.concatenate((X, white_verify))

    y += white_verify_labels

    #################################### plot ####################################

    data_train = pd.DataFrame(X)

    # cols = [str(i) for i in range(6, 81)]

    data_train.columns = cols

    # add label column

    # data_train = data_train.assign(label=pd.Series(y))

    data_train["label"] = pd.Series(y)

    print(data_train.info())

    print(data_train.columns)

    import matplotlib.pyplot as plt

    for col in cols:

        fig = plt.figure(figsize=(20, 16), dpi=8)

        fig.set(alpha=0.2)

        plt.figure()

        data_train[data_train.label == 0.0][col].plot()

        data_train[data_train.label == 1.0][col].plot()

        data_train[data_train.label == 2.0][col].plot()

        data_train[data_train.label == 3.0][col].plot()

        plt.xlabel(u"sample data id")

        plt.ylabel(u"value")

        plt.title(col)

        plt.legend((u'white', u'black', u"white-todo", u"black-todo"), loc='best')

        plt.show()

    print "calculate MINE mic value:"

    for col in cols:

        print col,

        mine = MINE(alpha=0.6, c=15,

                    est="mic_approx")  # http://minepy.readthedocs.io/en/latest/python.html#second-example

        mine.compute_score(data_train[col], y)

        print "MIC=", mine.mic()

    sys.exit(-1)
extend data 表示待预测的数据
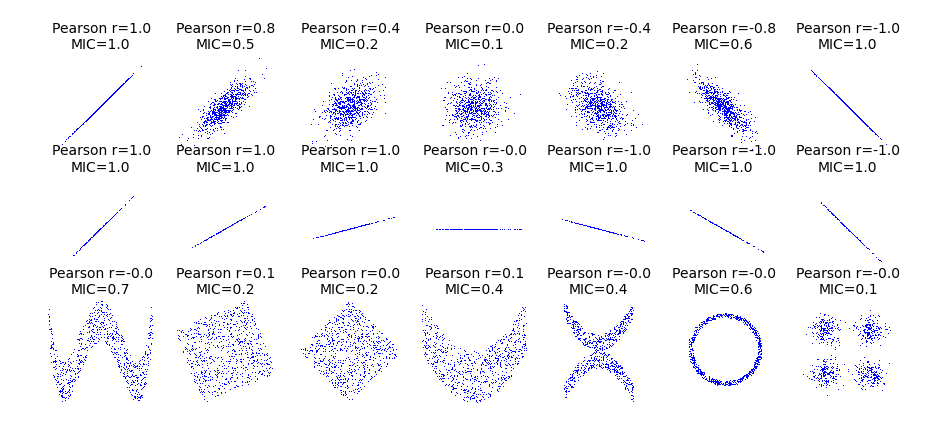
关于mic:
from __future__ import division

import numpy as np

import matplotlib.pyplot as plt

from minepy import MINE

rs = np.random.RandomState(seed=0)

def mysubplot(x, y, numRows, numCols, plotNum,

              xlim=(-4, 4), ylim=(-4, 4)):

    r = np.around(np.corrcoef(x, y)[0, 1], 1)

    mine = MINE(alpha=0.6, c=15, est="mic_approx")

    mine.compute_score(x, y)

    mic = np.around(mine.mic(), 1)

    ax = plt.subplot(numRows, numCols, plotNum,

                     xlim=xlim, ylim=ylim)

    ax.set_title('Pearson r=%.1f\nMIC=%.1f' % (r, mic),fontsize=10)

    ax.set_frame_on(False)

    ax.axes.get_xaxis().set_visible(False)

    ax.axes.get_yaxis().set_visible(False)

    ax.plot(x, y, ',')

    ax.set_xticks([])

    ax.set_yticks([])

    return ax

def rotation(xy, t):

    return np.dot(xy, [[np.cos(t), -np.sin(t)], [np.sin(t), np.cos(t)]])

def mvnormal(n=1000):

    cors = [1.0, 0.8, 0.4, 0.0, -0.4, -0.8, -1.0]

    for i, cor in enumerate(cors):

        cov = [[1, cor],[cor, 1]]

        xy = rs.multivariate_normal([0, 0], cov, n)

        mysubplot(xy[:, 0], xy[:, 1], 3, 7, i+1)

def rotnormal(n=1000):

    ts = [0, np.pi/12, np.pi/6, np.pi/4, np.pi/2-np.pi/6,

          np.pi/2-np.pi/12, np.pi/2]

    cov = [[1, 1],[1, 1]]

    xy = rs.multivariate_normal([0, 0], cov, n)

    for i, t in enumerate(ts):

        xy_r = rotation(xy, t)

        mysubplot(xy_r[:, 0], xy_r[:, 1], 3, 7, i+8)

def others(n=1000):

    x = rs.uniform(-1, 1, n)

    y = 4*(x**2-0.5)**2 + rs.uniform(-1, 1, n)/3

    mysubplot(x, y, 3, 7, 15, (-1, 1), (-1/3, 1+1/3))

    y = rs.uniform(-1, 1, n)

    xy = np.concatenate((x.reshape(-1, 1), y.reshape(-1, 1)), axis=1)

    xy = rotation(xy, -np.pi/8)

    lim = np.sqrt(2+np.sqrt(2)) / np.sqrt(2)

    mysubplot(xy[:, 0], xy[:, 1], 3, 7, 16, (-lim, lim), (-lim, lim))

    xy = rotation(xy, -np.pi/8)

    lim = np.sqrt(2)

    mysubplot(xy[:, 0], xy[:, 1], 3, 7, 17, (-lim, lim), (-lim, lim))

    y = 2*x**2 + rs.uniform(-1, 1, n)

    mysubplot(x, y, 3, 7, 18, (-1, 1), (-1, 3))

    y = (x**2 + rs.uniform(0, 0.5, n)) * \

        np.array([-1, 1])[rs.random_integers(0, 1, size=n)]

    mysubplot(x, y, 3, 7, 19, (-1.5, 1.5), (-1.5, 1.5))

    y = np.cos(x * np.pi) + rs.uniform(0, 1/8, n)

    x = np.sin(x * np.pi) + rs.uniform(0, 1/8, n)

    mysubplot(x, y, 3, 7, 20, (-1.5, 1.5), (-1.5, 1.5))

    xy1 = np.random.multivariate_normal([3, 3], [[1, 0], [0, 1]], int(n/4))

    xy2 = np.random.multivariate_normal([-3, 3], [[1, 0], [0, 1]], int(n/4))

    xy3 = np.random.multivariate_normal([-3, -3], [[1, 0], [0, 1]], int(n/4))

    xy4 = np.random.multivariate_normal([3, -3], [[1, 0], [0, 1]], int(n/4))

    xy = np.concatenate((xy1, xy2, xy3, xy4), axis=0)

    mysubplot(xy[:, 0], xy[:, 1], 3, 7, 21, (-7, 7), (-7, 7))

plt.figure(facecolor='white')

mvnormal(n=800)

rotnormal(n=200)

others(n=800)

plt.tight_layout()

plt.show()
python 特征选择 绘图 + mine的更多相关文章
- python常用绘图软件包记录
在没有使用python之前,觉得matlab的绘图功能还算可以~但现在发现python的绘图包真的好强大,绘制出的图像非常专业漂亮,但具体使用还有待学习,这里记录学习过程中遇到的python绘图包,以 ...
- Python之绘图和可视化
Python之绘图和可视化 1. 启用matplotlib 最常用的Pylab模式的IPython(IPython --pylab) 2. matplotlib的图像都位于Figure对象中. 可以使 ...
- 10分钟轻松学会python turtle绘图
 1. 画布(canvas) 1.1 相关函数: 2. 画笔 2.1 画笔的状态 2.2 画笔的属性 2.3 绘图命令 3. 命令详解 4. 绘图举例 4.1 太阳花 4.2 绘制小蟒蛇 4.3 绘 ...
- python matplotlib 绘图基础
在利用Python做数据分析时,探索数据以及结果展现上图表的应用是不可或缺的. 在Python中通常情况下都是用matplotlib模块进行图表制作. 先理下,matplotlib的结构原理: mat ...
- 10分钟轻松学会 Python turtle 绘图
python2.6版本中后引入的一个简单的绘图工具,叫做海龟绘图(Turtle Graphics),turtle库是python的内部库,使用导入即可 import turtle 先说明一下turtl ...
- Python函数绘图
最近看数学,发现有时候画个图还真管用,对理解和展示效果都不错.尤其是三维空间和一些复杂函数,相当直观,也有助于解题.本来想用mathlab,下载安装都太费事,杀鸡不用牛刀,Python基本就能实现.下 ...
- 【Matplotlib】利用Python进行绘图
[Matplotlib] 教程:https://morvanzhou.github.io/tutorials/data-manipulation/plt/ 官方文档:https://matplotli ...
- python海龟绘图
最近学了python,看了几本书之后,才明白python的强大,python是一种解释型的语言,即每写一行程序就执行一行. 而且在科学计算方面,处理的能力特别的方便. 比如python中的字典dict ...
- 【震惊】手把手教你用python做绘图工具(一)
在这篇博客里将为你介绍如何通过numpy和cv2进行结和去创建画布,包括空白画布.白色画布和彩色画布.创建画布是制作绘图工具的前提,有了画布我们就可以在画布上尽情的挥洒自己的艺术细胞. 还在为如何去绘 ...
随机推荐
- 浏览器登录cookie
<!DOCTYPE html PUBLIC "-//W3C//DTD XHTML 1.0 Transitional//EN" "http://www.w3.o ...
- XtraBackup备份mysql5.1.73
一.基础介绍 mysql5.1在源码中配备了两个版本的innodb存储引擎源码:innobase和innodb_plugin,编译安装的时候可以通过参数--with-plugins=innobase, ...
- python mysql orm
Python中操作mysql的pymysql模块详解:https://www.cnblogs.com/wt11/p/6141225.html Python 12 - Mysql & ORM:h ...
- 自定义tabpageindicator,可以自定义tab是三角形还是矩形,但是tab不具有滑动的功能
我是不会滴,但是看了一些大神写的,我修改了一下,大家可以参照参照 一,自定义Mytabpageindicator,直接贴代码了,具体的在代码中有注释 package com.wangy.mytabpa ...
- poj2075
Tangled in Cables Time Limit: 1000MS Memory Limit: 30000K Total Submissions: 6348 Accepted: 2505 ...
- 【BZOJ3784】树上的路径 点分治序+ST表
[BZOJ3784]树上的路径 Description 给定一个N个结点的树,结点用正整数1..N编号.每条边有一个正整数权值.用d(a,b)表示从结点a到结点b路边上经过边的权值.其中要求a< ...
- An Ordinary Game(简单推导)
An Ordinary Game Time limit : 2sec / Memory limit : 256MB Score : 500 points Problem Statement There ...
- Moore-Penrose Matrix Inverse 摩尔-彭若斯广义逆 埃尔米特矩阵 Hermitian matrix
http://mathworld.wolfram.com/Moore-PenroseMatrixInverse.html 显然,埃尔米特矩阵主对角线上的元素都是实数的,其特征值也是实数.对于只包含实数 ...
- mongodb 的注意点
昨天同事安装mongodb遇到了些问题,问了下我,后拉发现都是些细节没注意(讲道理这应该是很简单,一顿操作就ok的事情) 首先,下载 mongo包, 然后 ,解压安装, 启动之. 问题就出现在他后台启 ...
- did not find a matching property (tomcat+Eclipse 报错)
警告: [SetPropertiesRule]{Server/Service/Engine/Host/Context} Setting property 'source' to 'org.eclips ...