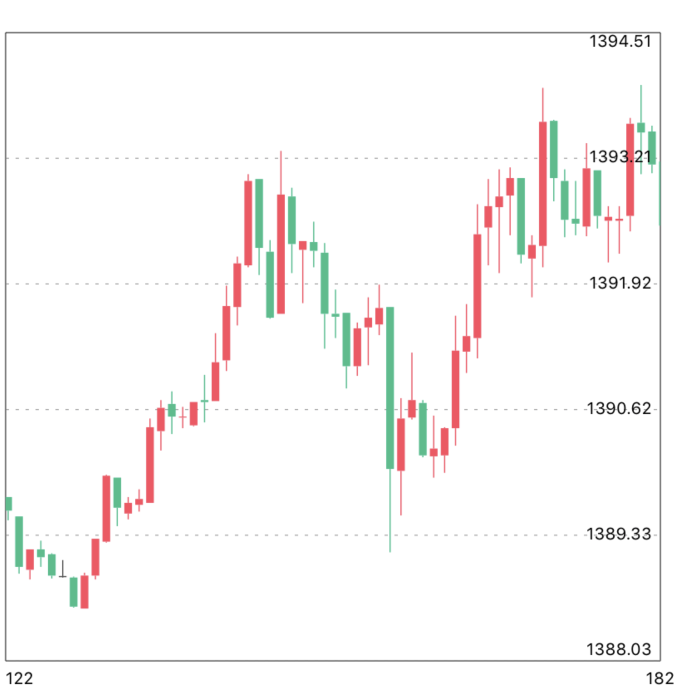
iOS 图表工具charts之CandleStickChartView(K线)
关于charts的系列视图介绍传送门:
iOS 图表工具charts介绍
iOS 图表工具charts之LineChartView
iOS 图表工具charts之BarChartView
iOS 图表工具charts之PieChartView
iOS 图表工具charts之CandleStickChartView
iOS 图表工具charts之CombinedChartView
CandleStickChartView在charts中可以用来绘制K线图,由于charts是基于swift开发的,如果需要和objective-C混编(通过pod的方式不用管),可以参考我的上几篇文章iOS OC中桥接swift第三方库》,这里主要讲的是CandleStickChartView的一些常用属性和一些基本用法,实际情况以开发为准
CandleStickChartView的基本属性介绍
    CandleStickChartView *chartView = [[CandleStickChartView alloc] init];

    //设置偏移

    [chartView setExtraOffsetsWithLeft:10 top:10 right:10 bottom:10];

    //开启border

    chartView.drawBordersEnabled = YES;

    chartView.borderLineWidth = .5f;

    chartView.borderColor = UIColor.blackColor;

    //设置背景

    chartView.drawGridBackgroundEnabled = NO;

    chartView.gridBackgroundColor = [UIColor grayColor];

    //无内容显示

    chartView.noDataText = @"";

    //关闭描述

    chartView.chartDescription.enabled = NO;

    chartView.chartDescription.text = @"tiny`s kLineChart demo";

    //关闭图例

    chartView.legend.enabled = NO;

    //缩放

    chartView.scaleXEnabled = YES;

    chartView.scaleYEnabled = NO;

    chartView.autoScaleMinMaxEnabled = YES;

    chartView.highlightPerTapEnabled = YES;

    chartView.highlightPerDragEnabled = NO;

    chartView.pinchZoomEnabled = NO;  //手势捏合

    chartView.dragEnabled = YES;  //开启拖拽

    chartView.dragDecelerationFrictionCoef = 0.5;  //0 1 惯性

    chartView.doubleTapToZoomEnabled = NO;

    //代理

    chartView.delegate = self;

    //leftAxis

    ChartYAxis *rightAxis = chartView.rightAxis;

    rightAxis.enabled = YES;

    rightAxis.labelPosition = YAxisLabelPositionInsideChart;

    rightAxis.drawGridLinesEnabled = YES;

    rightAxis.gridLineDashLengths = @[@2,@4];

    rightAxis.labelTextColor = UIColor.blackColor;

    rightAxis.labelFont = [UIFont systemFontOfSize:10];

    rightAxis.decimals = 2;

    rightAxis.labelCount = 6;  //设置显示最大点数

    rightAxis.forceLabelsEnabled = YES;  //强制label个数

//    leftAxis.inverted = YES;

    //设置样式

    LeftAxisFormatter *leftFormatter = [LeftAxisFormatter new];

    leftFormatter.digital = 2;

    rightAxis.valueFormatter = leftFormatter;

    //rightAxis

    ChartYAxis *leftAxis = chartView.leftAxis;

    leftAxis.enabled = NO;

    //xAxis

    ChartXAxis *xAxis = chartView.xAxis;

    xAxis.enabled = YES;

    xAxis.labelPosition = XAxisLabelPositionBottom;

    xAxis.labelCount = 2;  //设置显示点数

    xAxis.forceLabelsEnabled = YES;  //强制label个数

    xAxis.avoidFirstLastClippingEnabled = YES;  //避免文字显示不全 这个属性很重要

    xAxis.granularityEnabled = YES;  //设置重复不显示

    //不画线

    xAxis.drawGridLinesEnabled = NO;

    xAxis.spaceMin = 0.5;

    xAxis.spaceMax = 0.5;
CandleChartDataEntry代码每个柱子图形
    NSMutableArray *array = [NSMutableArray array];

    for (int i = 0; i < datas.count; i++) {

        NSDictionary *dict = datas[i];

        double high = [dict[@"dbHighPrice"] doubleValue];

        double low = [dict[@"dbLowPrice"] doubleValue];

        double open = [dict[@"dbOpenPrice"] doubleValue];

        double close = [dict[@"dbClosePrice"] doubleValue];

        CandleChartDataEntry *entry = [[CandleChartDataEntry alloc] initWithX:(i) shadowH:high shadowL:low open:open close:close];

        [array addObject:entry];

    }
CandleChartDataSet代码所有的柱子的集合
    CandleChartDataSet *set = [[CandleChartDataSet alloc] initWithEntries:array label:@"kLine DataSet"];

    //下降颜色 是否填充填充

    set.decreasingColor = UIColorHex(0x32BE89);

    set.decreasingFilled = YES;

    //上升颜色 是否填充填充

    set.increasingColor = UIColorHex(0xFD4C60);

    set.increasingFilled = YES;

    //显示美国线

    //set.showCandleBar = NO;

    //阴影线的宽度 颜色跟随

    set.shadowWidth = 0.7;

    set.shadowColorSameAsCandle = YES;

    //k线柱间隙

    set.barSpace = 0.15;

    //是否现在十字标识

    set.drawHorizontalHighlightIndicatorEnabled = NO;

    set.drawVerticalHighlightIndicatorEnabled = NO;

    //轴线方向

    set.axisDependency = AxisDependencyRight;

    //不显数字

    set.drawValuesEnabled = NO;
CandleChartData
    //创建数据

    CandleChartData *candleData = [[CandleChartData alloc] initWithDataSet:set];

    //赋值

    self.chartView.data = candleData;
一些需要注意的点:
1.显示美国线
    CandleChartDataSet:

    set.showCandleBar = NO
2.影线的颜色跟随k线,这样就会根据k线值自动变成绿色或者红色
    CandleChartDataSet:

    set.shadowWidth = 0.7;

    set.shadowColorSameAsCandle = YES;
3.k线上升颜色,是否填充等属性,用来设置上升颜色下降颜色,是否是空心实心k线
    CandleChartDataSet:

    //下降颜色 是否填充填充

    set.decreasingColor = UIColorHex(0x32BE89);

    set.decreasingFilled = YES;

    //上升颜色 是否填充填充

    set.increasingColor = UIColorHex(0xFD4C60);

    set.increasingFilled = NO;
4.是否显示k线值
    CandleChartDataSet:

    //不显数字

    set.drawValuesEnabled = NO;
5.是否显示十字光标
    CandleChartDataSet:

    set.drawHorizontalHighlightIndicatorEnabled = NO;

    set.drawVerticalHighlightIndicatorEnabled = NO;
6.轴线方向 AxisDependencyRight 这样当我们滑动k线的时候k线会根据当前k线最大值和最小值调整缩放比例
    CandleChartDataSet:

    //轴线方向

    set.axisDependency = AxisDependencyRight;
7.k线设置缩放比例,最大缩放值 最小缩放值
    //最大缩放值 最小缩放值  y轴不缩放 minScl maxScl根据实际情况调整

    [self.chartView setScaleMinima:minScl scaleY:1];

    [self.chartView.viewPortHandler setMaximumScaleX:maxScl];
8.当前缩放比例设置
    CGAffineTransform srcMatrix = _chartView.viewPortHandler.touchMatrix;

    //scl根据实际情况设置当前缩放比例

    srcMatrix.a = scl;

    [self.chartView.viewPortHandler refreshWithNewMatrix:srcMatrix chart:self.chartView invalidate:YES];
9.k线移动到指定位置 第一次需要滚动到最新值
    //开局移动到最右边xMax为最大x轴值

    [self.chartView moveViewToX:self.chartView.data.xMax];
10.选中k线,拿到当前选中的点的x轴坐标,以便于拿到选中的model
//k线代理方法

-(void)chartValueSelected:(ChartViewBase *)chartView entry:(ChartDataEntry *)entry highlight:(ChartHighlight *)highlight{

     NSInteger index = highlight.x;

    //index为当前选中的x值

    if(index  < self.datas.count){

        //根据当前的index能拿到对应的数据模型

        Model *model = self.datas[index];

    }

}
其他待续
转载请标注来源:https://www.cnblogs.com/qqcc1388/
iOS 图表工具charts之CandleStickChartView(K线)的更多相关文章
- iOS 图表工具charts之CombinedChartView
关于charts的系列视图介绍传送门: iOS 图表工具charts介绍 iOS 图表工具charts之LineChartView iOS 图表工具charts之BarChartView iOS 图表 ...
- iOS 图表工具charts之LineChartView
关于charts的系列视图介绍传送门: iOS 图表工具charts介绍 iOS 图表工具charts之LineChartView iOS 图表工具charts之BarChartView iOS 图表 ...
- iOS 图表工具charts介绍
charts是一个很好的绘图工具,功能非常强大,可以用来绘制折线,柱状图,饼状图,k线图,k线分时图,雷达图,气泡图等等,charts是一款仿照安卓 MPAndroidChart而来的一个基于swif ...
- iOS 图表工具charts之BarChartView
关于charts的系列视图介绍传送门: iOS 图表工具charts介绍 iOS 图表工具charts之LineChartView iOS 图表工具charts之BarChartView iOS 图表 ...
- iOS 图表工具charts之PieChartView
关于charts的系列视图介绍传送门: iOS 图表工具charts介绍 iOS 图表工具charts之LineChartView iOS 图表工具charts之BarChartView iOS 图表 ...
- JHChart 1.1.0 iOS图表工具库中文ReadMe
JHChart(最新版本1.1.0) 好吧,的确当前的github上已经存有不少的iOS图表工具库,然而,当公司的项目需要图表时,几乎没有哪个第三方能够完全满足我的项目需求.无奈之下,本人不得不花费一 ...
- JHChart iOS图表工具库1.0.3新版本详解
前言. 从2016年4月14日开始,本人着手开发了JHChart图表工具库.经过断断续续的开发,截止到现在,已经实现了折线图.柱状图.饼状图.环形图和表格样式的图表功能.为了方便使用,我已经将一个简单 ...
- iOS图表库Charts集成与使用
Charts是一个很优秀的图表库,它支持Android.iOS.tvOS和macOS,这样使用起来,可以节省学习成本,可以从GitHub上了解更多信息.本文记录在iOS项目上的集成与使用. Chart ...
- iOS 使用Charts框架 折线,柱状,K线,饼状,雷达全攻略
我是前言: 大约几个月前我在某平台写了一篇文章, 文中简单地介绍了Charts两种图表的样式的使用, 不过有种意犹未尽的感觉, 利用周末的空闲时间再次看了看, 有了新的收获, 今天发出来,分享给大家, ...
随机推荐
- Windwos Java‘bat 环境变量配置脚本
@echo off echo 正在设置Java环境变量 pause wmic ENVIRONMENT create name="JAVA_HOME",username=" ...
- Linux inode 详解
操作系统的文件数据除了实际内容之外,通常含有非常多的属性,例如Linux操作系统的文件权限与文件属性.文件系统通常会将这两部分内容分别存放在inode和block中. inode 和 block 概述 ...
- 测试数年来,我只提了几十个bug
---恢复内容开始--- 测试做了十来年,大大小小的项目产品已经记不清了,开发们在一如既往地改着改了无数遍的bug,测试也一如既往的提着提了无数遍的bug,那么今天笔者对以往的bug类型做一个简单的总 ...
- 简单xml示例
using System; using System.Collections.Generic; using System.Linq; using System.Text; using System.X ...
- Gym - 101170B British Menu (强连通缩点+dp)
题意:求一个有向图上的最长路(每个强连通分量的点不超过5个) 首先对强连通分量缩点,暴力预处理出len[k][i][j]表示第k个强连通分量里的第i个点和第j个点之间的最长路径,设状态(k,i,f)表 ...
- shell知识点(一)
Shell1.概述Shell是一个命令行解释器,它接收应用程序/用户命令,然后调用操作系统内核还是一个功能相当强大的编程语言,易编写.易调试.灵活性强2.shell解析器查看linux提供的shell ...
- SpringCloud使用feign时的复杂参数传递(转)
Feign传参注意 最近在用SpringCloud尝试重构以前的项目,使用Feign客户端组件来调用微服务,经常出现参数传不过去变成null的问题,网上查了一下发现feign在参数上的使用还是有一定的 ...
- [转帖]H5 手机 App 开发入门:技术篇
H5 手机 App 开发入门:技术篇 http://www.ruanyifeng.com/blog/2019/12/mobile-app-technology-stack.html 阮一峰老师的文 ...
- 自定义 Swiper 的pageControl
.part5-bg .swiper2 .swiper-pagination2{ bottom: 0.4rem; } /*未选中的小圆点样式*/ .part5-bg .swiper2 .swiper-p ...
- 6、Lambda表达式(推荐使用)
Lambda表达式(匿名的函数对象),是C++11增加的新特性,Qt配合信号一起使用,非常方便. pro项目文件中引入了这种特性: CONFIG += c++11 通过connect来了解Lambda ...