matplotlib命令与格式:标题(title),标注(annotate),文字说明(text)
1.title设置图像标题
- boxstyle方框外形
- facecolor(简写fc)背景颜色
- edgecolor(简写ec)边框线条颜色
- edgewidth边框线条大小
(2)title例子:
面向对象api例子:
- import matplotlib.pyplot as plt
- x=[1,2,3,4,5]
- y=[3,6,7,9,2]
- fig,ax=plt.subplots(1,1)
- ax.plot(x,y,label='trend')
- ax.set_title('title test',fontsize=12,color='r')
- plt.show()
2.annotate标注文字
(1)annotate语法说明 :annotate(s='str' ,xy=(x,y) ,xytext=(l1,l2) ,..)
s 为注释文本内容
xy 为被注释的坐标点
xytext 为注释文字的坐标位置
xycoords 参数如下:
- figure points points from the lower left of the figure 点在图左下方
- figure pixels pixels from the lower left of the figure 图左下角的像素
- figure fraction fraction of figure from lower left 左下角数字部分
- axes points points from lower left corner of axes 从左下角点的坐标
- axes pixels pixels from lower left corner of axes 从左下角的像素坐标
- axes fraction fraction of axes from lower left 左下角部分
- data use the coordinate system of the object being annotated(default) 使用的坐标系统被注释的对象(默认)
- polar(theta,r) if not native ‘data’ coordinates t
extcoords 设置注释文字偏移量
arrowprops #箭头参数,参数类型为字典dict
- width the width of the arrow in points 点箭头的宽度
- headwidth the width of the base of the arrow head in points 在点的箭头底座的宽度
- headlength the length of the arrow head in points 点箭头的长度
- shrink fraction of total length to ‘shrink’ from both ends 总长度为分数“缩水”从两端
- facecolor 箭头颜色
bbox给标题增加外框 ,常用参数如下:
- boxstyle方框外形
- facecolor(简写fc)背景颜色
- edgecolor(简写ec)边框线条颜色
- edgewidth边框线条大小
bbox=dict(boxstyle='round,pad=0.5', fc='yellow', ec='k',lw=1 ,alpha=0.5) #fc为facecolor,ec为edgecolor,lw为lineweight
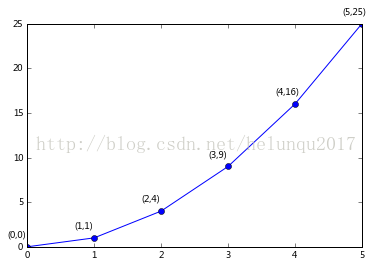
(2)案例
- import matplotlib.pyplot as plt
- import numpy as np
- x = np.arange(0, 6)
- y = x * x
- plt.plot(x, y, marker='o')
- for xy in zip(x, y):
- plt.annotate("(%s,%s)" % xy, xy=xy, xytext=(-20, 10), textcoords='offset points')
- plt.show()
plt.annotate('local max', xy=(2, 1), xytext=(3, 1.5),arrowprops=dict(facecolor='black', shrink=0.05))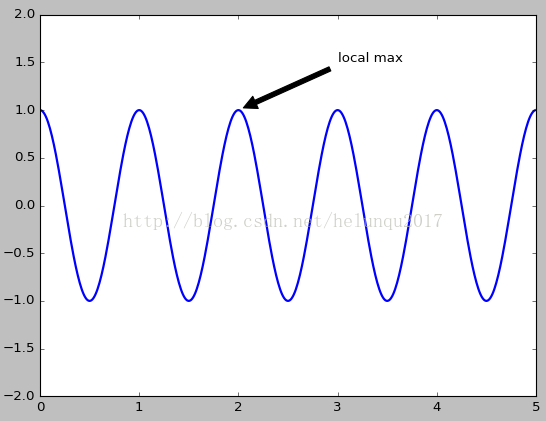
3.text设置文字说明
(1)text语法说明
text(x,y,string,fontsize=15,verticalalignment="top",horizontalalignment="right")
x,y:表示坐标值上的值
string:表示说明文字
fontsize:表示字体大小
verticalalignment:垂直对齐方式 ,参数:[ ‘center’ | ‘top’ | ‘bottom’ | ‘baseline’ ]
horizontalalignment:水平对齐方式 ,参数:[ ‘center’ | ‘right’ | ‘left’ ]
xycoords选择指定的坐标轴系统:
- figure points points from the lower left of the figure 点在图左下方
- figure pixels pixels from the lower left of the figure 图左下角的像素
- figure fraction fraction of figure from lower left 左下角数字部分
- axes points points from lower left corner of axes 从左下角点的坐标
- axes pixels pixels from lower left corner of axes 从左下角的像素坐标
- axes fraction fraction of axes from lower left 左下角部分
- data use the coordinate system of the object being annotated(default) 使用的坐标系统被注释的对象(默认)
- polar(theta,r) if not native ‘data’ coordinates t
arrowprops #箭头参数,参数类型为字典dict
- width the width of the arrow in points 点箭头的宽度
- headwidth the width of the base of the arrow head in points 在点的箭头底座的宽度
- headlength the length of the arrow head in points 点箭头的长度
- shrink fraction of total length to ‘shrink’ from both ends 总长度为分数“缩水”从两端
- facecolor 箭头颜色
bbox给标题增加外框 ,常用参数如下:
- boxstyle方框外形
- facecolor(简写fc)背景颜色
- edgecolor(简写ec)边框线条颜色
- edgewidth边框线条大小
bbox=dict(boxstyle='round,pad=0.5', fc='yellow', ec='k',lw=1 ,alpha=0.5) #fc为facecolor,ec为edgecolor,lw为lineweight
(2)案例
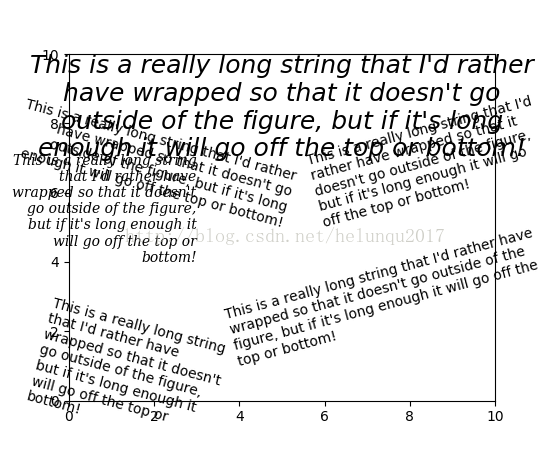
- import matplotlib.pyplot as plt
- fig = plt.figure()
- plt.axis([0, 10, 0, 10])
- t = "This is a really long string that I'd rather have wrapped so that it"\
- " doesn't go outside of the figure, but if it's long enough it will go"\
- " off the top or bottom!"
- plt.text(4, 1, t, ha='left', rotation=15, wrap=True)
- plt.text(6, 5, t, ha='left', rotation=15, wrap=True)
- plt.text(5, 5, t, ha='right', rotation=-15, wrap=True)
- plt.text(5, 10, t, fontsize=18, style='oblique', ha='center',va='top',wrap=True)
- plt.text(3, 4, t, family='serif', style='italic', ha='right', wrap=True)
- plt.text(-1, 0, t, ha='left', rotation=-15, wrap=True)
- plt.show()
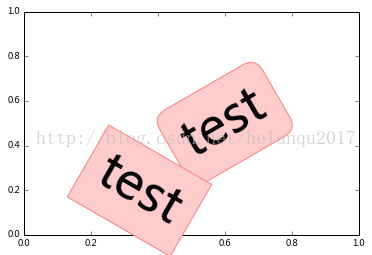
- import matplotlib.pyplot as plt
- plt.text(0.6, 0.5, "test", size=50, rotation=30.,ha="center", va="center",bbox=dict(boxstyle="round",ec=(1., 0.5, 0.5),fc=(1., 0.8, 0.8),))
- plt.text(0.5, 0.4, "test", size=50, rotation=-30.,ha="right", va="top",bbox=dict(boxstyle="square",ec=(1., 0.5, 0.5),fc=(1., 0.8, 0.8),))
- plt.draw()
- plt.show()
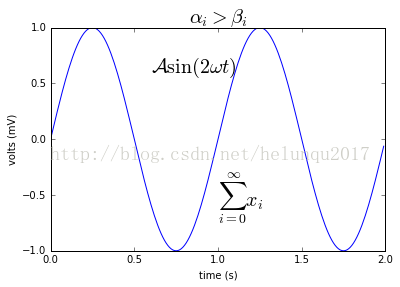
数学公式:
- plt.title(r'$\alpha_i > \beta_i$', fontsize=20)
- plt.text(1, -0.6, r'$\sum_{i=0}^\infty x_i$', fontsize=20)
- plt.text(0.6, 0.6, r'$\mathcal{A}\mathrm{sin}(2 \omega t)$',fontsize=20)
matplotlib命令与格式:标题(title),标注(annotate),文字说明(text)的更多相关文章
- matplotlib命令与格式:参数配置文件与参数配置
转自 https://my.oschina.net/swuly302/blog/94805 自定义matplotlib Created Saturday 08 December 2012 5.1 ma ...
- (三)Linux命令基本格式以及文件处理命令
命令基本格式 (1)命令提示符 如下是命令行的命令提示符,以此为例,讲解含义. 其中: root 当前登录用户名 localhost 主机名 ~ 当前所在的目录(即家目录,用户登录的初始位置) # 超 ...
- 十条常用nmap命令行格式
十条常用nmap命令行格式 ) 获取远程主机的系统类型及开放端口 nmap -sS -P0 -sV -O <target> 这里的 < target > 可以是单一 IP, 或 ...
- javascript 的Date 格式化, 模仿shell中date命令的格式
原文:javascript 的Date 格式化, 模仿shell中date命令的格式 shell 中显示当前的日期 [root@localhost]$ date '+%Y-%m-%d %H:%M:%S ...
- Python生成PASCAL VOC格式的xml标注文件
Python生成PASCAL VOC格式的xml标注文件 PASCAL VOC数据集的标注文件是xml格式的.对于py-faster-rcnn,通常以下示例的字段是合适的: <annotatio ...
- DOS中命令的格式
---------------siwuxie095 一.DOS中,命令使用格式的一般形式 用中文表达的形式为: [路径] 关键字 [盘符] [路径] 文件名 [扩展名] (参数) [参数 ...
- 山寨今日头条的标题title效果
山寨今日头条的标题title效果 效果: 源码: // // ViewController.m // 今日头条 // // Created by YouXianMing on 14/11/26. // ...
- 使用jquery修改标题$("title").html("标题")应注意的问题
使用jquery修改标题$("title").html("标题")应注意的问题: 如果修改后的标题和原标题一致,jquery会跳过该操作,这种情况再从其他页面回 ...
- SEO页面标题Title的优化
我在一个月前改过页面标题(Title),随后表现是:百度网页快照4天不更新,Google正常.而我仅仅是改了两个词组而已.在建博初期,修改Title的最频繁的时期,下面卢松松就我经历的修改Title过 ...
随机推荐
- C++学习之new与delete、malloc与free
在C/C++的面试时,对于new/delete和malloc/free这两对的使用和区别经常被考查到,如果这种基础的问题都答不上来,估计很难过面试了.这篇文章仅仅是浅显的讲一下,仅供参考. 一.new ...
- 重启标志log
01) fatal error : 如下: [ >.()[:swapper/][name:disp_lcm&][DISP]disp_lcm_probe [ >.()[:swappe ...
- 等价表达式 2005年NOIP全国联赛提高组(栈模拟)
P1054 等价表达式 题目描述 明明进了中学之后,学到了代数表达式.有一天,他碰到一个很麻烦的选择题.这个题目的题干中首先给出了一个代数表达式,然后列出了若干选项,每个选项也是一个代数表达式,题目的 ...
- [Swift通天遁地]二、表格表单-(3)在表格中嵌套另一个表格并使Cell的高度自适应
★★★★★★★★★★★★★★★★★★★★★★★★★★★★★★★★★★★★★★★★➤微信公众号:山青咏芝(shanqingyongzhi)➤博客园地址:山青咏芝(https://www.cnblogs. ...
- 马拉车算法(Manacher's Algorithm)
这是悦乐书的第343次更新,第367篇原创 Manacher's Algorithm,中文名叫马拉车算法,是一位名叫Manacher的人在1975年提出的一种算法,解决的问题是求最长回文子串,神奇之处 ...
- $P5269 欧稳欧再次学车$
\(problem\) 哇 看各位巨佬都来发\(T1\)的题解 我也来发一篇.(别的题目不会别瞎bb) 题目大意就是 \(T\) 秒 能走多少路程 第一行六个整数 \(T,N,L,R,X,K\) 接下 ...
- UNIX环境高级编程--8. 进程控制
进程控制进程标识: 每一个进程都有一个非负整型表示的唯一进程ID.虽然唯一,但是ID可以复用.当一个进程结束后,其进程ID会被延迟复用. ID=0的进程通常是调度进程,常被称作交换进程(s ...
- 【转】Linux字符转换命令col
转自:http://www.cnblogs.com/ningvsban/p/3725464.html [root@www ~]# col [-xb]选项与参数:-x :将 tab 键转换成对等的空格键 ...
- Extension Methods(扩展方法)
在 OOPL 中,有静态方法.实例方法和虚方法,如下: public sealed class String { public static bool IsNullOrEmpty(st ...
- js面试笔试题
1. Js的Typeof返回类型有那些? string:undefined:number; function:object:boolean:symbol(ES6) 2. null和undefined的 ...