[k8s]dashboard1.8.1搭建( heapster1.5+influxdb+grafana)
dashboard最终效果
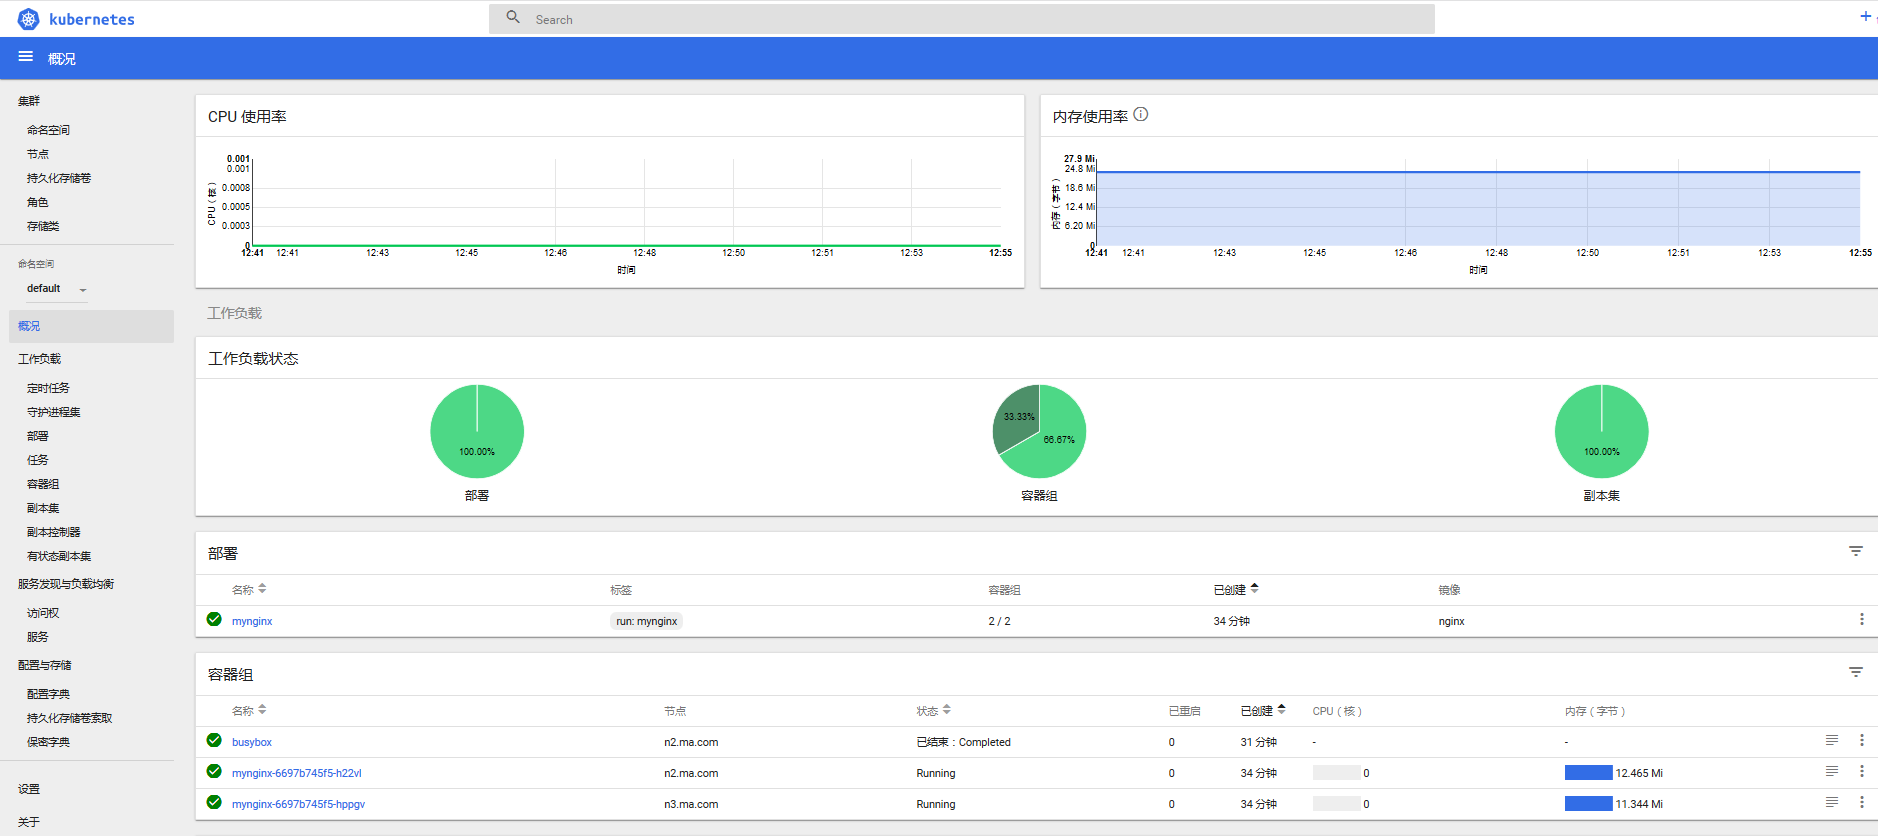
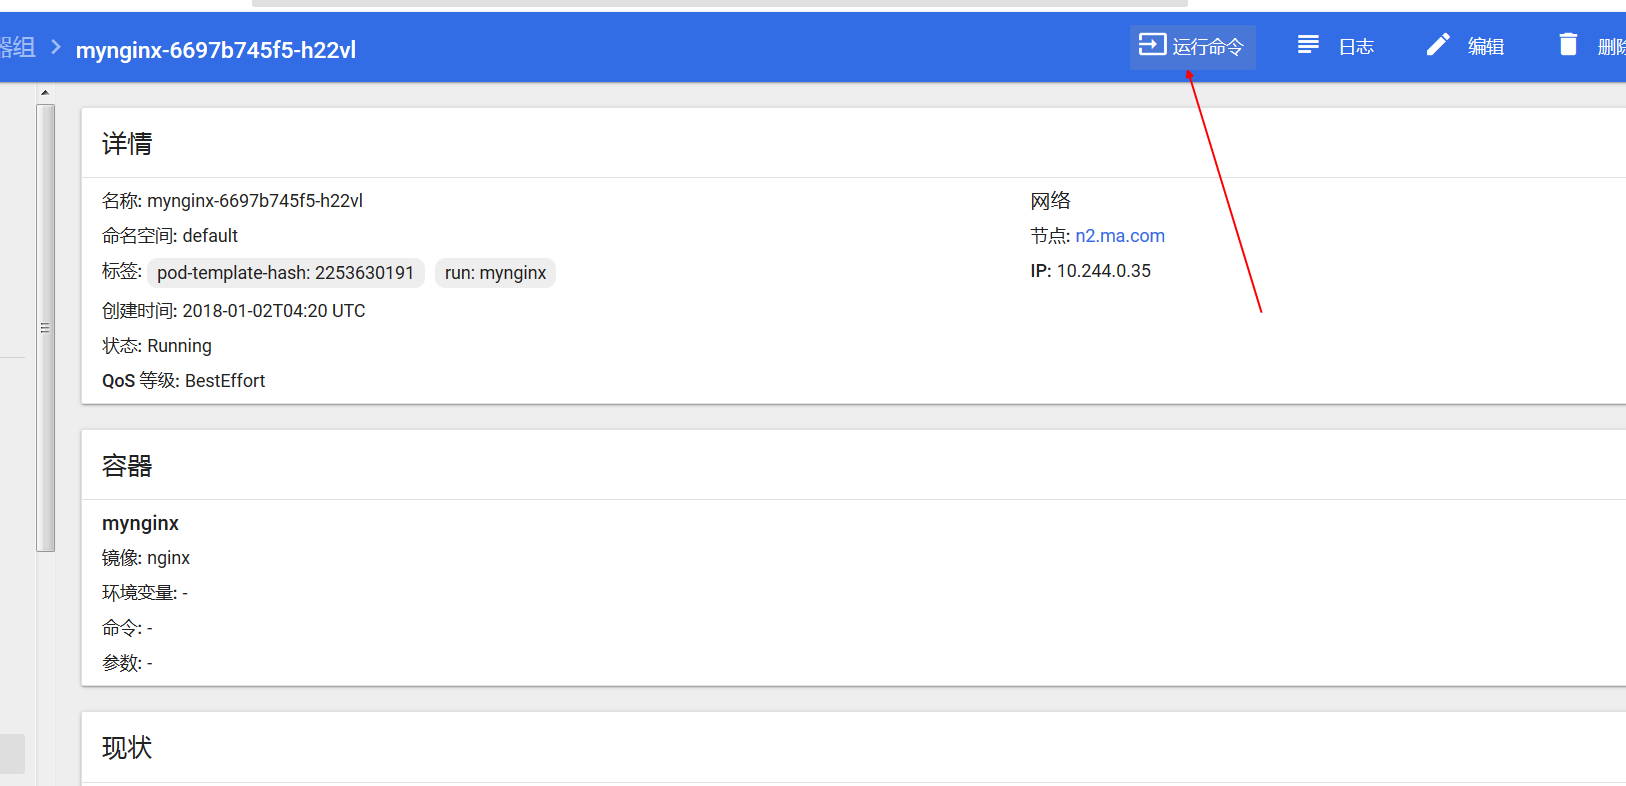
多了执行sh的窗口
heapster+influxdb+grafana搭建
整个架构是 dashboard去检测 hepster service服务, heapster通过cadvisor搜集到数据入库到influxdb. 而dashboard访问heapster的svc的8086端口获取数据绘图.
准备yaml
https://github.com/kubernetes/heapster/blob/master/deploy/kube-config/influxdb

[root@n1 influxdb]# tree .

.

├── grafana.yaml

├── heapster.yaml

└── influxdb.yaml
修改镜像并创建
[root@n1 influxdb]# grep -r image: .

./influxdb.yaml:        image: lanny/k8s.gcr.io_heapster-influxdb-amd64:v1.3.3

./grafana.yaml:        image: lanny/k8s.gcr.io_heapster-grafana-amd64:v4.4.3

./heapster.yaml:        image: lanny/gcr.io_google_containers_heapster-amd64:v1.5.0

注: 这里用v1.5.0的heapster.看release用最新的,官方的yaml可能还是旧的
dashboard1.8.1
部署dashboard 1.8.1
https://github.com/kubernetes/dashboard/releases
dashboard.yaml
apiVersion: extensions/v1beta1

kind: Deployment

metadata:

  labels:

    app: kubernetes-dashboard

  name: kubernetes-dashboard

  namespace: kube-system

spec:

  replicas: 1

  selector:

    matchLabels:

      app: kubernetes-dashboard

  template:

    metadata:

      labels:

        app: kubernetes-dashboard

      # Comment the following annotation if Dashboard must not be deployed on master

      annotations:

        scheduler.alpha.kubernetes.io/tolerations: |

          [

            {

              "key": "dedicated",

              "operator": "Equal",

              "value": "master",

              "effect": "NoSchedule"

            }

          ]

    spec:

      containers:

      - name: kubernetes-dashboard

        image: lanny/gcr.io_google_containers_kubernetes-dashboard-amd64:v1.8.1

        imagePullPolicy: IfNotPresent

        ports:

        - containerPort: 9090

          protocol: TCP

        args:

          # Uncomment the following line to manually specify Kubernetes API server Host

          # If not specified, Dashboard will attempt to auto discover the API server and connect

          # to it. Uncomment only if the default does not work.

          # - --apiserver-host=http://my-address:port

           - --apiserver-host=http://192.168.x.x:8080

           - --heapster-host=http://heapster  #要有这玩意,不然创建后可能heapster检查失败,导致ui不显示图形.

        livenessProbe:

          httpGet:

            path: /

            port: 9090

          initialDelaySeconds: 30

          timeoutSeconds: 30

---

kind: Service

apiVersion: v1

metadata:

  labels:

    app: kubernetes-dashboard

  name: kubernetes-dashboard

  namespace: kube-system

spec:

  type: NodePort

  ports:

  - port: 80

    targetPort: 9090

  selector:

    app: kubernetes-dashboard
出现的问题
ui图形不展示
dashboard的日志: dashboard会去连heapster的8082端口获取数据来展示图形. 这里看到heapster连不上,但是heapster的日志没问题
2018/01/02 04:14:29 Metric client health check failed: an error on the server ("Error: 'dial tcp 10.244.1.43:8082: getsockopt: connection refused'\nTrying to reach: 'http://10.244.1.43:8082/healthz'") has prevented the request from succeeding (get services heapster). Retrying in 30 seconds.

2018/01/02 04:15:20 Metric client health check failed: an error on the server ("Error: 'dial tcp 10.244.1.43:8082: getsockopt: connection refused'\nTrying to reach: 'http://10.244.1.43:8082/healthz'") has prevented the request from succeeding (get services heapster). Retrying in 30 seconds.

2018/01/02 04:16:11 Metric client health check failed: an error on the server ("Error: 'dial tcp 10.244.1.43:8082: getsockopt: connection refused'\nTrying to reach: 'http://10.244.1.43:8082/healthz'") has prevented the request from succeeding (get services heapster). Retrying in 30 seconds.
解决: dashboard的yaml加- --heapster-host=http://heapster 参数即可
参考: https://github.com/kubernetes/dashboard/issues/1602
创建dashboard后,访问不出现ui
我用参考官网的https://raw.githubusercontent.com/kubernetes/dashboard/v1.8.1/src/deploy/recommended/kubernetes-dashboard.yaml
发现这个毛病,所有用了1.7的yaml,暂时没去深究.
[k8s]dashboard1.8.1搭建( heapster1.5+influxdb+grafana)的更多相关文章
- Jmeter监控平台搭建:JMeter+InfluxDB+Grafana
背景 平时一般用Jmeter的Gui模式,添加对应的插件,查看每秒线程数.TPS.响应时间等曲线,其实高并发是不建议这么看的. 解决方案 可以搭配InfluxDB+Grafana工具,使Jmeter异 ...
- Windows下本机简易监控系统搭建(Telegraf+Influxdb+Grafana)
一.文件准备 1.1 文件名称 telegraf-1.2.1_windows_amd64.zip influxdb-1.2.2_windows_amd64.zip grafana-4.2.0.wind ...
- Windows下本机简易监控系统搭建(Telegraf+Influxdb+Grafana)--转
原文地址:http://www.cnblogs.com/liugh/p/6683488.html 一.文件准备 1.1 文件名称 telegraf-1.2.1_windows_amd64.zip in ...
- 详解k8s原生的集群监控方案(Heapster+InfluxDB+Grafana) - kubernetes
1.浅析监控方案 heapster是一个监控计算.存储.网络等集群资源的工具,以k8s内置的cAdvisor作为数据源收集集群信息,并汇总出有价值的性能数据(Metrics):cpu.内存.netwo ...
- Telegraf+InfluxDB+Grafana搭建服务器监控平台
Telegraf+InfluxDB+Grafana搭建服务器监控平台 tags:网站 个人网站:https://wanghualong.cn/ 效果展示 本站服务器状态监控:https://statu ...
- collectd+influxDB+Grafana搭建性能监控平台
网上查看了很多关于环境搭建的文章,都比较久远了很多安装包源都不可用了,今天收集了很多资料组合尝试使用新版本来搭建,故在此记录. 采集数据(collectd)-> 存储数据(influxdb) - ...
- Telegraf+InfluxDB+Grafana快速搭建实时监控系统 监控postgresql
Telegraf+InfluxDB+Grafana快速搭建实时监控系统 监控postgresql
- .net core i上 K8S(一)集群搭建
1.前言 以前搭建集群都是使用nginx反向代理,但现在我们有了更好的选择——K8S.我不打算一上来就讲K8S的知识点,因为知识点还是比较多,我打算先从搭建K8S集群讲起,我也是在搭建集群的过程中熟悉 ...
- ASP.NET Core on K8S学习初探(1)K8S单节点环境搭建
当近期的一个App上线后,发现目前的docker实例(应用服务BFF+中台服务+工具服务)已经很多了,而我司目前没有专业的运维人员,发现运维的成本逐渐开始上来,所以容器编排也就需要提上议程.因此我决定 ...
随机推荐
- 字符串的公共前缀对Mysql B+树查询影响回溯分析
年前项目组接微信公众号. 上线之后,跟微信相关的用cid列的查询会话的SQL变慢了几十倍!思考这个问题思考了非常久.从出现以来一直是我心头的一个结.cid这一列是建了索引的,普通的cid列更新 ...
- Codeforces#86D Powerful array(分块暴力)
Description An array of positive integers a1, a2, ..., an is given. Let us consider its arbitrary su ...
- IIS 之 Web 服务器上的 ASP.NET 进程模型设置
配置 Microsoft Internet 信息服务 (IIS) Web 服务器上的 ASP.NET 进程模型设置. processModel 节只能在 Machine.config 文件中进行设置, ...
- Linux安装 微信开发者工具(deepin linux ubt)
一.环境:: deepin linux15.4.1 二.安装过程: 2.1 安装wine sudo apt-get install wine 2.2 安装nwjs-sdk 2.2.1 下载linux版 ...
- Java从零开始学四十一(反射简述二)
一.实例化Class类对象 实例化Class类对象的方法有三种: 第一种:通过forName()方法 第二种:类.class 第三种:对象.getClass() 二.Class类的常用方法 No. 方 ...
- Java从零开始学二十(集合简介)
一.为什么需要集合框架 数组的长度是固定的,但是如果写程序时并不知道程序运行时会需要多少对象.或者需要更复杂的方式存储对象,---那么,可以使用JAVA集合框架,来解决这类问题 二.集合框架主要接口 ...
- PyQt5教程——介绍(1)
PyQt5教程阅读须知 “PyQt5教程”系列若不做明显提示,默认翻译自zetcode. 有需要翻译精度的朋友可以自行阅读英文文档. 如果本系列博文侵犯了您的合法权益,请在博客中留下评论或联系:che ...
- angular.foEach
1.针对对象循环(key,value) 官方示例: var values = {name: 'misko', gender: 'male'}; var log = []; angular.forEac ...
- Theano Logistic Regression
原理 逻辑回归的推理过程能够參考这篇文章:http://blog.csdn.net/zouxy09/article/details/20319673,当中包括了关于逻辑回归的推理,梯度下降以及pyth ...
- ORACLE 11G 利用泠备份恢复standby库
利用泠备份恢复standby数据库 開始使用泠备份进行db恢复 2.1,停止掉standby库 SQL> shutdown immediate; Database closed. Databas ...