Graphviz 画图的一些总结
Graphviz
Graphviz 是一个自动排版的作图软件,可以生成 png pdf 等格式。
dot 语言
Graphviz 构建组件为 图,节点,边,用属性对其进行描述。
以下是定义DOT语言的抽象语法,约束的规则如下:
- 元素的终止以 粗体 显示
- 文字字符用单引号 '' 引起来
- 圆括号 () 的内容为必选项
- 方括号 [] 为可选项目
- 竖杠 | 为择一选择
| 声明 | 结构 |
|---|---|
| graph | [ strict ] (graph | digraph) [ ID ] '{' stmt_list '}' |
| stmt_list | [ stmt [ ';' ] stmt_list ] |
| stmt | node_stmt | edge_stmt | attr_stmt | ID '=' ID | subgraph |
| attr_stmt | (graph | node | edge) attr_list |
| attr_list | '[' [ a_list ] ']' [ attr_list ] |
| a_list | ID '=' ID [ (';' | ',') ] [ a_list ] |
| edge_stmt | (node_id | subgraph) edgeRHS [ attr_list ] |
| edgeRHS | edgeop (node_id | subgraph) [ edgeRHS ] |
| node_stmt | node_id [ attr_list ] |
| node_id | ID [ port ] |
| port | ':' ID [ ':' compass_pt ] | ':' compass_pt |
| subgraph | [ subgraph [ ID ] ] '{' stmt_list '}' |
| compass_pt | (n | ne | e | se | s | sw | w | nw | c | _) |
ID 其实就是一个字符串,为该组件的名称或者属性的名称,命名规则如下:
- 所有的字母
[a-zA-Z\200-\377]下划线,数字[0-9],数字不能出现在起始位置 - 纯数字 $[-]?(.[0-9]+ | [0-9]^+(.[0-9]*)6? $
- 所有用双引号引用的字符串
"..." - HTML 格式的字符串
<>
dot 语法的关键字
- strict, 严格的图限定,禁止创建多个相同的边
- graph, 无向图. 在图的创建时必须声明为有向图还是无向图
- digraph, 有向图
- node, 节点
- edge, 边
- subgraph, 子图
通过 dot 的抽象语法可以看到
- 整个 graph 必须使用 graph 或 digraph {} 进行限定说明图的属性
- 图里面的声明列表可以为空,也可以为多个,每个声明后的 ; 为可选项
- 声明有几种类型
- 节点 node
- 边 edge
- 子图 subgraph
- 属性列表
- ID = ID, 这个类型暂时还没有看到有什么作用
- 属性列表
- 必须使用中括号 [ ] 将列表项括起来
- 列表项为可选
- 属性列表项
- 以 key = value 的形式存在,列表项可选择 ',' 和 ';' 结尾
- 可存在多个列表项
- 边的声明
- 首端为 节点标识符或者子图,
- 右部分由边连接节点标识符或者子图构成,右部分可以存在多个
- 尾部可选属性列表
- 节点的声明
示例 节点的用法

node0 [label = "<postid1> string|<postid2> string|<postid3> string3", height=.5]`

node0:head[color=lightblue]  // 设置该部分的颜色
- 首部为节点标识符 节点部分(post) 方向 组成,其中后两项为可选项。
- 后半部分为可选的属性列表
| 方向 | 说明 |
|---|---|
| n | north 北 |
| ne | north east |
| e | east 东 |
| se | south east 东南 |
| s | south 南 |
| sw | south west 西南 |
| w | west 西 |
| nw | north west 西北 |
| c | center 中部 |
| _ | 任意 |
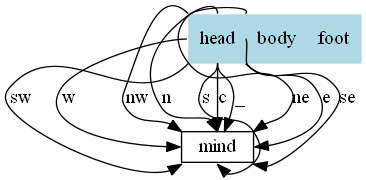
一个方向的示例
digraph action {

    node [shape = record,height=.1];

    node0 [label = "<head> head|<body> body|<foot> foot", height=.5]

    node2 [shape = box label="mind"]

    node0:head:n -> node2:n [label = "n"]

    node0:head:ne -> node2:ne [label = "ne"]

    node0:head:e -> node2:e [label = "e"]

    node0:head:se -> node2:se [label = "se"]

    node0:head:s -> node2:s [label = "s"]

    node0:head:sw -> node2:sw [label = "sw"]

    node0:head:w -> node2:w [label = "w"]

    node0:head:nw -> node2:nw [label = "nw"]

    node0:head:c -> node2:c [label = "c"]

    node0:head:_ -> node2:_ [label = "_"]

    node0:body[style=filled color=lightblue]

}
效果如下 图-1
绘制属性
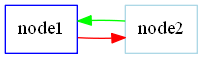
一个图中有非常多的 node 和 edge,如果每次都需要声明一个节点的属性会非常麻烦,有一个简单的方式为声明一个公共的属性如
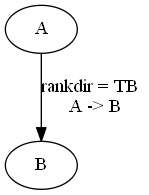
digraph action {

    rankdir = LR // 设置方向

    node [shape=box color=blue]

    edge [color=red]

    node1 // 默认节点属性

    node2 [color=lightblue] // 属于该节点的颜色属性

    node1 -> node2 // 默认边属性

    node2 -> node1 [color=green] // 属于该变的属性

}
在声明位置之后的节点都有一个 默认 的形状和颜色属性。
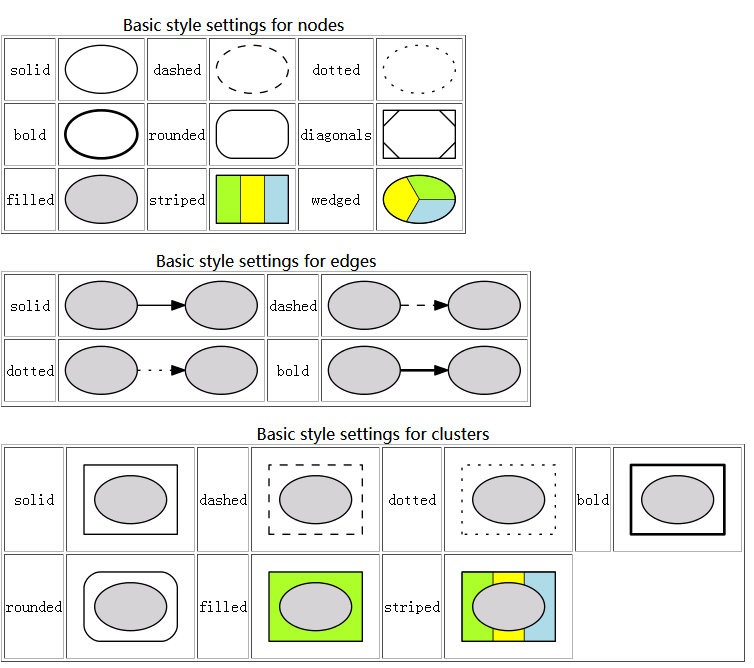
全部的属性见graphviz官网,这里列举部分常用的属性
- charset 编码,一般设置 UTF-8
- fontname 字体名称,这个在中文的情况需要设置,否则导出图片的时候会乱码,一般设置微软雅黑("Microsoft YaHei"), linux 下也是同样设置系统带的字体就好,其他字体设置见fontpath 属性
- fontcolor 字体颜色
- fontsize 字体大小,用于文本内容
- fillcolor 用于填充节点或者集群(cluster)的背景颜色。
- size 图形的最大宽度和高度
- label 图形上的文本标记
- margin 设置图形的边距
- pad 指定将绘制区域扩展到绘制图形所需的最小区域的长度(以英寸为单位)
- style 设置图形组件的样式信息。 对于聚类子图或者节点,如果style = "filled",则填充聚类框的背景
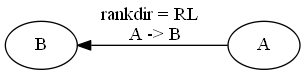
- rankdir 设置图形布局的排列方向 (全局只有一个生效). "TB", "LR", "BT", "RL", 分别对应于从上到下,从左到右,从下到上和从右到左绘制的有向图。
- ranksep 以英寸为单位提供所需的排列间隔
- ratio 设置生成图片的纵横比
节点(node)
节点的默认属性为 shape = ellipse, width = .75, height = 0.5 并且用节点标识符作为节点的显示文字。
如图一中所示,声明两个节点 node0 和 node2,node0 或 node2 就表示这个节点的节点标识符,后面紧跟的是该节点的属性列表;另一种用法为 节点标识符:节点部分:方向[属性列表] node0:body[style=filled color=lightblue], 这个为单一节点声明的方式。
节点中最基本的属性为:
- shape 形状,全部形状见graphviz官网,一些常用的图形有
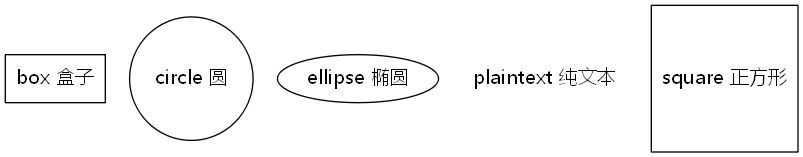
- width height, 图形的宽度和高度,如果设置了 fixedsize 为 true,则宽和高为最终的长度
- fixedsize, 如果为false,节点的大小由其文本内容所需要的最小值决定
- rank 子图中节点上的排列等级约束. 最小等级是最顶部或最左侧,最大等级是最底部或最右侧。
- same. 所有节点都位于同一等级
- min. 所有节点都位于最小等级上
- source. 所有节点都位于最小等级上,并且最小等级上的唯一节点属于某个等级 source 或 min 的子图.
- max sink. 和上类似
边 (edge)
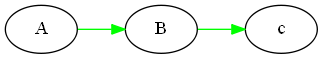
有向图中的的边用 -> 表示,无向图用 -- 表示。
可以同时连接多个节点或者子图,但是只能有一个属性列表,如下
digraph {

	rankdir = LR

	A -> B -> c[color=green]

}
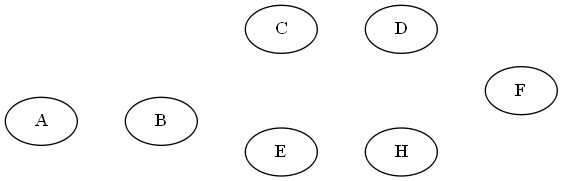
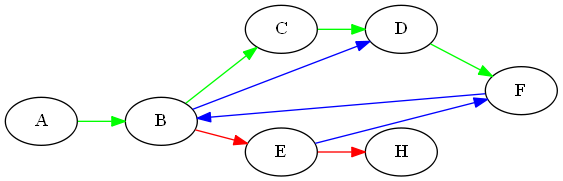
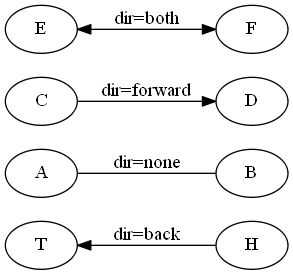
一些关于边的属性如下:
digraph {

	rankdir = LR

	splines = ortho

	A -> B -> C -> D -> F [color = green]

	E -> F -> B -> D [color = blue]

	B -> E -> H[color = red]

}
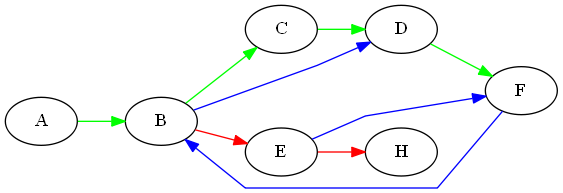
len 首选边的长度
weight 边的权重, 权重越大越接近边的长度
lhead 逻辑边缘的头部(箭头那个位置),compound 设置为 true 时,边被裁减到子图的边界处
ltail 类似 lhead
headlabel 边上靠近箭头部分的标签
taillabel 边上靠近尾部部分的标签
设置 A->B->C->D->F的权重最大,修改绿色的分支的权重为 100,使其变成主要逻辑分支。

splines 控制如何以及是否表示边缘。其值如下
- none 或者 "", 无边
- true 或者 spline, 样条线(无规则,可为直或者曲线)

- false 或者 line, 直线段
- polyline, 折线
- curved, 曲弧线,两条?
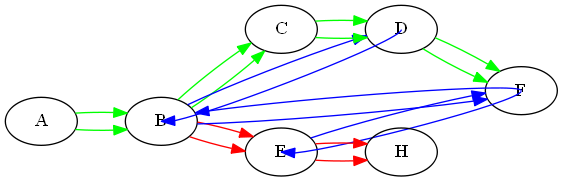
- ortho, 正直的线(横竖)
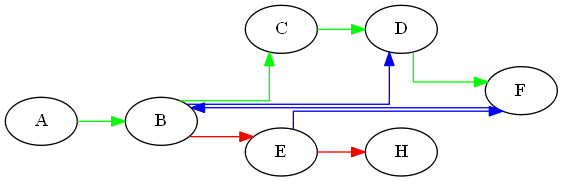
- none 或者 "", 无边
dir 设置绘制箭头的边缘类型
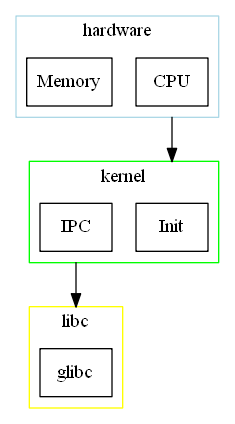
子图
subgraph 必须配合 cluster 一起使用,用法为 subgraph cluster* {}
需要设置 compound 为 true,则在群集之间留出边缘,子图的边界关系在 边 的定义中有给出,这里直接给个示例。
digraph G {

	compound = true  // 允许子图间存在边

	ranksep = 1

	node [shape = record]

	subgraph cluster_hardware {

		label = "hardware"

		color = lightblue

		CPU Memory

	}

	subgraph cluster_kernel {

		label = "kernel"

		color = green

		Init IPC

	}

	subgraph cluster_libc {

		label = "libc"

		color = yellow

		glibc

	}

	CPU -> Init [lhead = cluster_kernel ltail = cluster_hardware]

	IPC -> glibc [lhead = cluster_libc ltail = cluster_kernel]

}
示例
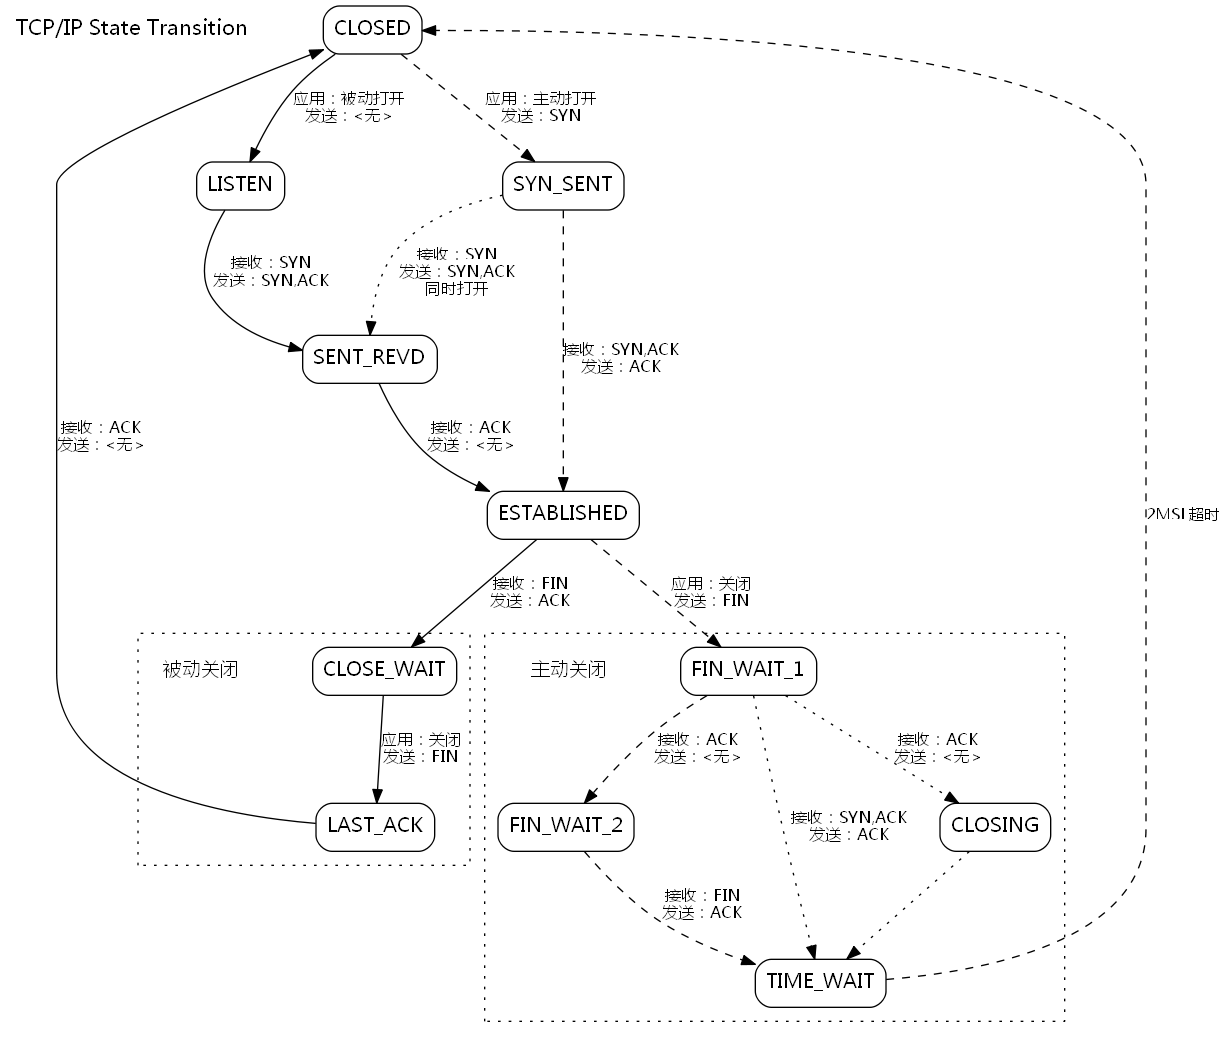
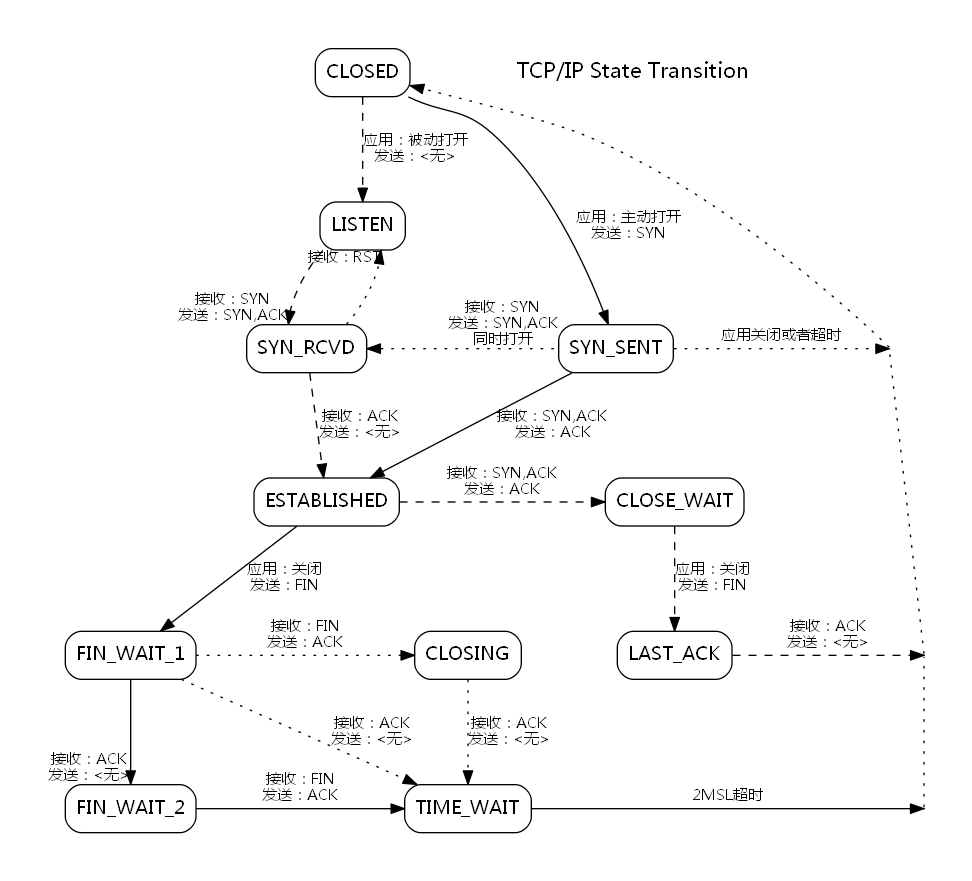
TCP IP 状态流程图
展示了两个版本,怎么把这些图形节点稍微规范的显示出来
digraph {

	compound=true

	fontsize=10

	margin="0,0"

	ranksep = .75

	nodesep = .65

	node [shape=Mrecord fontname="Inconsolata, Consolas", fontsize=12, penwidth=0.5]

	edge [fontname="Inconsolata, Consolas", fontsize=10, arrowhead=normal]

	"TCP/IP State Transition" [shape = "plaintext", fontsize = 16]

	// now start server state transition

	"CLOSED" -> "LISTEN" [style = blod, label = "应用:被动打开\n发送:<无>"];

	"LISTEN" -> "SENT_REVD" [style = blod, label = "接收:SYN\n发送:SYN,ACK"]

	"SENT_REVD" -> "ESTABLISHED" [style = blod, label = "接收:ACK\n发送:<无>", weight = 20]

	"ESTABLISHED" -> "CLOSE_WAIT" [style = blod, label = "接收:FIN\n发送:ACK", weight = 20]

	subgraph cluster_passive_close {

		style = dotted

		margin = 10

		passive_close [shape = plaintext, label = "被动关闭", fontsize = 14]

		"CLOSE_WAIT" -> "LAST_ACK" [style = blod, label = "应用:关闭\n发送:FIN", weight = 10]

	}

	"LAST_ACK" -> "CLOSED" [style = blod, label = "接收:ACK\n发送:<无>"]

	// now start client state transition

	"CLOSED" -> "SYN_SENT" [style = dashed, label = "应用:主动打开\n发送:SYN"];

	"SYN_SENT" -> "ESTABLISHED" [style = dashed, label = "接收:SYN,ACK\n发送:ACK", weight = 25]

	"SYN_SENT" -> "SENT_REVD" [style = dotted, label = "接收:SYN\n发送:SYN,ACK\n同时打开"]

	"ESTABLISHED" -> "FIN_WAIT_1" [style = dashed, label = "应用:关闭\n发送:FIN", weight = 20]

	subgraph cluster_active_close {

		style = dotted

		margin = 10

		active_open [shape = plaintext, label = "主动关闭", fontsize = 14]

		"FIN_WAIT_1" -> "FIN_WAIT_2" [style = dashed, label = "接收:ACK\n发送:<无>"]

		"FIN_WAIT_2" -> "TIME_WAIT" [style = dashed, label = "接收:FIN\n发送:ACK"]

		"FIN_WAIT_1" -> "CLOSING" [style = dotted, label = "接收:ACK\n发送:<无>"]

		"FIN_WAIT_1" -> "TIME_WAIT" [style = dotted, label = "接收:SYN,ACK\n发送:ACK"]

		"CLOSING" -> "TIME_WAIT" [style = dotted]

	}

	"TIME_WAIT" -> "CLOSED" [style = dashed, label = "2MSL超时"]

}
这是一个很挫的版本,排版乱飞了。
digraph rankdot {

	compound=true

	margin="0,0"

	ranksep = .75

	nodesep = 1

	pad = .5

	//splines = ortho

	node [shape=Mrecord, charset = "UTF-8" fontname="Microsoft YaHei", fontsize=14]

	edge [charset = "UTF-8" fontname="Microsoft YaHei", fontsize=11, arrowhead = normal]

	CLOSED -> LISTEN [style = dashed, label = "应用:被动打开\n发送:<无>", weight = 100];

	"TCP/IP State Transition" [shape = "plaintext", fontsize = 16]

	{

		rank = same

		SYN_RCVD SYN_SENT

		point_1 [shape = point, width = 0]

		SYN_SENT -> point_1 [style = dotted, label = "应用关闭或者超时"]

		// SYN_SENT -> SYN_RCVD 这个一行代码和上一行冲突了,syn_sent 会在syn_rcvd右边

		SYN_RCVD -> SYN_SENT [style = dotted, dir = back, headlabel = "接收:SYN\n发送:SYN,ACK\n同时打开"]

	}

	LISTEN -> SYN_RCVD [style = dashed, headlabel = "接收:SYN\n发送:SYN,ACK"]

	SYN_RCVD -> LISTEN [style = dotted, headlabel = "接收:RST"]

	CLOSED:es -> SYN_SENT [style = blod, label = "应用:主动打开\n发送:SYN"]

	{

		rank = same

		ESTABLISHED CLOSE_WAIT

		ESTABLISHED -> CLOSE_WAIT [style = dashed, label = "接收:SYN,ACK\n发送:ACK"]

	}

	SYN_RCVD -> ESTABLISHED [style = dashed, label = "接收:ACK\n发送:<无>", weight = 9]

	SYN_SENT -> ESTABLISHED  [style = blod, label = "接收:SYN,ACK\n发送:ACK", weight = 10]

	{

		rank = same

		FIN_WAIT_1

		CLOSING

		LAST_ACK

		point_2 [shape = point, width = 0]

		FIN_WAIT_1 -> CLOSING [style = dotted, label = "接收:FIN\n发送:ACK"]

		LAST_ACK -> point_2 [style = dashed, label = "接收:ACK\n发送:<无>"]

	}

	CLOSE_WAIT -> LAST_ACK [style = dashed, label = "应用:关闭\n发送:FIN", weight = 10]

	{

		rank = same

		FIN_WAIT_2  TIME_WAIT

		point_3 [shape = point, width = 0]

		TIME_WAIT -> point_3 [style = blod, label = "2MSL超时"]

	}

	ESTABLISHED -> FIN_WAIT_1 [style = blod, label = "应用:关闭\n发送:FIN"]

	FIN_WAIT_1 -> FIN_WAIT_2 [style = blod, headlabel = "接收:ACK\n发送:<无>", weight = 15]

	FIN_WAIT_2 -> TIME_WAIT [style = blod, label = "接收:FIN\n发送:ACK", weight = 10]

	CLOSING -> TIME_WAIT [style = dotted, label = "接收:ACK\n发送:<无>", weight = 15]

	FIN_WAIT_1 -> TIME_WAIT [style = dotted, label = "接收:ACK\n发送:<无>"]

	point_3 -> point_2 [arrowhead = none, style = dotted, weight = 10]

	point_2 -> point_1 [arrowhead = none, style = dotted]

	point_1 -> CLOSED [style = dotted]

}
这个版本看起来有内味了,最最最的主要的原因就是我使用 rank = same 属性,将一些图形固定在 同一行,一些需要横竖的直线的地方使用 weight 来调整权重,达到横竖的直接的效果,很多地方都是微调的结果。有一个很差的地方是 使用了rank限制若干图形后,就不能使用 subgraph 属性了,这样就不能在若干不同部分的节点周边画线(对比关闭的区域)了。
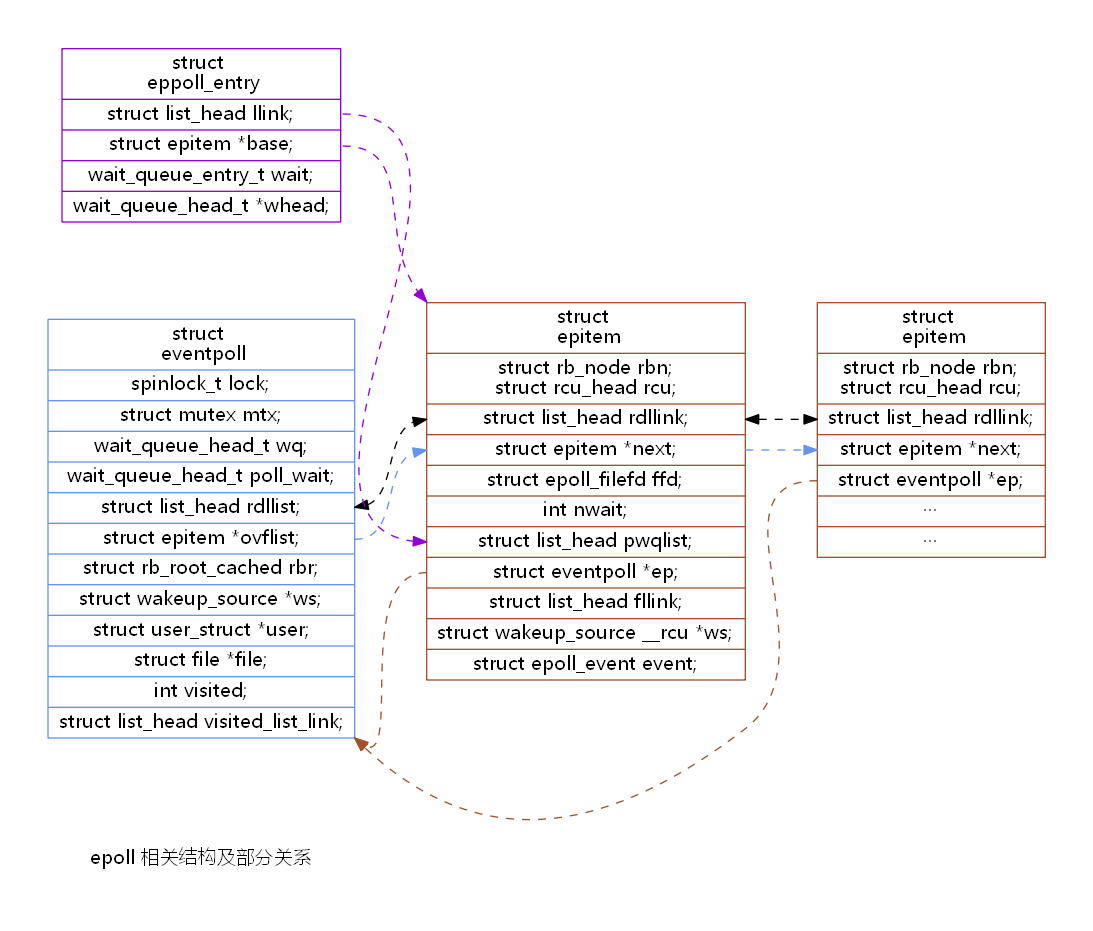
epoll 相关数据结构及关系
digraph rankdot {

	compound=true

	margin="0,0"

	ranksep = .75

	nodesep = 1

	pad = .5

	rankdir = LR

	node [shape=record, charset = "UTF-8" fontname="Microsoft YaHei", fontsize=14]

	edge [style = dashed, charset = "UTF-8" fontname="Microsoft YaHei", fontsize=11]

	epoll [shape = plaintext, label = "epoll 相关结构及部分关系"]

	eventpoll [

		color = cornflowerblue,

		label = "<eventpoll> struct \n eventpoll |

			<lock> spinlock_t lock; |

			<mutex> struct mutex mtx; |

			<wq> wait_queue_head_t wq; |

			<poll_wait> wait_queue_head_t poll_wait; |

			<rdllist> struct list_head rdllist; |

			<ovflist> struct epitem *ovflist; |

			<rbr> struct rb_root_cached rbr; |

			<ws> struct wakeup_source *ws; |

			<user> struct user_struct *user; |

			<file> struct file *file; |

			<visited> int visited; |

			<visited_list_link> struct list_head visited_list_link;"

	]

	epitem [

		color = sienna,

		label = "<epitem> struct \n epitem  |

			<rb>struct rb_node rbn;\nstruct rcu_head rcu; |

			<rdllink> struct list_head rdllink; |

			<next> struct epitem *next; |

			<ffd> struct epoll_filefd ffd; |

			<nwait> int nwait; |

			<pwqlist> struct list_head pwqlist; |

			<ep> struct eventpoll *ep; |

			<fllink> struct list_head fllink; |

			<ws> struct wakeup_source __rcu *ws; |

			<event> struct epoll_event event;"

	]

	epitem2 [

		color = sienna,

		label = "<epitem> struct \n epitem |

			<rb>struct rb_node rbn;\nstruct rcu_head rcu; |

			<rdllink> struct list_head rdllink; |

			<next> struct epitem *next; |

			<ep> struct eventpoll *ep; |

			 ··· |

			 ··· "

	]

	eppoll_entry [

		color = darkviolet,

		label = "<entry> struct \n eppoll_entry |

			<llink> struct list_head llink; |

			<base> struct epitem *base; |

			<wait> wait_queue_entry_t wait; |

			<whead> wait_queue_head_t *whead;"

	]

	epitem:ep -> eventpoll:se [color = sienna]

	epitem2:ep -> eventpoll:se [color = sienna]

	eventpoll:ovflist -> epitem:next -> epitem2:next [color = cornflowerblue]

	eventpoll:rdllist -> epitem:rdllink -> epitem2:rdllink [dir = both]

	eppoll_entry:llink -> epitem:pwqlist [color = darkviolet]

	eppoll_entry:base -> epitem:nw  [color = darkviolet]

}
遗留问题
- 在以上TCP/IP 状态变迁图中,尝试增加主动关闭方的区域边框
- 尝试增加 TCP/IP 的时序图
使用 VSCode 进行预览生成
- 在官网下载graphviz安装包
- 安装 vscode 插件
Graphviz Preview - 在 settings.json 中添加
"graphvizPreview.dotPath": "graphviz_path\graphviz-2.38\\release\\bin\\dot.exe", graphviz_path 为所在路径,这些修改一下既可 - 新建一个 dot 文件,右上角就会有预览生成的按钮了
12/05 更新,用了一圈发现并没有那么好用,自动排版是优势,但有的时候也是劣势,需要固定位置的作图时还是手动控制比较好一些,ProcessOn 用了几次觉得很不错,推荐!
参考
Graphviz 画图的一些总结的更多相关文章
- 使用graphviz画图
安装: 要使用Graphviz,先要在系统上安装Graphviz. 在Ubuntu上安装可以使用命令: sudo apt-get install graphviz 在其他系统安装的方法可以查看Grap ...
- graphviz画图与中文乱码等问题总结
最近想写一些文档,画一些程序的逻辑图,用了vision,markdown等软件感觉不怎么好用,于是找到graphviz,这款强大的软件.下面介绍一些入门,还有自己在用的过程中遇到的问题 1.中文乱码的 ...
- python下graphviz安装
参考链接:https://blog.csdn.net/u013250416/article/details/72790754 1.安装Graphviz 在graphviz的官网(网址:http://w ...
- Anaconda安装Graphviz, mac下Graphviz安装, pcharm中调用pycharm, Graphviz典型例子
mac下的Graphviz安装及使用 2017年10月13日 13:30:07 阅读数:7495 一.安装 Graphviz http://www.graphviz.org/ mac用户建议直接用ho ...
- 图、流程图、ER图怎么画及常见画图工具(流程图文章汇总)
流程图基本符号 首先要记住图中1.2.3.4.6这几种符号. 图片摘自网络 流程图基本概念及入门 简易流程图 流程图简介(基本符号与绘制工具) 你可能学了假流程图,三步教会你绘制大厂流程图 使用流程图 ...
- 59th python下graphviz安装 砖
原文 摘录 感谢分享: https://www.cnblogs.com/liusx0303/p/9155305.html 参考链接:https://blog.csdn.net/u01325041 ...
- Graphviz - Graph Visualization Software 开源可视化绘图工具(visio 类)
http://www.graphviz.org/Download_windows.php Welcome to Graphviz Available translations: Romanian, ...
- Awesome CLI
请移步https://github.com/zhuxiaoxi/awesome-online-tools 欢迎一同维护这个列表 jq JSON工具 shellcheck 更好用的Shell语法检查 c ...
- dot 语法全介绍
0. 保存 保存为 pdf:dot -Tpdf iris.dot -o iris.pdf 1. 基本 (1)无向图.有向图.子图 graph G {} // 无向图 digraph G {} // 有 ...
随机推荐
- 代码审计-MetInfo CMS任意文件读取漏洞
0x01 代码分析 发现在app\system\include\module\old_thumb.class.php疑似有任意文件读取漏洞 public function doshow(){ glob ...
- MFC::Visual studio ? 对应VC6-14
VC6VC7: Visual studio.netVC7.1: Visual studio 2003VC8: Visual studio 2005VC9: Visual studio 2008VC10 ...
- std::lock_guard 与 std::unique_lock
std::lock_guard 与 std::unique_lock 对 mutex 进行自动加解锁. mutex m; void fun() { unique_lock<mutex> m ...
- Smali语言基础语法
1.Smali语言基础语法-数据类型与描述符 smali中有两类数据类型:基本类型和引用类型.引用类型是指数组和对象,其它都是基础类型. 基本类型以及每种类型的描述符: Java类型 类型描述符 说明 ...
- [.Net Core 3.0从入门到精通]1.笔记简介及.Net Core3.0介绍
文章目的:.Net Core 3.0学习笔记整理与分享. 面向人群:有一定基础的C#开发人员或学习人员(C#语法一定要掌握). 笔者水平:中级C#开发攻城狮(水平有限,写的不对的地方希望大家指正). ...
- Apollo学习笔记(一):canbus模块与车辆底盘之间的CAN数据传输过程
Apollo学习笔记(一):canbus模块与车辆底盘之间的CAN数据传输过程 博主现在从车载自组网信道分配和多跳路由转向了自动驾驶,没啥经验,想快些做出来个Demo还是得站在巨人的肩膀上才行,我选择 ...
- (一)初识EasyTouch
Easy Touch是一个手指触控(可以鼠标)的插件,可以非常方便的实现各种功能,使用插件第一步是添加Easy Touch组件,可以右键添加也可以在一个空的游戏物体上添加Easy Touch脚本(非事 ...
- 如何在python文件中测试sql语句
在manage.py的同级目录下新建一个run.py import os if __name__ == '__main__': #加载Django项目的配置信息 os.environ.setdefau ...
- style.html
<!DOCTYPE html> <html> <head> <meta charset="UTF-8"> <title> ...
- vue-cli安装方法
vue-cli:vue文件,css文件,less文件,图片--->htmles6代码--->es5代码 template标签里面,只能有1个跟元素 script标签里面导入组件import ...