Nuxt3.0中使用EChart可视化图表📊
在Nuxt3.0项目中用到了可视化图表,于是我用了EChart可视化图表库。但是在官网我没有找到针对在Nuxt3.0中使用EChart的方法,于是在这里记录我的引入EChart并简单使用的步骤。需要声明的是,本文只针对在Nuxt3.0项目中使用EChart.js库的可视化图表进行讲解,不针对EChart图表的详细配置进行讲解,如需了解EChart的可视化图表详细配置参数,请查看官网手册Documentation - Apache ECharts
第一步:下载安装vue-echarts和echarts
安装vue-echarts包:npm i vue-echarts
安装echarts包:npm i echarts
tips:如果下载安装报错,可替换尝试使用:npm i vue-echarts --force和npm i echarts --force
第二步:配置项目nuxt-config.ts文件
nuxt-config.ts文件
// https://nuxt.com/docs/api/configuration/nuxt-config

export default defineNuxtConfig({

    build: {

        transpile: [/echarts/],

    }

})
第三步:新建plugins目录,并在目录下新建chart.js文件

chart.js文件:
import { use } from 'echarts/core';

// 手动导入ECharts模块以减小包的大小

import { CanvasRenderer } from 'echarts/renderers';

import { BarChart } from 'echarts/charts';

import { GridComponent, TooltipComponent } from 'echarts/components';

export default defineNuxtPlugin(() => {

    use([CanvasRenderer, BarChart, GridComponent, TooltipComponent]);

});
第四步:在Test.vue页面中使用
Test.vue页面文件
<template>

    <div>

        <client-only>

            <v-chart class="chart" :option="option" />

        </client-only>

    </div>

</template>

<script setup lang="ts">

import { use } from 'echarts/core';

import { CanvasRenderer } from 'echarts/renderers';

import { LabelLayout } from 'echarts/features';

import { PieChart } from 'echarts/charts';

import {

    TitleComponent,

    TooltipComponent,

    LegendComponent,

} from 'echarts/components';

import VChart, { THEME_KEY } from 'vue-echarts';

import { ref, defineComponent } from 'vue';

use([

    CanvasRenderer,

    PieChart,

    TitleComponent,

    TooltipComponent,

    LegendComponent,

    LabelLayout

]);

const option = ref({

    title: {

        text: '测试图表',

        subtext: 'nuxt3.0中的EChart初探',

        left: 'center',

        textStyle: {  //主标题样式

            color: '#DC143C'

        },

        subtextStyle: {   //副标题样式

            color: '#008000'

        }

    },

    tooltip: {

        trigger: 'item'

    },

    legend: {

        orient: 'horizontal',  //图例方向

        bottom: 'bottom',  //图例距离底部位置

        textStyle: { color: "#FFFDFE" }, //图例字体颜色

    },

    series: [

        {

            name: '技术量',

            type: 'pie',

            radius: '50%',

            label: {

                color: '#FFA500'

            },

            data: [

                { value: 1048, name: '前端技术' },

                { value: 735, name: '后端技术' },

                { value: 580, name: '服务器技术' },

                { value: 484, name: '运维技术' },

                { value: 300, name: '测试技术' }

            ]

        }

    ]

});

</script>

<style scoped>

.chart {

    height: 800px;

}

</style>
至此,我们在Nuxt3.0项目中使用EChart图表的需求就实现啦~
tips:我使用的是Vue3.0的 setup语法糖的写法,如果没有用语法糖写法的小伙伴可以参考如下代码,其中唯一的区别就是在Test.vue页面文件中的用法不同:
<template>

  <div>

    <client-only>

      <v-chart class="chart" :option="option" />

    </client-only>

  </div>

</template>

<script>  //注意这里没有使用setup语法糖

import { use } from 'echarts/core';

import { CanvasRenderer } from 'echarts/renderers';

import { PieChart } from 'echarts/charts';

import {

  TitleComponent,

  TooltipComponent,

  LegendComponent,

} from 'echarts/components';

import VChart, { THEME_KEY } from 'vue-echarts';

import { ref, defineComponent } from 'vue';

use([

  CanvasRenderer,

  PieChart,

  TitleComponent,

  TooltipComponent,

  LegendComponent,

]);

export default defineComponent({

  name: 'HelloWorld',

  components: {

    VChart,

  },

  provide: {

    [THEME_KEY]: 'dark',

  },

  setup() {

    const option = ref({

      title: {

        text: '测试图表',

        subtext: 'nuxt3.0中的EChart初探',

        left: 'center',

        textStyle: {

          //主标题样式

          color: '#DC143C',

        },

        subtextStyle: {

          //副标题样式

          color: '#008000',

        },

      },

      tooltip: {

        trigger: 'item',

      },

      legend: {

        orient: 'horizontal', //图例方向

        bottom: 'bottom', //图例距离底部位置

        textStyle: { color: '#FFFDFE' }, //图例字体颜色

      },

      series: [

        {

          name: '技术量',

          type: 'pie',

          radius: '50%',

          label: {

            color: '#FFA500',

          },

          data: [

            { value: 1048, name: '前端技术' },

            { value: 735, name: '后端技术' },

            { value: 580, name: '服务器技术' },

            { value: 484, name: '运维技术' },

            { value: 300, name: '测试技术' },

          ],

        },

      ],

    });

    return { option };

  },

});

</script>

<style scoped>

.chart {

  height: 800px;

}

</style>
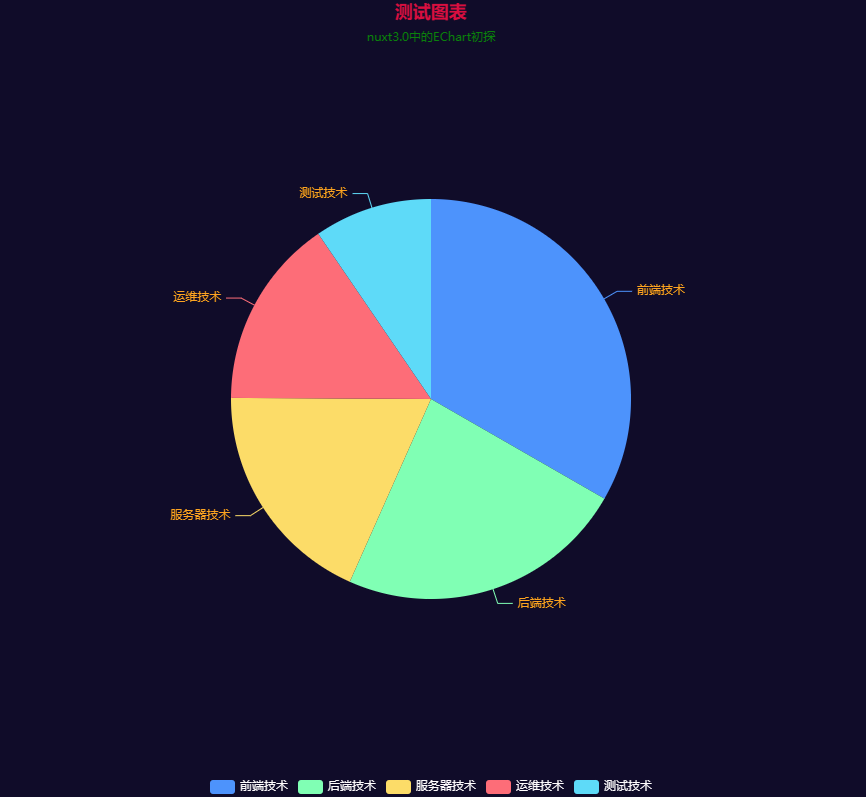
效果图:
Nuxt3.0中使用EChart可视化图表📊的更多相关文章
- vue3.0+echart可视化
vue3.0 + echart可视化 案例1: 案例代码 <template> <div ref="test" style="width:800px;h ...
- 解决echart在IE中使用时,在div中加入postion后图表不显示问题
<!-- 为ECharts准备一个具备大小(宽高)的Dom --> <div id="main" style="height:400px;width:1 ...
- JFreeChart与AJAX+JSON+ECharts两种处理方式生成热词统计可视化图表
本篇的思想:对HDFS获取的数据进行两种不同的可视化图表处理方式.第一种JFreeChar可视化处理生成图片文件查看.第二种AJAX+JSON+ECharts实现可视化图表,并呈现于浏览器上. 对 ...
- Webstorm+Webpack+echarts构建个性化定制的数据可视化图表&&两个echarts详细教程(柱状图,南丁格尔图)
Webstorm+Webpack+echarts ECharts 特性介绍 ECharts,一个纯 Javascript 的图表库,可以流畅的运行在 PC 和移动设备上,兼容当前绝大部分浏览器(I ...
- Webpack 2 视频教程 018 - 使用可视化图表进行统计分析打包过程
原文发表于我的技术博客 这是我免费发布的高质量超清「Webpack 2 视频教程」. Webpack 作为目前前端开发必备的框架,Webpack 发布了 2.0 版本,此视频就是基于 2.0 的版本讲 ...
- vue可视化图表 基于Echarts封装好的v-charts简介
**vue可视化图表 基于Echarts封装好的v-charts** 近期公司又一个新的需求,要做一个订单和销售额统计的项目,需要用到可视化图表来更直观的展示数据.首先我想到的是Echarts,众所周 ...
- vue-cli+v-charts实现移动端可视化图表
v-charts是饿了么团队开源的一款基于Vue和Echarts的图表工具,在使用 echarts 生成图表时,经常需要做繁琐的数据类型转化.修改复杂的配置项,v-charts 的出现正是为了解决这个 ...
- 可视化图表库--goJS
GoJS是Northwoods Software的产品.Northwoods Software创立于1995年,专注于交互图控件和类库.旗下四款产品: GoJS:用于在HTML上创建交互图的纯java ...
- Python 数据分析中常用的可视化工具
Python 数据分析中常用的可视化工具 1 Matplotlib 用于创建出版质量图表的绘图工具库,目的是为 Python 构建一个 Matlab 式的绘图接口. 1.1 安装 Anaconada ...
- ECharts-基于Canvas,纯Javascript图表库,提供直观,生动,可交互,可个性化定制的数据可视化图表
ECharts http://ecomfe.github.com/echarts 基于Canvas,纯Javascript图表库,提供直观,生动,可交互,可个性化定制的数据可视化图表.创新的拖拽重计算 ...
随机推荐
- fiddler动态调试js
背景 昨天获取到的网易云音乐站点的请求内容居然是加密的, 就需要动态的调试js找出params很secSeky未加密之前的内容. 调试方法 调试之前需要在目标浏览器上部署上fiddler的根证 ...
- 转帖:GitBook 从懵逼到入门
是什么? 在我认识 GitBook 之前,我已经在使用 Git 了,毋容置疑,Git 是目前世界上最先进的分布式版本控制系统. 我认为 Git 不仅是程序员管理代码的工具,它的分布式协作方式同样适 ...
- 两步解决macbook电池不充电
问题描述: 1.电源适配器是冷的,判断并没有充电,更换拔插笔记本的不同TypeC插口问题依然.(怀疑适配器坏了,但心想Apple质量一个适配器不至于那么不抗用) 2.偶尔能开起来机,则显示电源3%,瞬 ...
- 微信小程序中如何上传和下载文件
.wxml <button bindtap="chooseFile">选择文件</button> <view>请输入下载链接</view& ...
- zip文件自动打包
简单的文件打包 首先是问题 我们有一个文件的文件过大,我需要删除或者压缩,当然我们就是选择压缩 如果是单个我们可以直接使用压缩功能 但是多个呢? 首先获取当前目录下的文件,使用 a=`ls` | te ...
- Shiro权限管理框架-@RequiresPermissions 注解 使用问题记录
背景: 需要在springboot项目里面用到shiro的权限管理,Shiro访问控制流程:先shiro认证(登录时调用) 然后 shiro授权,但是项目里面登录的功能用的公司统一的系统,所以需要&q ...
- ICSFUZZ:操纵I/O、二进制代码重用以及插桩,来Fuzzing工业控制应用程序
本文系原创,转载请说明出处 Please Subscribe Wechat Official Account:信安科研人,获取更多的原创安全资讯 源码:GitHub - momalab/ICSFu ...
- .Net7 CLR的调用函数和编译函数
前言 .Net运行模型,无非就两个过程.一个是调用入口函数,另外一个就是编译入口函数.前者主调用,后者主编译. 概括 一:入口函数:RunMainInternal 所有的.Net程序,包括控制台,We ...
- 第四朵“云”!全托管的时序数据云平台 TDengine Cloud 正式支持阿里云
3 月 13 日,全托管的时序数据处理云服务平台 TDengine Cloud 正式支持阿里云,这是继 Microsoft Azure.AWS.Google Cloud 后 TDengine Clou ...
- CAS 单点登录系统
一.什么是单点登录 单点登录(Sign Sion On),简称为 SSO,是目前比较流行的企业业务整合的解决方案之一.SSO 的定义是在多个应用系统中,用户只需要登录一次就可以访问所有相互信任的应用系 ...