prometheus(5)之consul服务自动发现及pushgetway
pushgetway(push上传metric数据)
Pushgateway简介
Pushgateway是prometheus的一个组件,prometheus server默认是通过exporter主动获取数据(默认采取pull拉取数据),pushgateway则是通过被动方式推送数据到prometheus server,用户可以写一些自定义的监控脚本把需要监控的数据发送给pushgateway, 然后pushgateway再把数据发送给Prometheus server
Pushgateway优点:
Prometheus 默认采用定时pull 模式拉取targets数据,但是如果不在一个子网或者防火墙,prometheus就拉取不到targets数据,所以可以采用各个target往pushgateway上push数据,然后prometheus去pushgateway上定时pull数据
在监控业务数据的时候,需要将不同数据汇总, 汇总之后的数据可以由pushgateway统一收集,然后由 Prometheus 统一拉取。
pushgateway缺点:
Prometheus拉取状态只针对 pushgateway, 不能对每个节点都有效;
Pushgateway出现问题,整个采集到的数据都会出现问题
监控下线,prometheus还会拉取到旧的监控数据,需要手动清理 pushgateway不要的数据。
安装pushgateway
[root@xianchaonode1 ~]# docker load -i pushgateway.tar.gz

[root@xianchaonode1 ~]# docker run -d --name pushgateway -p 9091:9091 prom/pushgateway

在浏览器访问192.168.40.181:9091出现如下ui界面

可以使用k8s编排
修改prometheus配置文件
修改prometheus-alertmanager-cfg.yaml文件,在k8s-master节点操作

添加如下job

- job_name: 'pushgateway'

      scrape_interval: 5s

      static_configs:

      - targets: ['192.168.40.181:9091']

  honor_labels: true

kubectl apply -f prometheus-alertmanager-cfg.yaml

kubectl delete -f prometheus-alertmanager-deploy.yaml

kubectl apply -f prometheus-alertmanager-deploy.yaml
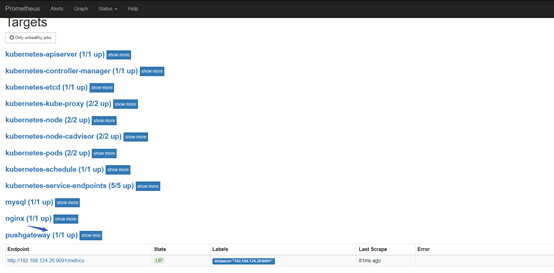
在prometheus的targets列表可以看到pushgateway
推送指定的数据格式到pushgateway
向 {job="test_job"} 添加单条数据:

echo " metric 3.6" | curl --data-binary @- http://192.168.40.181:9091/metrics/job/test_job

 注:--data-binary 表示发送二进制数据,注意:它是使用POST方式发送的!

添加复杂数据

cat <<EOF | curl --data-binary @- http://192.168.40.181:9091/metrics/job/test_job/instance/test_instance

#TYPE node_memory_usage gauge

node_memory_usage 36

# TYPE memory_total gauge

node_memory_total 36000

EOF

删除某个组下某个实例的所有数据

curl -X DELETE http://192.168.40.181:9091/metrics/job/test_job/instance/test_instance

删除某个组下的所有数据:

curl -X DELETE http://192.168.40.181:9091/metrics/job/test_job
使用脚本上传数据
把数据上报到pushgateway

在被监控服务所在的机器配置数据上报,想要把192.168.40.181这个机器的内存数据上报到pushgateway,下面步骤需要在192.168.40.181操作

cat push.sh

node_memory_usages=$(free -m | grep Mem | awk '{print $3/$2*100}')

job_name="memory"

instance_name="192.168.40.181"

cat <<EOF | curl --data-binary @- http://192.168.40.181:9091/metrics/job/$job_name/instance/$instance_name

#TYPE node_memory_usages  gauge

node_memory_usages $node_memory_usages

EOF

sh push.sh
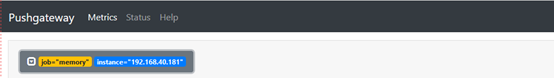
打开pushgateway web ui界面,可看到如下:
打开prometheus ui界面,可看到如下node_memory_usages的metrics指标
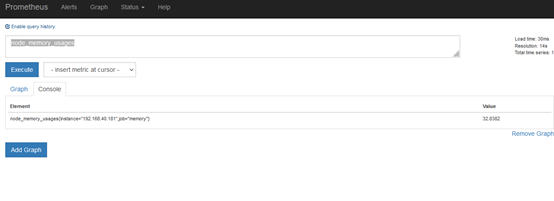
###注意:从上面配置可以看到,我们上传到pushgateway中的数据有job也有instance,而prometheus配置pushgateway这个job_name中也有job和instance,这个job和instance是指pushgateway实例本身,添加 honor_labels: true 参数, 可以避免promethues的targets列表中的job_name是pushgateway的 job 、instance 和上报到pushgateway数据的job和instance冲突。
基于consul服务自动发现
简介:
Consul是分布式k/v数据库,是一个服务注册组件,其他服务都可以注册到consul上,prometheus基于consul的服务发现流程如下:
(1)在consul注册服务或注销服务(监控targets)
(2)Prometheus一直监视consul服务,当发现consul中符合要求的服务有新变化就会更新Prometheus监控对象
consul简介
Consul是一个分布式的,高可用的服务注册系统,由server端和client端组成,每个server和client都是consul的一个节点,consul客户端不保存数据,客户端将接收到的请求转发给响应的Server端。Server之间通过局域网或广域网通信实现数据一致性
部署consul集群
在master1、master2、node1三个节点部署consul

master1是consul的server,master2是consul的client,node1是consul的client

1.下载consul二进制包,在各个节点操作

mkdir /opt/consul/data -p  && cd /opt/consul

wget https://releases.hashicorp.com/consul/1.7.1/consul_1.7.1_linux_amd64.zip

unzip consul_1.7.1_linux_amd64.zip

注:在https://releases.hashicorp.com/consul处可下载各个版本的consul,1.7.1是最新版本

2.启动consul

在master1上:

cd /opt/consul

nohup ./consul agent -server -bootstrap  -bind=192.168.124.16   -client=192.168.124.16 -data-dir=data -ui -node=192.168.124.16 &

这样就启动了master1上的consul

在master2上:

cd /opt/consul

nohup ./consul agent -bind=192.168.124.26 -client=192.168.124.26 -data-dir=data -node=192.168124.26 -join=192.168.124.16 &

在node1上:

cd /opt/consul

nohup ./consul agent -bind=192.168.124.56 -client=192.168.124.56 -data-dir=data -node=192.168.124.56 -join=192.168.124.16 &
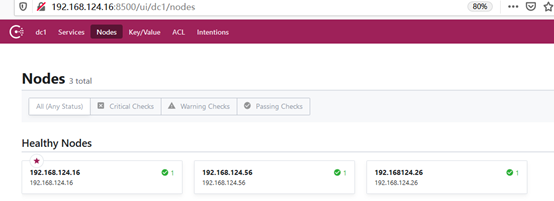
各个节点都启动完之后
在浏览器访问http://192.168.124.16:8500/
可看到consul的管理界面
服务注册到consul
使用HTTP API 方式注册node-exporter服务注册到Consul,在master1上执行
curl -X PUT -d '{"id": "node-exporter","name": "node-exporter","address": "192.168.124.16","port":9100,"tags": ["node-exporter"],"checks": [{"http": "http://192.168.124.16:9100/","interval": "5s"}]}' http://192.168.124.16:8500/v1/agent/service/register
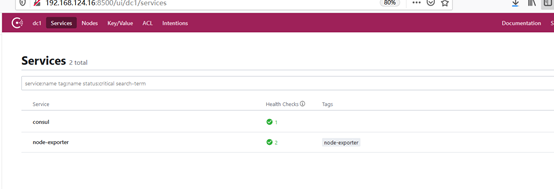
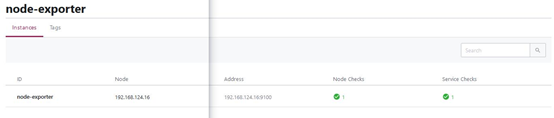
看到如下显示health checks都是正常,说明node-exporter已经成功注册到consul中了
http://192.168.124.16:8500/ui/dc1/services
http://192.168.124.16:8500/ui/dc1/services/node-exporter
这个步骤是移除,先不操作,把consul中注册的服务移除:
curl --request PUT http://192.168.124.16:8500/v1/agent/service/deregister/192.168.124.16
修改prometheus配置文件,变成基于consul的服务发现
在master1上操作
cd /data/prometheus
cat prometheus.yaml
scrape_configs:
- job_name: consul
honor_labels: true
metrics_path: /metrics
scheme: http
consul_sd_configs:
- server: 192.168.124.16:8500
services: []
relabel_configs:
- source_labels: ['__meta_consul_tags']
target_label: 'product'
- source_labels: ['__meta_consul_dc']
target_label: 'idc'
- source_labels: ['__meta_consul_service']
regex: "consul" #匹配为"consul" 的service
action: drop # 执行的动作 static_configs: 配置数据源
consul_sd_configs: 基于consul服务发现的配置
rebel_configs:重新标记
services: [] :这个表示匹配consul中所有的service
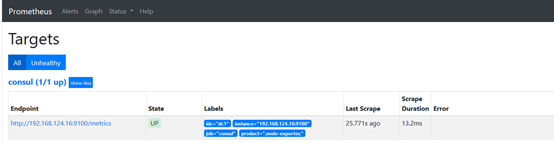
docker restart prometheus
在prometheus web ui界面查看
prometheus配置consul服务发现的标签说明
- source_labels: ['__meta_consul_tags']

      target_label: 'product'

    - source_labels: ['__meta_consul_dc']

      target_label: 'idc'

    - source_labels: ['__meta_consul_service']

      regex: "consul"  #匹配为"consul" 的service

      action: drop       # 执行的动作

参数解释如下:

__meta_consul_tags:标记分隔符连接的目标的标记列表

__meta_consul_dc:目标的数据中心名称

__meta_consul_service:目标所属服务的名称

job':目标服务器的job

__meta_consul_service_port:目标的服务端口
prometheus(5)之consul服务自动发现及pushgetway的更多相关文章
- 1.利用consul实现k8s服务自动发现
标题 : 1.利用consul实现k8s服务自动发现 目录 : 微服务架构设计 序号 : 1 ] } } ] } } - consul自身支持ACL,但目前,Helm图表不支持其中一些功能,需要额 ...
- marathon的高可用服务自动发现和负载均衡
上一篇我们说谈了docker+zookeeper+mesos+marathon集群,本篇我们来谈谈marathon的集群和自动发现服务. marathon的服务自动发现和负载均衡有两种,1是mesos ...
- ASP.NET Core gRPC 使用 Consul 服务注册发现
一. 前言 gRPC 在当前最常见的应用就是在微服务场景中,所以不可避免的会有服务注册与发现问题,我们使用gRPC实现的服务可以使用 Consul 或者 etcd 作为服务注册与发现中心,本文主要介绍 ...
- Kubernetes 服务自动发现CoreDNS
前言 Service服务,是一个概念,逻辑通过selector标签代理指定后端pod.众所周知,pod生命周期短,状态不稳定,pod错误异常后新生成的Pod IP会发生变化,之前Pod的访问方式均不可 ...
- dubbo与zk注册中心如何对接,如何做到服务自动发现
先看下consumer端发起调用时的链路流程: +---------------------------+ +---------------------------+ +--------------- ...
- Prometheus 通过 consul 实现自动服务发现
1.Consul 介绍 Consul 是基于 GO 语言开发的开源工具,主要面向分布式,服务化的系统提供服务注册.服务发现和配置管理的功能.Consul 提供服务注册/发现.健康检查.Key/Valu ...
- Prometheus基于consul自动发现监控对象 https://www.iloxp.com/archive/11/
Prometheus 监控目标为什么要自动发现 频繁对Prometheus配置文件进行修改,无疑给运维人员带来很大的负担,还有可能直接变成一个“配置小王子”,即使是配置小王子也会存在人为失误的情况 ...
- Prometheus 自动发现
目录 简介 环境说明 静态配置 重新加载配置文件 基于文件发现配置 重新加载配置文件 添加主机测试 基于DNS的A记录 修改配置文件 重新加载配置文件 基于DNS的SRV记录自动发现 修改配置文件 重 ...
- spring-cloud-consul 服务注册发现与配置
下面是 Spring Cloud 支持的服务发现软件以及特性对比(Eureka 已停止更新,取而代之的是 Consul): Feature euerka Consul zookeeper etcd 服 ...
随机推荐
- 使用 FIO 对 Kubernetes 持久卷进行 Benchmark:读/写(IOPS)、带宽(MB/s)和延迟
工具 Dbench https://github.com/leeliu/dbench 用法 编辑 dbench.yaml 文件中的 storageClassName 以匹配你自己的 Storage C ...
- appium+python自动化:获取元素属性get_attribute
使用get_attribute()获取元素属性,括号里应该填写什么? 查看appium源码 如果是获取resource-id,填写resourceId self.driver.find_element ...
- setTimeout 与setInterval的区别
setTimeout(code,millisec) 方法用于在指定的毫秒数后调用函数或计算表达式 setInterval(code,millisec) 方法可按照指定的周期(以毫秒计)来调用函数或计算 ...
- MyBatis实现批量添加
在进行后端的操作时,批量添加总是少不了,话不多说,下面贴上代码 Mybatis代码: <insert id="batchInsert" parameterType=" ...
- Vue插槽slot理解与初体验 ~
一.插槽的理解 1.官网介绍 Vue 实现了一套内容分发的 API,将 <slot> 元素作为承载分发内容的出口. 2.为什么使用插槽 Vue 中有一个重要的概念-组件,可以在开发中将子组 ...
- The art of multipropcessor programming 读书笔记-硬件基础1
本系列是 The art of multipropcessor programming 的读书笔记,在原版图书的基础上,结合 OpenJDK 11 以上的版本的代码进行理解和实现.并根据个人的查资料以 ...
- 【数据结构与算法】二叉树的 Morris 遍历(前序、中序、后序)
前置说明 不了解二叉树非递归遍历的可以看我之前的文章[数据结构与算法]二叉树模板及例题 Morris 遍历 概述 Morris 遍历是一种遍历二叉树的方式,并且时间复杂度O(N),额外空间复杂度O(1 ...
- 无法解析的外部符号"void_cdecl caffe::caffe_gpu_dot<double>(int,double........)"
将源码中的.cu文件添加到项目中即可,即使创建的就是NVIDIA的项目,也需要把这些个.cu文件添加进来
- 倒计时 | 7.24 阿里云 Serverless Developer Meetup 杭州站报名火热进行中!
本周六阿里云 Serverless Developer Meetup 即将亮相杭州 时间:7.24 本周六 13:30 - 17:30 地点:杭州市良睦路 999 号乐佳国际 1-3-7 特洛伊星 ...
- 如何做好 NodeJS 框架选型?
作为一个有一定工作经验的工程师,工作中经常会遇到技术选型的问题.比如当我们在工作中需要使用到 NodeJS 时,第一个要解决的问题就是如何选择一个合适的框架. 不同的框架有不同的特点,如果我们仅仅从框 ...