JMH java基准测试
Measure, don’t guess!
JMH适用场景
JMH只适合细粒度的方法测试
原理
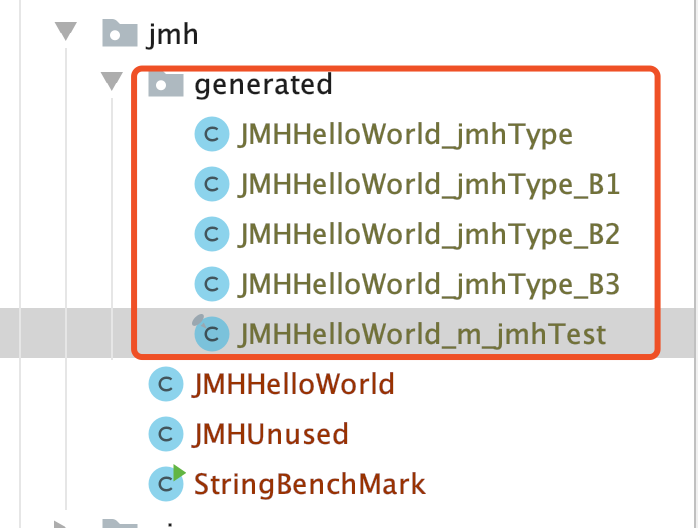
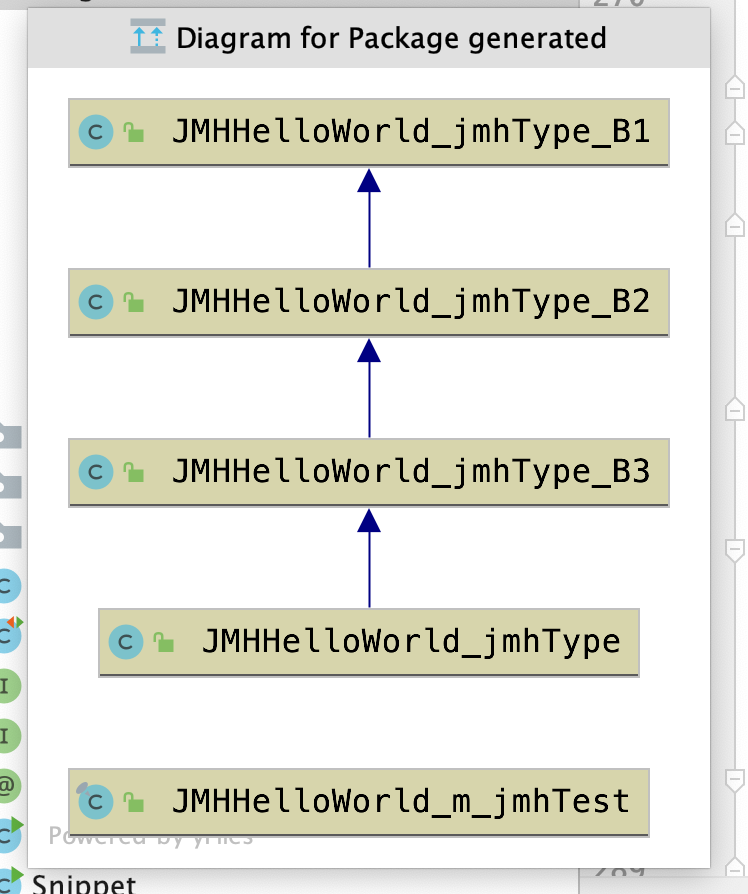
编译时会生成一些测试代码,一般都会继承你的类
maven依赖
    <dependencies>

        <dependency>

            <groupId>org.openjdk.jmh</groupId>

            <artifactId>jmh-core</artifactId>

            <version>${jmh.version}</version>

        </dependency>

        <dependency>

            <groupId>org.openjdk.jmh</groupId>

            <artifactId>jmh-generator-annprocess</artifactId>

            <version>${jmh.version}</version>

            <scope>provided</scope>

        </dependency>

    </dependencies>

    <properties>

        <project.build.sourceEncoding>UTF-8</project.build.sourceEncoding>

        <jmh.version>1.0</jmh.version>

        <javac.target>1.6</javac.target>

        <uberjar.name>benchmarks</uberjar.name>

    </properties>
命令行方式:
生成测试项目
mvn archetype:generate \

          -DinteractiveMode=false \

          -DarchetypeGroupId=org.openjdk.jmh \

          -DarchetypeArtifactId=jmh-java-benchmark-archetype \

          -DgroupId=org.sample \

          -DartifactId=test \

          -Dversion=1.0
打包
$ cd test/

$ mvn clean install
执行,
java -jar target/benchmarks.jar
java -jar target/benchmarks.jar -h //查看帮助信息
插件方式
插件会影响执行效果,但最多不会超过 2.2%
A brief research shows that benchmark results are affected, but not that much. The whole research is described in Research results.
Long story short, the maximum means difference observed was 2.2%.
main函数
package org.openjdk.jmh.samples;

import org.openjdk.jmh.annotations.Benchmark;

import org.openjdk.jmh.runner.Runner;

import org.openjdk.jmh.runner.RunnerException;

import org.openjdk.jmh.runner.options.Options;

import org.openjdk.jmh.runner.options.OptionsBuilder;

public class JMHSample_01_HelloWorld {

    /*

     * This is our first benchmark method.

     *

     * JMH works as follows: users annotate the methods with @Benchmark, and

     * then JMH produces the generated code to run this particular benchmark as

     * reliably as possible. In general one might think about @Benchmark methods

     * as the benchmark "payload", the things we want to measure. The

     * surrounding infrastructure is provided by the harness itself.

     *

     * Read the Javadoc for @Benchmark annotation for complete semantics and

     * restrictions. At this point we only note that the methods names are

     * non-essential, and it only matters that the methods are marked with

     * @Benchmark. You can have multiple benchmark methods within the same

     * class.

     *

     * Note: if the benchmark method never finishes, then JMH run never finishes

     * as well. If you throw an exception from the method body the JMH run ends

     * abruptly for this benchmark and JMH will run the next benchmark down the

     * list.

     *

     * Although this benchmark measures "nothing" it is a good showcase for the

     * overheads the infrastructure bear on the code you measure in the method.

     * There are no magical infrastructures which incur no overhead, and it is

     * important to know what are the infra overheads you are dealing with. You

     * might find this thought unfolded in future examples by having the

     * "baseline" measurements to compare against.

     */

    @Benchmark

    public void wellHelloThere() {

        // this method was intentionally left blank.

    }

    /*

     * ============================== HOW TO RUN THIS TEST: ====================================

     *

     * You are expected to see the run with large number of iterations, and

     * very large throughput numbers. You can see that as the estimate of the

     * harness overheads per method call. In most of our measurements, it is

     * down to several cycles per call.

     *

     * a) Via command-line:

     *    $ mvn clean install

     *    $ java -jar target/benchmarks.jar JMHSample_01

     *

     * JMH generates self-contained JARs, bundling JMH together with it.

     * The runtime options for the JMH are available with "-h":

     *    $ java -jar target/benchmarks.jar -h

     *

     * b) Via the Java API:

     *    (see the JMH homepage for possible caveats when running from IDE:

     *      http://openjdk.java.net/projects/code-tools/jmh/)

     */

    public static void main(String[] args) throws RunnerException {

        Options opt = new OptionsBuilder()

                .include(JMHSample_01_HelloWorld.class.getSimpleName())

                .forks(1)

                .build();

        new Runner(opt).run();

    }

}
测试类
@BenchmarkMode(Mode.AverageTime) //测试平均执行时间

// iterations:预热迭代次数,time每次迭代用时(原理:任务丢到线程池后,sleep指定的time,isDone = true,线程来判断isDone)

@Warmup(iterations = 1, time = 4)

//iterations:测量迭代次数,time每次迭代用时,batchSize:相当于给函数加了一个for循环(整个for循环完成的时间要>time),整个for循环算一个operation

@Measurement(iterations = 3, time = 3, batchSize = 3)

@Fork(2) //总执行两轮

@Threads(1) //线程池线程数

@OutputTimeUnit(TimeUnit.MILLISECONDS) //结果输出单位

public class JMH {

    @Benchmark

    public void testStringAdd() {

        System.out.println(TimeUtils.CurrentTimeString());

        try { Thread.sleep(1000 * 1); } catch (InterruptedException e) { e.printStackTrace(); }

    }

}
# JMH version: 1.21

# VM version: JDK 1.8.0_181, Java HotSpot(TM) 64-Bit Server VM, 25.181-b13

# VM invoker: /Library/Java/JavaVirtualMachines/jdk1.8.0_181.jdk/Contents/Home/jre/bin/java

# VM options: -Dfile.encoding=UTF-8

# Warmup: 1 iterations, 4 s each, 3 calls per op

# Measurement: 3 iterations, 3 s each

# Timeout: 10 min per iteration

# Threads: 1 thread, will synchronize iterations

# Benchmark mode: Average time, time/op

# Benchmark: test.JMH.testStringAdd

# Run progress: 0.00% complete, ETA 00:00:26

# Fork: 1 of 2

# Warmup Iteration   1: 14-12-2019 18:33:15.233

14-12-2019 18:33:16.262

14-12-2019 18:33:17.264

14-12-2019 18:33:18.268

4041.154 ms/op

Iteration   1: 14-12-2019 18:33:19.283

14-12-2019 18:33:20.288

14-12-2019 18:33:21.289

1002.735 ms/op

Iteration   2: 14-12-2019 18:33:22.293

14-12-2019 18:33:23.296

14-12-2019 18:33:24.301

1003.472 ms/op

Iteration   3: 14-12-2019 18:33:25.305

14-12-2019 18:33:26.311

14-12-2019 18:33:27.312

1002.975 ms/op

# Run progress: 50.00% complete, ETA 00:00:13

# Fork: 2 of 2

# Warmup Iteration   1: 14-12-2019 18:33:28.694

14-12-2019 18:33:29.717

14-12-2019 18:33:30.720

14-12-2019 18:33:31.722

4036.272 ms/op

Iteration   1: 14-12-2019 18:33:32.752

14-12-2019 18:33:33.757

14-12-2019 18:33:34.763

1003.982 ms/op

Iteration   2: 14-12-2019 18:33:35.767

14-12-2019 18:33:36.770

14-12-2019 18:33:37.774

1003.988 ms/op

Iteration   3: 14-12-2019 18:33:38.780

14-12-2019 18:33:39.789

14-12-2019 18:33:40.792

1005.623 ms/op

Result "test.JMH.testStringAdd":

  1003.796 ±(99.9%) 2.891 ms/op [Average]

  (min, avg, max) = (1002.735, 1003.796, 1005.623), stdev = 1.031

  CI (99.9%): [1000.905, 1006.687] (assumes normal distribution)

# Run complete. Total time: 00:00:27

REMEMBER: The numbers below are just data. To gain reusable insights, you need to follow up on

why the numbers are the way they are. Use profilers (see -prof, -lprof), design factorial

experiments, perform baseline and negative tests that provide experimental control, make sure

the benchmarking environment is safe on JVM/OS/HW level, ask for reviews from the domain experts.

Do not assume the numbers tell you what you want them to tell.

Benchmark          Mode  Cnt     Score   Error  Units

JMH.testStringAdd  avgt    6  1003.796 ± 2.891  ms/op

Process finished with exit code 0
默认配置
public class SongTest {

    @Benchmark

    public void testDefault(){

    }

}
# VM version: JDK 1.8.0_181, Java HotSpot(TM) 64-Bit Server VM, 25.181-b13

# VM invoker: /Library/Java/JavaVirtualMachines/jdk1.8.0_181.jdk/Contents/Home/jre/bin/java

# VM options: -Dfile.encoding=UTF-8

# Warmup: 5 iterations, 10 s each (默认预热迭代5次,每次10秒)

# Measurement: 5 iterations, 10 s each (默认测量迭代5次,每次10秒)

# Timeout: 10 min per iteration (每个操作的超时时间10s)

# Threads: 1 thread, will synchronize iterations(默认一个线程)

# Benchmark mode: Throughput, ops/time(默认计算吞吐量)

# Benchmark: test.SongTest.test33
易错点:
不要编写无用代码,对于无用的代码编译器会进行优化,测试方法避免时候用void
public class JMHUnused {

    @Benchmark

    @OutputTimeUnit(TimeUnit.MICROSECONDS)

    public void test() {

    }

    @Benchmark

    @OutputTimeUnit(TimeUnit.MICROSECONDS)

    public void test1() {

        int a = 1;

        int b = 2;

        int sum = a + b; //没有返回值,认为是无用的代码,可以使用 blackhole.consume(sum);

    }

    @Benchmark

    @OutputTimeUnit(TimeUnit.MICROSECONDS)

    public int test2() {

        int a = 1;

        int b = 2;

        int sum = a + b;

        return sum;

    }

}
:返回测试结果,防止编译器优化

@Benchmark

public double measureRight_1() {

    return Math.log(x1) + Math.log(x2);

}

.通过Blackhole消费中间结果,防止编译器优化

@Benchmark

public void measureRight_2(Blackhole bh) {

    bh.consume(Math.log(x1));

    bh.consume(Math.log(x2));

}
循环处理
编译器可能会将我们的循环进行展开或者做一些其他方面的循环优化
可以结合@BenchmarkMode(Mode.SingleShotTime)和@Measurement(batchSize = N)来达到同样的效果 \
@BenchmarkMode(Mode.SingleShotTime):禁用warmup,只执行一次代码
@Measurement(batchSize = N):循环指定的方法N次,最后当成一个operation
@State(Scope.Thread)

public class JMHSample_26_BatchSize {

    List<String> list = new LinkedList<>();

    // 每个iteration中做5000次Invocation

    @Benchmark

    @Warmup(iterations = 5, batchSize = 5000)

    @Measurement(iterations = 5, batchSize = 5000)

    @BenchmarkMode(Mode.SingleShotTime)

    public List<String> measureRight() {

        list.add(list.size() / 2, "something");

        return list;

    }

    @Setup(Level.Iteration)

    public void setup(){

        list.clear();

    }

    public static void main(String[] args) throws RunnerException {

        Options opt = new OptionsBuilder()

                .include(JMHSample_26_BatchSize.class.getSimpleName())

                .forks(1)

                .build();

        new Runner(opt).run();

    }

}
方法内联
如果JVM监测到一些小方法被频繁的执行,它会把方法的调用替换成方法体本身。比如说下面这个:
CompilerControl.Mode.DONT_INLINE:强制限制不能使用内联
CompilerControl.Mode.INLINE:强制使用内联
@State(Scope.Thread)

@BenchmarkMode(Mode.AverageTime)

@OutputTimeUnit(TimeUnit.NANOSECONDS)

public class JMHSample_16_CompilerControl {

    public void target_blank() {

    }

    @CompilerControl(CompilerControl.Mode.DONT_INLINE)

    public void target_dontInline() {

    }

    @CompilerControl(CompilerControl.Mode.INLINE)

    public void target_inline() {

    }

    @Benchmark

    public void baseline() {

    }

    @Benchmark

    public void dontinline() {

        target_dontInline();

    }

    @Benchmark

    public void inline() {

        target_inline();

    }

    public static void main(String[] args) throws RunnerException {

        Options opt = new OptionsBuilder()

                .include(JMHSample_16_CompilerControl.class.getSimpleName())

                .warmupIterations(0)

                .measurementIterations(3)

                .forks(1)

                .build();

        new Runner(opt).run();

    }

}
注解含义:
@Fork
表示需要测几轮,每轮都包括预热和正式测试
@Warmup
进行benchmark前的预热,因为JVM 的 JIT 机制会把执行频率高的函数编译成机器码,从而提高速度
iterations:预热的次数
time:每次预热的时间,
timeUnit:时间单位,默认是s,默认是sec。
batchSize:批处理大小,每次操作调用几次方法(看做一次调用)。
@Mode
Throughput:吞吐量,单位时间执行次数(ops/time)
AverageTime:平均时间,每次操作的执行时间(time/op)
SampleTime:随机取样,最后输出取样结果的分布
SingleShotTime:每次迭代只运行一次,可以测试冷启动的性能,此时会禁用warmup
All:所有都测一下
@Benchmark
表示该方法是需要进行 benchmark 的对象,用法和 JUnit 的 @Test 类似。
@State
State定义了一个类实例的生命周期
由于JMH允许多线程同时执行测试,不同的选项含义如下
Scope.Thread:默认的State,每个测试线程分配一个实例;
Scope.Benchmark:所有测试线程共享一个实例,用于测试有状态实例在多线程共享下的性能;
Scope.Group:每个线程组共享一个实例;
@Setup
方法注解,会在执行 benchmark 之前被执行,正如其名,主要用于初始化。
@TearDown
方法注解,与@Setup 相对的,会在所有 benchmark 执行结束以后执行,主要用于资源的回收等。
@Threads
每个fork进程使用多少条线程去执行你的测试方法,默认值是Runtime.getRuntime().availableProcessors()。
@Level
用于控制 @Setup,@TearDown 的调用时机,默认是 Level.Trial。
Trial:每个benchmark方法前后;
Iteration:每个benchmark方法每次迭代前后;
Invocation:每个benchmark方法每次调用前后,谨慎使用,需留意javadoc注释;
@Param
成员注解,可以用来指定某项参数的多种情况。特别适合用来测试一个函数在不同的参数输入的情况下的性能。
@Param注解接收一个String数组,
在@setup方法执行前转化为为对应的数据类型。多个@Param注解的成员之间是乘积关系,譬如有两个用@Param注解的字段,第一个有5个值,第二个字段有2个值,那么每个测试方法会跑5*2=10次。
参考
https://www.cnblogs.com/sky-chen/p/10120214.html
http://tutorials.jenkov.com/java-performance/jmh.html
https://zhuanlan.zhihu.com/p/66170204
JMH java基准测试的更多相关文章
- 健壮的 Java 基准测试
健壮的 Java 基准测试 健壮的 Java 基准测试,第 1 部分: 问题 了解 Java 代码基准测试的问题 Brent Boyer, 程序员, Elliptic Group, Inc. 简介:程 ...
- Micro Benchmark Framework java 基准测试类库
Micro Benchmark Framework 框架主要是method 层面上的 benchmark,精度可以精确到微秒级 比较典型的使用场景还有: 想定量地知道某个函数需要执行多长时间,以及执行 ...
- jmh 微基准测试
选择依据:对某段代码的性能测试. 1.运行方法 mvn clean install java -jar target/benchmarks.jar JMHSample_02 -f 1 2.maven ...
- JMH基准测试框架
jmh-gradle-plugin, 集成JMH基准测试框架和 Gradle 0 赞 0 评论 文章标签:Gradle JMH 基准 INT benchmark framework 帧 ...
- JMH-大厂是如何使用JMH进行Java代码性能测试的?必须掌握!
Java 性能测试难题 现在的 JVM 已经越来越为智能,它可以在编译阶段.加载阶段.运行阶段对代码进行优化.比如你写了一段不怎么聪明的代码,到了 JVM 这里,它发现几处可以优化的地方,就顺手帮你优 ...
- Java基准性能测试--JMH使用介绍
JMH是什么 JMH是Java Microbenchmark Harness的简称,一个针对Java做基准测试的工具,是由开发JVM的那群人开发的.想准确的对一段代码做基准性能测试并不容易,因为JVM ...
- Java监控工具介绍,VisualVm ,JProfiler,Perfino,Yourkit,Perf4J,JProbe,Java微基准测试
本文是本人前一段时间做一个简单Java监控工具调研总结,主要包括VisualVm ,JProfiler,Perfino,Yourkit,Perf4J,JProbe,以及对Java微基准测试的简单介绍, ...
- Java监控工具介绍,VisualVm ,JProfiler,Perfino,Yourkit,Perf4J,JProbe,Java微基准测试【转】
Java监控工具介绍,VisualVm ,JProfiler,Perfino,Yourkit,Perf4J,JProbe,Java微基准测试[转] 本文是本人前一段时间做一个简单Java监控工具调研总 ...
- [翻译]现代java开发指南 第二部分
现代java开发指南 第二部分 第二部分:部署.监控 & 管理,性能分析和基准测试 第一部分,第二部分 =================== 欢迎来到现代 Java 开发指南第二部分.在第一 ...
随机推荐
- Kafka Streams开发入门(3)
背景 上一篇我们介绍了Kafka Streams中的消息过滤操作filter,今天我们展示一个对消息进行转换Key的操作,依然是结合一个具体的实例展开介绍.所谓转换Key是指对流处理中每条消息的Key ...
- Linux开发环境配置大全
Linux开发环境配置 零章:通过xshell在linux上安装JDK8 壹章:通过xshell在linux上安装tomcat8 贰章:通过xshell在linux上安装mysql5.7(终极版) 叁 ...
- crontab定时任务不执行,单独运行sh生效
虽然已经从事运维两三年了. 但是今天写的计划任务没有执行,排除了下, 这里整理下,方便后期查看. 排除思路 1. 确保crond服务是开机自启和当前是启动的. # centos systemctl s ...
- centos7 升级最新版内核 并安装 bcc-tools
centos7 升级最新版内核 升级系统 [root@jikeshijian ~]# yum update -y 安装 ELRepo [root@jikeshijian ~]# rpm --impor ...
- Beta冲刺(5/7)——2019.5.26
所属课程 软件工程1916|W(福州大学) 作业要求 Beta冲刺(5/7)--2019.5.26 团队名称 待就业六人组 1.团队信息 团队名称:待就业六人组 团队描述:同舟共济扬帆起,乘风破浪万里 ...
- socks_send(fd,sbuf,strlen(sbuf));
unix 命名socket发送直接发送 1024字节 计算strlen 计算的字符不正确,截取 无法正常发送
- springboot之DevTools热部署的简单原理解析
IDEA新建springboot选择DevTools springboot-devtools模块能够实现热部署,添加类.添加方法,修改配置文件,修改页面等,都能实现热部署. 原理就是重启项目,但比手动 ...
- 关于ArrayList
List概述 List是一个列表结构抽象定义,有序的,可对其中每个元素的插入位置进行精确地控制,可以通过索引来访问元素,遍历元素.包括函数的有:添加元素,删除元素,判断是否包含元素等等重要函数. ...
- OpenCV 学习笔记(7)vs2015+ffmpeg开发环境配置
参考教程 https://blog.csdn.net/HUSTLX/article/details/51014307 1.在http://ffmpeg.zeranoe.com/builds/ 下载最 ...
- 开发(三)ESP32 硬件配置
https://github.com/espressif/arduino-esp32