sklearn中的metrics模块中的Classification metrics
metrics是sklearn用来做模型评估的重要模块,提供了各种评估度量,现在自己整理如下:
一.通用的用法:Common cases: predefined values
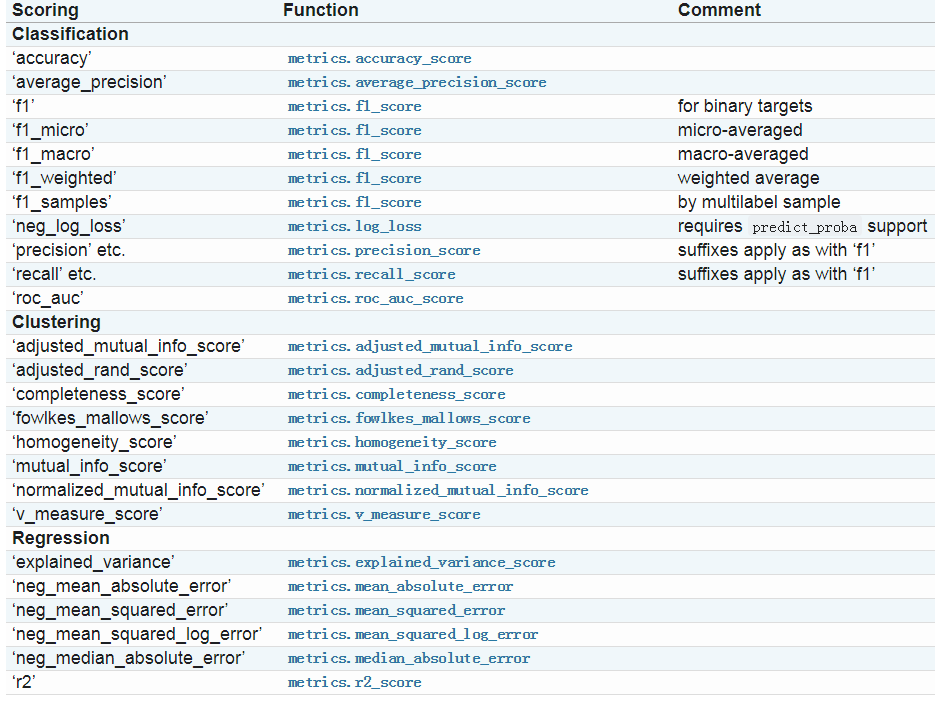
1.1 sklearn官网上给出的指标如下图所示:

1.2除了上图中的度量指标以外,你还可以自定义一些度量指标:通过sklearn.metrics.make_scorer()方法进行定义;
make_scorer有两种典型的用法:
用法一:包装一些在metrics中已经存在的的方法,但是这种方法需要一些参数,例如fbeta_score方法,官网上给出的用法如下:
from sklearn.metrics import fbeta_score, make_scorer

ftwo_scorer = make_scorer(fbeta_score, beta=2)

from sklearn.model_selection import GridSearchCV

from sklearn.svm import LinearSVC

grid = GridSearchCV(LinearSVC(), param_grid={'C': [1, 10]}, scoring=ftwo_scorer)
第二种用法是完全的定义用户自定义的函数,可以接受一下几种参数:
1.你想用的python函数;
2、不论你提供的python函数返回的是socre或者是loss,if score:the higher the better;if loss: the lower the better
3、只为分类度量:无论你提供的python方法是不是需要连续的决策因素,默认为否
4.其他额外的参数,例如f1_score中的beta或者labels
例如官网上给出的例子:
import numpy as np

def my_custom_loss_func(ground_truth, predictions):

    diff = np.abs(ground_truth - predictions).max()

    return np.log(1 + diff)

# loss_func will negate the return value of my_custom_loss_func,

#  which will be np.log(2), 0.693, given the values for ground_truth

#  and predictions defined below.

loss  = make_scorer(my_custom_loss_func, greater_is_better=False)

score = make_scorer(my_custom_loss_func, greater_is_better=True)

ground_truth = [[1], [1]]

predictions  = [0, 1]

from sklearn.dummy import DummyClassifier

clf = DummyClassifier(strategy='most_frequent', random_state=0)

clf = clf.fit(ground_truth, predictions)

loss(clf,ground_truth, predictions)

-0.69...

score(clf,ground_truth, predictions)

0.69...
1.3 使用多重度量标准
sklearn也接受在GridSearchCV,RandomizedSearchCV和Cross_validate中接受多指标,有两种指定方式;
##方式1: 使用字符串的list

scoring=['accuracy','precision']

### f方式2:使用dict进行mapping

from sklearn.metrics import accuracy_score

from sklearn.metrics import make_scorer

scoring = {'accuracy': make_scorer(accuracy_score),

           'prec': 'precision'}
注意:目前方式2(dict)模式只允许返回单一score的score方法,返回多个的需要进行加工处理,例如官方上给出的加工处理混淆矩阵的方法:
from sklearn.model_selection import cross_validate

from sklearn.metrics import confusion_matrix

# A sample toy binary classification dataset

X, y = datasets.make_classification(n_classes=2, random_state=0)

svm = LinearSVC(random_state=0)

def tp(y_true, y_pred): return confusion_matrix(y_true, y_pred)[0, 0]

def tn(y_true, y_pred): return confusion_matrix(y_true, y_pred)[0, 0]

def fp(y_true, y_pred): return confusion_matrix(y_true, y_pred)[1, 0]

def fn(y_true, y_pred): return confusion_matrix(y_true, y_pred)[0, 1]

scoring = {'tp' : make_scorer(tp), 'tn' : make_scorer(tn),

           'fp' : make_scorer(fp), 'fn' : make_scorer(fn)}

cv_results = cross_validate(svm.fit(X, y), X, y, scoring=scoring)

# Getting the test set true positive scores

print(cv_results['test_tp'])

[12 13 15]

# Getting the test set false negative scores

print(cv_results['test_fn'])

[5,4,1]
二:分类指标;
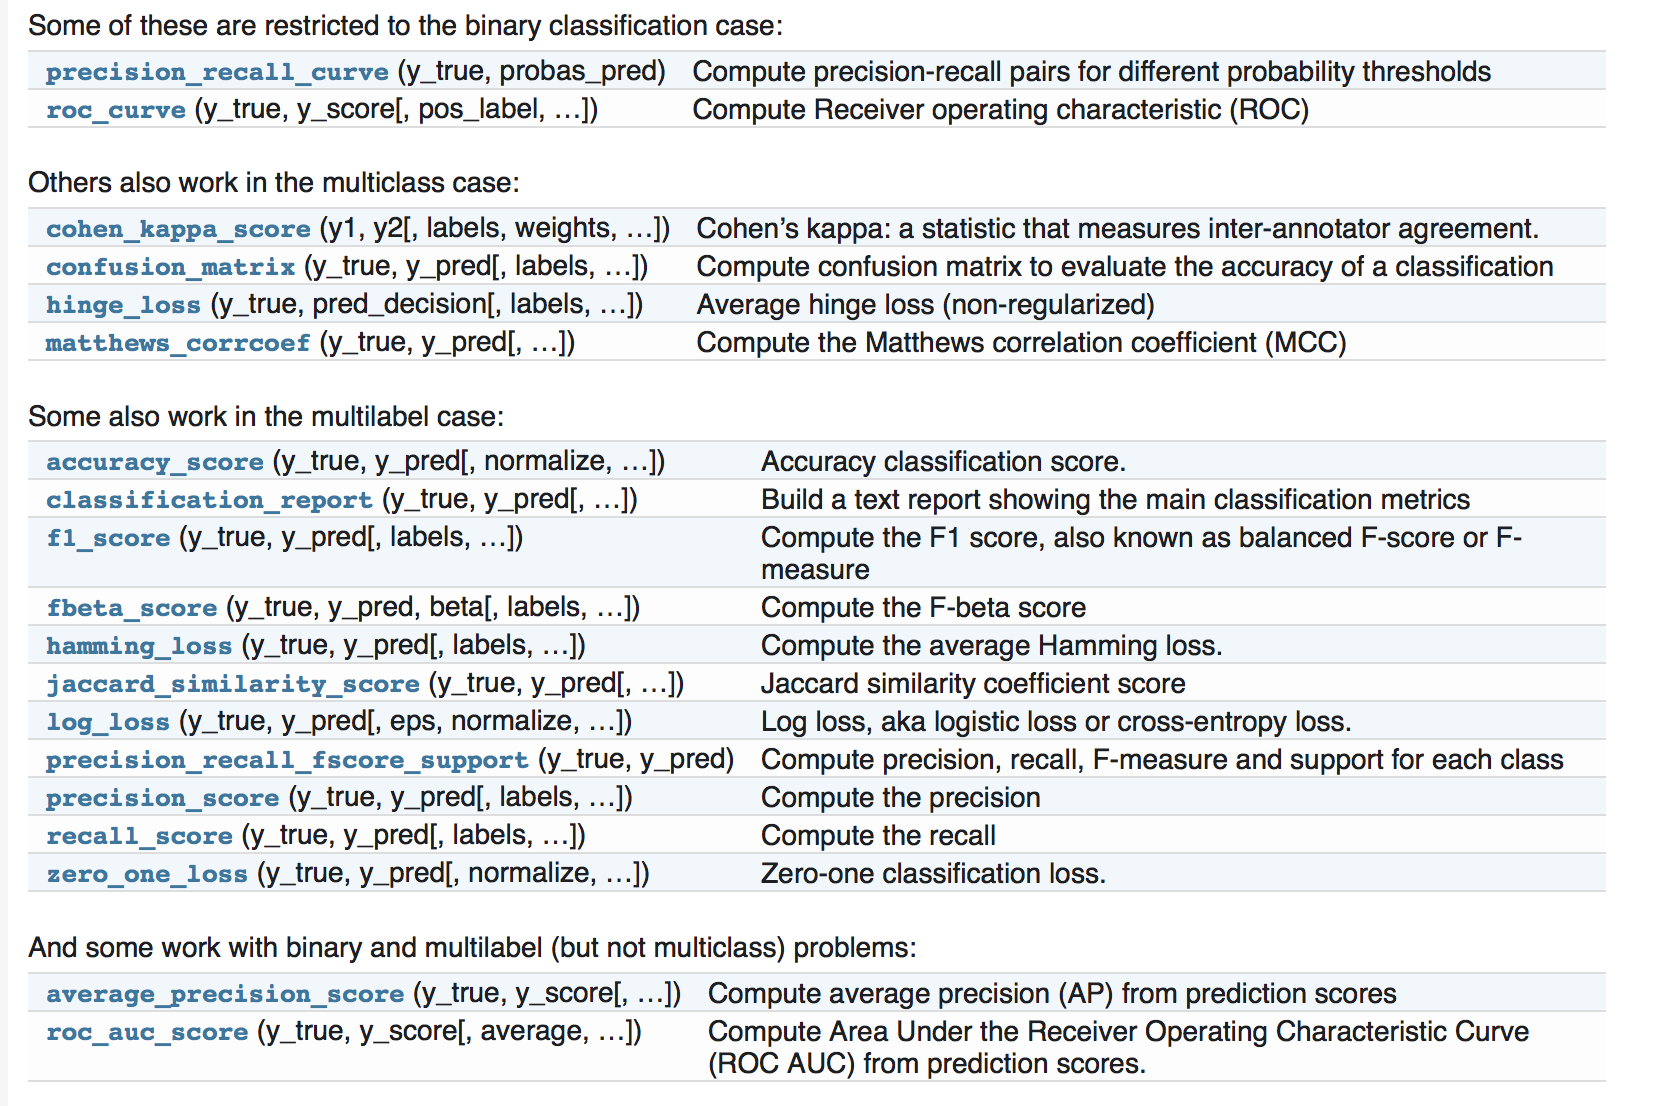
针对分类,sklearn也提供了大量的度量指标,而且针对不同的分类(二分类,多分类,)有不同的度量指标,官网截图如下:

2.1 从二分类到多分类问题:
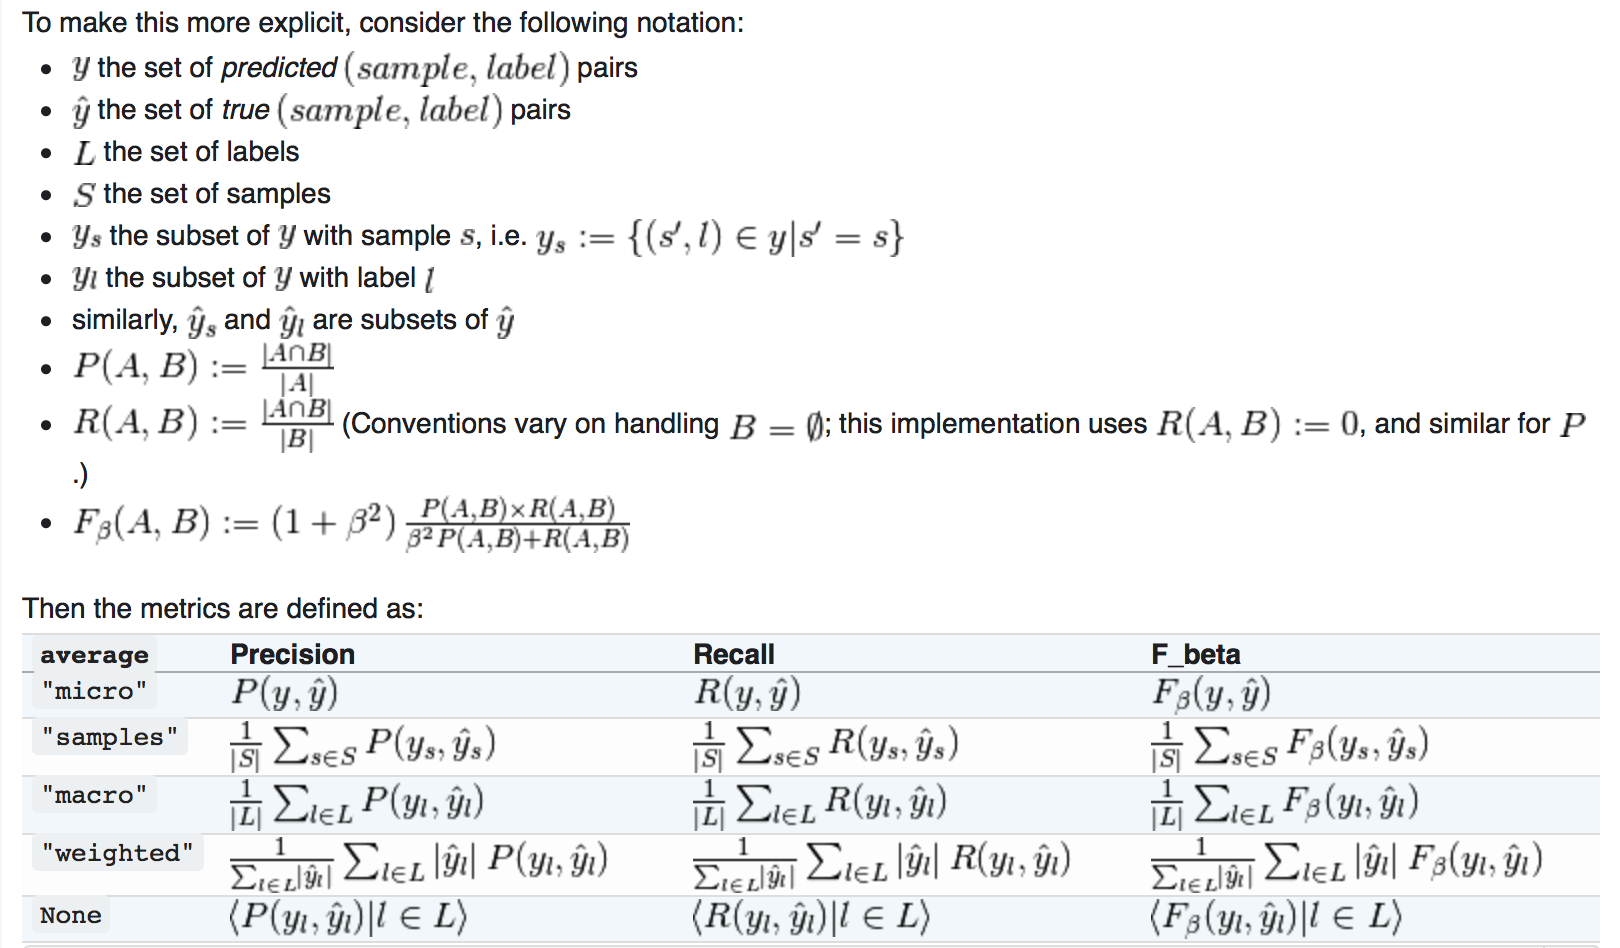
像f1_score, roc_auc_score这种度量指标大多是针对二分类问题的,但是为了将二分类的度量指标延伸到多分类问题,数据将会看做是二分类问题的集合,也就是1vs all;有好几种方式来平衡不同类别的二分度量,通过使用average参数来进行设置。
(1)marco(宏平均):当频繁的类别非常重要时,宏平均可以会突出他的性能表现;当然所有的类别同样重要是不现实的,因此宏平均可能会过度强调低频繁类别的低性能表现;
(2)weighted(权重)
(3)micro(微平均):微平均可能在多标签的分类问题的首选
(4)samples(样本):仅仅当多标签问题是可以采用。
多分类问题转换到二分类问题就是采用1vs all的方式;
2.2 准确率(accuracy)
采用accuracy_score来计算模型的accuracy,计算公式如下:
 ,其中
,其中 表示预测y值,yi表示实际的y值;
##

import numpy as np

from sklearn.metrics import accuracy_score

y_pred = [0, 2, 1, 3]

y_true = [0, 1, 2, 3]

accuracy_score(y_true, y_pred)

0.5

accuracy_score(y_true, y_pred, normalize=False)

2

###多分类问题

accuracy_score(np.array([[0, 1], [1, 1]]), np.ones((2, 2)))

0.5
2.3混淆矩阵
混淆矩阵是评价分类问题的一个典型度量,在sklearn中使用 confusion_matrix;
from sklearn.metrics import confusion_matrix

y_true = [2, 0, 2, 2, 0, 1]

y_pred = [0, 0, 2, 2, 0, 2]

confusion_matrix(y_true, y_pred)

array([[2, 0, 0],

       [0, 0, 1],

       [1, 0, 2]])
混淆矩阵Rij(多分类)的含义表示类别i被预测成类别j的次数,因此Rii表示被正确分类的次数;
对于二分类问题,混淆矩阵用来表示TN,TP,FN,FP;
y_true = [0, 0, 0, 1, 1, 1, 1, 1]

y_pred = [0, 1, 0, 1, 0, 1, 0, 1]

tn, fp, fn, tp = confusion_matrix(y_true, y_pred).ravel()

tn, fp, fn, tp

(2, 1, 2, 3)
官网上提供的混淆矩阵的可视化例子:http://scikit-learn.org/stable/auto_examples/model_selection/plot_confusion_matrix.html#sphx-glr-auto-examples-model-selection-plot-confusion-matrix-py
2.4 Classification report
Classification report展示了分类的主要度量指标,如下面例子所示:
from sklearn.metrics import classification_report

y_true = [0, 1, 2, 2, 0]

y_pred = [0, 0, 2, 1, 0]

target_names = ['class 0', 'class 1', 'class 2']

print(classification_report(y_true, y_pred, target_names=target_names))

             precision    recall  f1-score   support

    class 0       0.67      1.00      0.80         2

    class 1       0.00      0.00      0.00         1

    class 2       1.00      0.50      0.67         2

avg / total       0.67      0.60      0.59         5
2.5 Hamming loss
Hamming loss计算预测结果和实际结果的海明距离,计算公式如下:
 ,简单的理解就是预测样本中误差总数除以样本总数
例子:
from sklearn.metrics import hamming_loss

y_pred = [1, 2, 3, 4]

y_true = [2, 2, 3, 4]

hamming_loss(y_true, y_pred)

0.25
##在多标签分类中同样适合
hamming_loss(np.array([[0, 1], [1, 1]]), np.zeros((2, 2)))

0.75
2.6 Jaccard 相关系数:
Jaccard相关系数在推荐系统中经常使用,可以理解为预测正确的个数除以总的样本数,所以在二分类问题中,Jaccard系数和准确率是一样的。
 ,
,
例子:
import numpy as np

from sklearn.metrics import jaccard_similarity_score

y_pred = [0, 2, 1, 3]

y_true = [0, 1, 2, 3]

jaccard_similarity_score(y_true, y_pred)

0.5

jaccard_similarity_score(y_true, y_pred, normalize=False)

2

##multilabel

jaccard_similarity_score(np.array([[0, 1], [1, 1]]), np.ones((2, 2)))

0.75
2.7 precision,召回率,F系数等
(1)精准率(precision):正确预测为正例的样本数占全部预测为正例的样本数的比例;
(2)召回率:正例样本中预测正确的样本占实际正例样本数量的比例;
(3)F系数同时兼顾了分类模型的准确率和召回率。F1分数可以看作是模型准确率和召回率的一种加权平均,它的最大值是1,最小值是0。
计算公式:
 ;
;
分数为

precision_recall_curve:准确率召回率曲线 ,其中where
  and
and  are the precision and recall at the nth threshold.


>>> from sklearn import metrics

>>> y_pred = [0, 1, 0, 0]

>>> y_true = [0, 1, 0, 1]

>>> metrics.precision_score(y_true, y_pred)

1.0

>>> metrics.recall_score(y_true, y_pred)

0.5

>>> metrics.f1_score(y_true, y_pred)

0.66...

>>> metrics.fbeta_score(y_true, y_pred, beta=0.5)

0.83...

>>> metrics.fbeta_score(y_true, y_pred, beta=1)

0.66...

>>> metrics.fbeta_score(y_true, y_pred, beta=2)

0.55...

>>> metrics.precision_recall_fscore_support(y_true, y_pred, beta=0.5)

(array([ 0.66...,  1.        ]), array([ 1. ,  0.5]), array([ 0.71...,  0.83...]), array([2, 2]...))

>>> import numpy as np

>>> from sklearn.metrics import precision_recall_curve

>>> from sklearn.metrics import average_precision_score

>>> y_true = np.array([0, 0, 1, 1])

>>> y_scores = np.array([0.1, 0.4, 0.35, 0.8])

>>> precision, recall, threshold = precision_recall_curve(y_true, y_scores)

>>> precision

array([ 0.66...,  0.5       ,  1.        ,  1.        ])

>>> recall

array([ 1. ,  0.5,  0.5,  0. ])

>>> threshold

array([ 0.35,  0.4 ,  0.8 ])

>>> average_precision_score(y_true, y_scores)

0.83...
对于多类别分类和多标签分类,同样提供的一样的评价指标;

例子:
>>> from sklearn import metrics

>>> y_true = [0, 1, 2, 0, 1, 2]

>>> y_pred = [0, 2, 1, 0, 0, 1]

>>> metrics.precision_score(y_true, y_pred, average='macro')

0.22...

>>> metrics.recall_score(y_true, y_pred, average='micro')

...

0.33...

>>> metrics.f1_score(y_true, y_pred, average='weighted')

0.26...

>>> metrics.fbeta_score(y_true, y_pred, average='macro', beta=0.5)

0.23...

>>> metrics.precision_recall_fscore_support(y_true, y_pred, beta=0.5, average=None)

...

(array([ 0.66...,  0.        ,  0.        ]), array([ 1.,  0.,  0.]), array([ 0.71...,  0.        ,  0.        ]), array([2, 2, 2]...))
2.8 ROC曲线
ROC曲线是建模结果比较熟悉的一中展示方式:
例如如下代码:
import numpy as np

from sklearn.metrics import roc_curve

from sklearn.datasets import load_iris

from sklearn import svm

from sklearn.linear_model import LogisticRegression

from sklearn.cross_validation import train_test_split

from sklearn.metrics import roc_auc_score

from sklearn.metrics import roc_curve

import matplotlib.pyplot as plt

data=load_iris()

###两分类

X,y=data.data,data.target

X_train,X_test,y_train,y_test=train_test_split(X,y)

est=svm.SVC(probability=True)

model=est.fit(X_train,y_train)

y_score=model.decision_function(X_test)

fpr1,tpr1,thresholds1=roc_curve(y_test,model.predict_proba(X_test)[:,1],pos_label=1)

lr=LogisticRegression()

lr.fit(X_train,y_train)

fpr2,tpr2,thresholds2=roc_curve(y_test,lr.predict_proba(X_test)[:,1],pos_label=1)

plt.plot(fpr1,tpr1,linewidth=1,label='ROC of svm')

plt.plot(fpr2,tpr2,linewidth=1,label='ROC of LR')

plt.xlabel('FPR')

plt.ylabel('TPR')

plt.plot([0,1],[0,1],linestyle='--')

plt.legend(loc=4)

plt.show()

结果如上图所示。
sklearn中的metrics模块中的Classification metrics的更多相关文章
- nodejs中的fs模块中的方法
nodejs中的fs模块 引入模块 const fs =require("fs") 检测文件是否存在fs.stat(path,callback) fs.stat("./n ...
- 在vue组件中访问vuex模块中的getters/action/state
store的结构: city模块: 在各模块使用了命名空间的情况下,即 namespaced: true 时: 组件中访问模块里的state 传统方法: this.$store.state['模块名' ...
- python中的re模块中的向后引用和零宽断言
1.后向引用 pattern = re.compile(r"(\w+)")#['hello', 'go', 'go', 'hello'] # pattern = re.compil ...
- python中Scikit-Learn机器学习模块
Scikit-Learn是基于python的机器学习模块,基于BSD开源许可证.这个项目最早由DavidCournapeau 在2007 年发起的,目前也是由社区自愿者进行维护. Scikit-Lea ...
- angular中使用ngResource模块构建RESTful架构
ngResource模块是angular专门为RESTful架构而设计的一个模块,它提供了'$resource'模块,$resource模块是基于$http的一个封装.下面来看看它的详细用法 1.引入 ...
- ABP源码分析四十五:ABP ZERO中的EntityFramework模块
AbpZeroDbContext:配置ABP.Zero中定义的entity的Dbset EntityFrameworkModelBuilderExtensions:给PrimitiveProperty ...
- 如何在Meteor中使用npm模块?
首先,请在AtmosphereJs上搜索有无相关的封装包.尽量采用已有的封装包,而不是自己封装. 有两种方法在项目中使用来自npm的模块. 封装为Meteor包并在项目中添加包.使用meteor cr ...
- [转载]python中的sys模块(二)
#!/usr/bin/python # Filename: using_sys.py import sys print 'The command line arguments are:' for i ...
- [转载]Python中的sys模块
#!/usr/bin/python # Filename: cat.py import sys def readfile(filename): '''Print a file to the stand ...
随机推荐
- 深入理解Linux网络技术内幕——网络设备初始化
概述 内核的初始化过程过程中,与网络相关的工作如下所示: 内核引导时执行start_kernel,start_kernel结束之前会调用rest_init,rest_init初始化内核线 ...
- Excel 设置下拉列表
1. 把列表的候选值写到一块区域, 可以说同Sheet也可以是另一个Sheet中. 2. 选中要设置的列, 选择 Data > Data Validation 3. 在Data Validati ...
- Redis的持久化策略
Redis 持久化: 提供了多种不同级别的持久化方式:一种是RDB,另一种是AOF. RDB 持久化可以在指定的时间间隔内生成数据集的时间点快照(point-in-time snapshot). AO ...
- [LeetCode&Python] Problem 104. Maximum Depth of Binary Tree
Given a binary tree, find its maximum depth. The maximum depth is the number of nodes along the long ...
- 强大的dfs(用处1——拓扑排序【xdoj1025】,用处二——求强联通分量【ccf高速公路】)当然dfs用处多着咧
xdoj 1025 亮亮最近在玩一款叫做“梦想庄园”的经营游戏.在游戏中,你可以耕种,养羊甚至建造纺织厂. 如果你需要制造衣服,你首先得有布匹和毛线.布匹由棉花纺织而成:毛线由羊毛制成,而羊需要饲料才 ...
- LOJ2540. 「PKUWC2018」随机算法【概率期望DP+状压DP】
LINK 思路 首先在加入几个点之后所有的点都只有三种状态 一个是在独立集中,一个是和独立集联通,还有一个是没有被访问过 然后前两个状态是可以压缩起来的 因为我们只需要记录下当前独立集大小和是否被访问 ...
- 【多线程学习笔记整理】002_线程的停止、暂停、与yield
一.停止线程的三种方式 停止线程是多线程中的一个很重要的点,停止线程意味着在线程处理完当前任务之前终止正在做的操作,但是如果不能正确的操作,可能会发生不可预期的结果. 1)使用退出标志,使线程正常退出 ...
- GaugeControl 之 DigitalGauge
https://documentation.devexpress.com/#WindowsForms/clsDevExpressXtraGaugesWinGaugesDigitalDigitalGau ...
- Apache2.4配置(全)
http://blog.csdn.net/u012291157/article/details/46492137
- MOSFET 线路 12V 无法工作的问题(等待回复)
问题: ˇ星空-北京:5V的时候,MOS管可以关断:12V的时候关不断: 初步判断在 Q4 上,先建议按以下方式测量数据. (Excel 文件) 等待回复. 参考链接:http://blog.51ct ...

 又称平衡F分数(balanced F Score),它被定义为精确率和