【转载】linux性能监控分析及通过nmon_analyse生成分析报表
转载地址:http://www.cnblogs.com/Lam7/p/6604832.html
nmon是一款分析 AIX 和 Linux 性能的免费工具
nmon 工具还可以将相同的数据捕获到一个文本文件,便于以后对报告进行分析和绘制图形。输出文件采用电子表格的格式 (.csv)。
性能介绍
nmon 工具可以为 AIX 和 Linux 性能专家提供监视和分析性能数据的功能,其中包括:
- CPU 使用率
- 内存使用情况
- 内核统计信息和运行队列信息
- 磁盘 I/O 速度、传输和读/写比率
- 文件系统中的可用空间
- 磁盘适配器
- 网络 I/O 速度、传输和读/写比率
- 页面空间和页面速度
- CPU 和 AIX 规范
- 消耗资源最多的进程
- IBM HTTP Web 缓存
- 用户自定义的磁盘组
- 计算机详细信息和资源
- 异步 I/O,仅适用于 AIX
- 工作负载管理器 (WLM),仅适用于 AIX
- IBM TotalStorage® Enterprise Storage Server® (ESS) 磁盘,仅适用于 AIX
- 网络文件系统 (NFS)
- 动态 LPAR (DLPAR) 更改,仅适用于面向 AIX 或 Linux 的 pSeries p5 和 OpenPower
还包括一个用来从 nmon 的输出生成图形并创建可以在 Web 站点显示的 .gif文件的新工具。
工具运行
安装
- 将 nmonXXX.tar.Z 文件复制到计算机。如果使用 FTP,请记住使用二进制模式。注意:示例中的 XXX 由实际的版本代替。
- 要解压该文件,可以运行 uncompress nmonXX.tar.Z。
- 要提取该文件,可以运行 tar xvf nmonXX.tar。
- 阅读自述文件。
- 要启动 nmon 工具,输入 nmon。
- 如果您是 root 用户,可能需要输入 ./nmon。
下面介绍下安装工具步骤,其实安装还是挺方便挺简单的
- [root@lamw /home/lam7/nmon]# ls
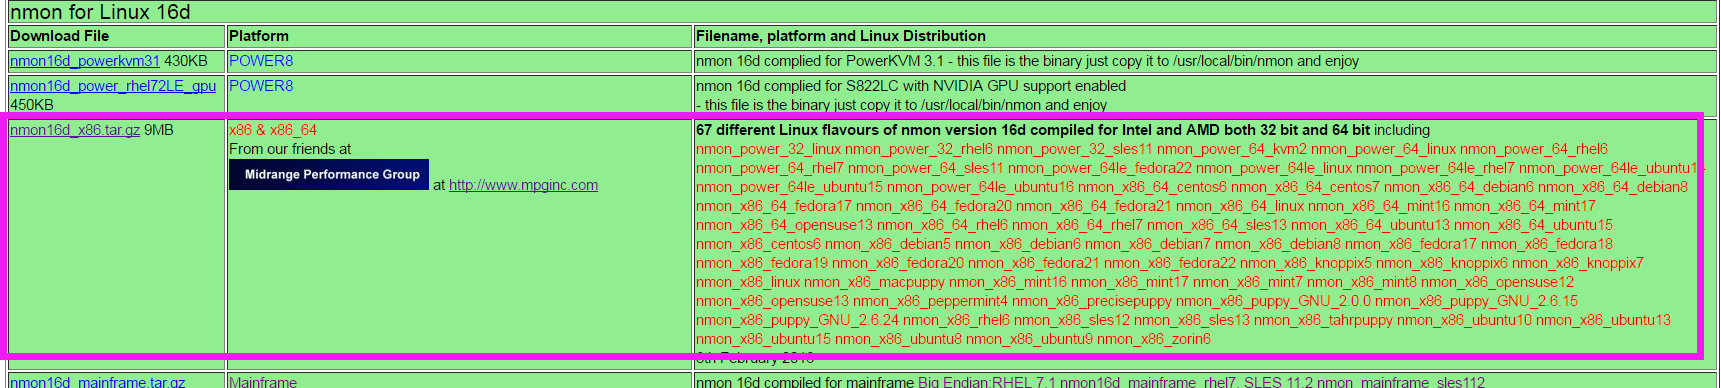
- nmon16d_x86.tar.gz nmon_analyser_v51_2.zip
将下载的 nmon16d_x86.tar.gz 解压
[root@lamw /home/lam7/nmon]# tar -xzvf nmon16d_x86.tar.gz
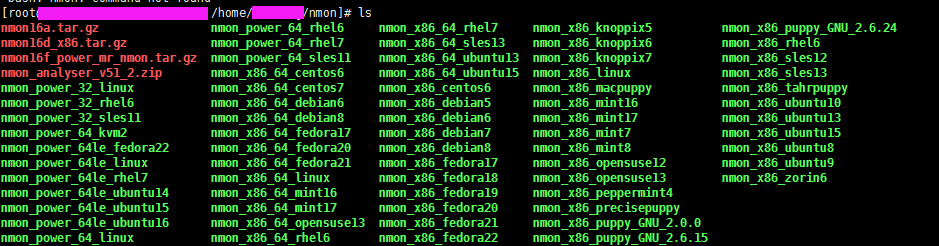
然后会到解压出来好多类型不同平台的二进制nmon,笔者这里的系统是nmon_x86_64_centos6,所以给nmon_x86_64_centos6文件执行权限
找到对应的linux版本
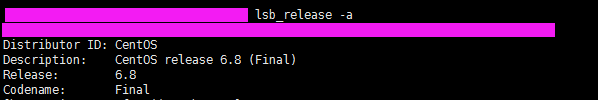
不知道版本的可以输入
[root@lamw /root]# lsb_release -a 查看版本
[root@lamw /home/lam7/nmon]# chmod u+x nmon_x86_64_centos6
笔者这边把 nmon_x86_64_centos6 文件名称改成“nmon”了方便后续执行 (PS:如果不改文件名称可以直接 ./nmon_x86_64_centos6去执行)
然后就可以用 ./nmon去执行了
[root@lamw /home/lam7/nmon]# ./nmon
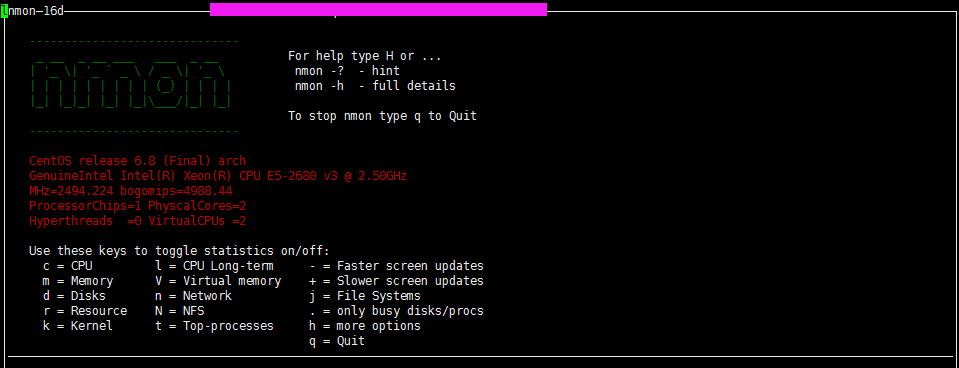
nmon是个交互式程序,当我们执行nmon的时候会出现一个交互窗口,我们执行相关的命令就会出现相关的信息。
比如这里我按c,就会显示cpu的相关信息
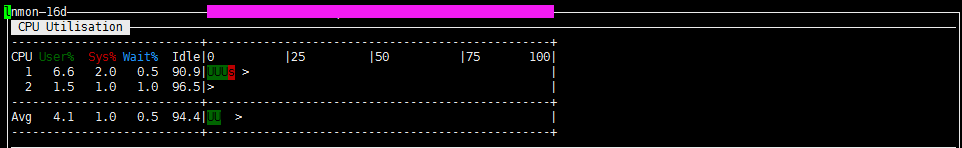
根据自己需要监控的数据直接输入相关信息即可,按H 可以查看对应的命令帮助解释
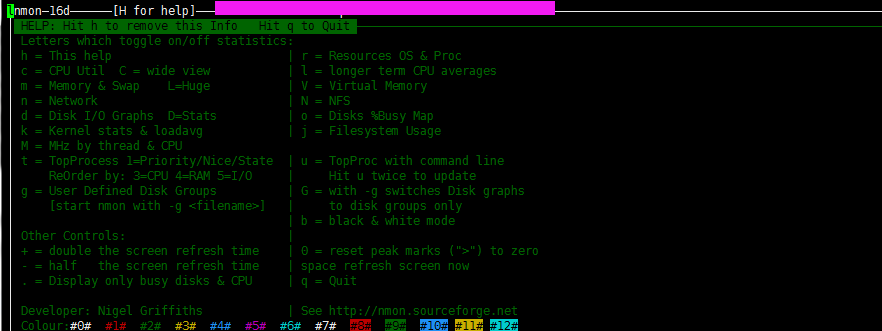
按q键,退出显示,其实就是这么简单。
下面通过nmon_analyse生成分析报表
nmon -h 可以查看帮助信息

- Hint for nmon version 16d
- Full Help Info : nmon -h
- On-screen Stats: nmon
- Data Collection: nmon -f [-s <seconds>] [-c <count>] [-t|-T]
- Capacity Plan : nmon -x
- Interactive-Mode:
- Read the Welcome screen & at any time type: "h" for more help
- Type "q" to exit nmon
- For Data-Collect-Mode
- -f Must be the first option on the line (switches off interactive mode)
- Saves data to a CSV Spreadsheet format .nmon file in then local directory
- Note: -f sets a defaults -s300 -c288 which you can then modify
- Further Data Collection Options:
- -s <seconds> time between data snapshots
- -c <count> of snapshots before exiting
- -t Includes Top Processes stats (-T also collects command arguments)
- -x Capacity Planning=15 min snapshots for 1 day. (nmon -ft -s 900 -c 96)
- ---- End of Hints
- ---- Full Help Information for nmon 16d
- For Interactive and Data Collection Mode:
- User Defined Disk Groups (DG) - This works in both modes
- It is a work around Linux issues, where disks & partitions are mixed up in /proc files
- & drive driver developers use bizarre device names, making it trick to separate them.
- -g <filename> Use this file to define the groups
- - On each line: group-name <disks-list> (space separated list)
- - Example line: database sdb sdc sdd sde
- - Up to 64 disk groups, 512 disks per line
- - Disks names can appear more than one group
- -g auto - Will generate a file called "auto" with just disks from "lsblk|grep disk" output
- For Interactive use define the groups then type: g or G
- For Data Capture defining the groups switches on data collection
- Data-Collect-Mode = spreadsheet format (i.e. comma separated values)
- Note: Use only one of f, F, R, x, X or z to switch on Data Collection mode
- Note: Make it the first argument then use other options to modify the defaults
- Note: Don't collect data that you don't want - it just makes the files too large
- Note: Too many snapshots = too much data and crashes Analyser and other tools
- Note: 500 to 800 snapshots make a good graph on a normal size screen
- Recommended normal minimal options: snapshots every 2 minutes all day:
- Simple capture: nmon -f -s 120 -c 720
- With Top Procs: nmon -fT -s 120 -c 720
- Set the directory: nmon -fT -s 120 -c 720 -m /home/nag/nmon
- Capture a busy hour: nmon -fT -s 5 -c 720 -m /home/nag/nmon
- For Data-Collect-Mode Options
- -f spreadsheet output format [note: default -s300 -c288]
- output file is <hostname>_YYYYMMDD_HHMM.nmon
- -F <filename> same as -f but user supplied filename
- Not recommended as the default file name is perfect
- The other options in alphabetical order:
- -a Include Accelerator GPU stats
- -b Online only: for black and white mode (switch off colour)
- -c <number> The number of snapshots before nmon stops
- -d <disks> To set the maximum number of disks [default 256]
- Ignores disks if the systems has 100's of disk or the config is odd!
- -D Use with -g to add the Disk Wait/Service Time & in-flight stats
- -f and -F See above
- -g <filename> User Defined Disk Groups (see above) - Data Capture: Generates BBBG & DG lines
- -g auto See above but makes the file "auto" for you of just the disks like sda etc.
- -h This help output
- -I <percent> Set the ignore process & disks busy threshold (default 0.1%)
- Don't save or show proc/disk using less than this percent
- -l <dpl> Disks per line in data capture to avoid spreadsheet width issues. Default 150. EMC=64.
- -m <directory> nmon changes to this directory before saving to file
- Useful when starting nmon via cron
- -M Adds MHz stats for each CPU thread. Some POWER8 model CPU cores can be different frequencies
- -N Include NFS Network File System for V2, V3 and V4
- -p nmon outputs the PID when it starts. Useful in scripts to capture the PID for a later safe stop.
- -r <runname> Use in a benchmark to record the run details for later analysis [default hostname]
- -R Old rrdtool format used by some - may be removed in the future. If you use this email Nigel
- -s <seconds> Time between snap shots - with "-c count" decides duration of the data capture
- -t Include Top Processes in the output
- -T As -t plus it saves command line arguments in UARG section
- -U Include the Linux 10 CPU utilisation stats (CPUUTIL lines in the file)
- -V Print nmon version & exit immediately
- To manually load nmon files into a spreadsheet:
- sort -A *nmon >stats.csv
- Transfer the stats.csv file to your PC
- Start spreadsheet & then Open with type=comma-separated-value ASCII file
- This puts every datum in a different cell
- Now select the data of one type (same 1st column) and graph it
- The nmon Analyser & other tools do not need the file sorted.
- Capacity Planning mode - use cron to run each day
- -x Sensible spreadsheet output for one day
- Every 15 mins for 1 day ( i.e. -ft -s 900 -c 96)
- -X Sensible spreadsheet output for busy hour
- Every 30 secs for 1 hour ( i.e. -ft -s 30 -c 120)
- -z Like -x but the output saved in /var/perf/tmp assuming root user
- Interactive Mode Keys in Alphabetical Order
- Start nmon then type the letters below to switch on & off particular stats
- The stats are always in the same order on-screen
- To see more stats: make the font smaller or use two windows
- Key --- Toggles on off to control what is displayed ---
- b = Black and white mode (or use -b command line option)
- c = CPU Utilisation stats with bar graphs (CPU core threads)
- C = CPU Utilisation as above but concise wide view (up to 192 CPUs)
- d = Disk I/O Busy% & Graphs of Read and Write KB/s
- D = Disk I/O Numbers including Transfers, Average Block Size & Peaks (type: 0 to reset)
- g = User Defined Disk Groups (assumes -g <file> when starting nmon)
- G = Change Disk stats (d) to just disks (assumes -g auto when starting nmon)
- h = This help information
- j = File Systems including Journal File Systems
- k = Kernel stats Run Queue, context-switch, fork, Load Average & Uptime
- l = Long term Total CPU (over 75 snapshots) via bar graphs
- L = Large and =Huge memory page stats
- m = Memory & Swap stats
- M = MHz for machines with variable frequency 1st=Threads 2nd=Cores 3=Graphs
- n = Network stats & errors (if no errors it disappears)
- N = NFS - Network File System
- 1st NFS V2 & V3, 2nd=NFS4-Client & 3rd=NFS4-Server
- o = Disk I/O Map (one character per disk pixels showing how busy it is)
- Particularly good if you have 100's of disks
- q = Quit
- r = Resources: Machine type, name, cache details & OS version & Distro + LPAR
- t = Top Processes: select the data & order 1=Basic, 3=Perf 4=Size 5=I/O=root only
- u = Top Process with command line details
- U = CPU utilisation stats - all 10 Linux stats:
- user, user_nice, system, idle, iowait, irq, softirq, steal, guest, guest_nice
- v = Experimental Verbose mode - tries to make recommendations
- V = Virtual Memory stats
- Key --- Other Interactive Controls ---
- + = Double the screen refresh time
- - = Halves the screen refresh time
- 0 = Reset peak counts to zero (peak highlight with ">")
- 1 = Top Processes mode 1 Nice, Priority, Status
- 3 = Top Processes mode 3 CPU, Memory, Faults
- 4 = Top Processes mode 4 as 3 but order by memory
- 5 = Top Processes mode 5 as 3 but order by I/O (if root user)
- 6 = Highlights 60% row on Long Term CPU view
- 7 = Highlights 70% row on Long Term CPU view
- 8 = Highlights 80% row on Long Term CPU view
- 9 = Highlights 90% row on Long Term CPU view
- . = Minimum mode i.e. only busy disks and processes shown
- space = Refresh screen now
- Interactive Start-up Control
- If you find you always type the same toggles every time you start
- then place them in the NMON shell variable. For example:
- export NMON=cmdrtn
- Other items for Interactive and Data Collection mode:
- a) To limit the processes nmon lists (online and to a file)
- either set NMONCMD0 to NMONCMD63 to the program names
- or use -C cmd:cmd:cmd etc. example: -C ksh:vi:syncd
- Other items for Data Collection mode:
- b) To you want to stop nmon use: kill -USR2 <nmon-pid>
- c) Use -p and nmon outputs the background process pid
- d) If you want to pipe nmon output to other commands use a FIFO:
- mkfifo /tmp/mypipe
- nmon -F /tmp/mypipe &
- tail -f /tmp/mypipe
- e) If nmon fails please report it with:
- 1) nmon version like: 16d
- 2) the output of: cd /proc; cat cpuinfo meminfo partitions stat vmstat
- 3) some clue of what you were doing
- 4) I may ask you to run the debug version or collect data files
- f) If box & line characters are letters then check: terminal emulator & $TERM
- g) External Data Collectors - nmon will execute a command or script at each snapshot time
- They must output to a different file which is merge afterwards with the nmon output
- Set the following shell variables:
- NMON_START = script to generate CVS Header test line explaining the columns
- Generate: TabName,DataDescription,Column_name_and_units,Column_name_and_units ...
- NMON_SNAP = script for each snapshots data, the parameter is the T0000 snapshot number
- Generate: TabName,T00NN,Data,Data,Data ...
- NMON_END = script to clean up or finalise the data
- NMON_ONE_IN = call NMON_START less often (if it is heavy in CPU terms)
- Once capture done: cat nmon-file data-file >merged-file ; ready for Analyser or other tools
- The nmon Analyser will automatically do its best to graph the data on a new Tab sheet
- Developer: Nigel Griffiths See http://nmon.sourceforge.net
- Feedback welcome - On the current release only
- No warranty given or implied. Copyright GPLv3
运行带 -f 标志的 nmon 命令。
nmon -f -s 30 -c 100
[root@lamw /home/lam7/nmon]# nmon -f -s 36 -c 100
-f 表示生成的数据文件名中有时间;
-t 输出中包括占用率较高的进程;
-s 36 表示每 36 秒采集一次数据;
-c 100 表示采集 100 次,36s*100=3600秒;
采集60分钟数据,这样运行一次这个程序就会生成一个采集 60分钟数据的文件。该行命令将在当前目录中创建输出文件,其名称为:<hostname>_date_time.nmon", hostname" 是这台主机的主机名。
在采集当中也可以通过命令
ps -ef | grep nmon 查看采集数据的进程
[root@lamw /home/lam7/nmon]# ps -ef | grep nmon
60分钟后 再次执行 此命令可以发现 进程已结束
在我们当前目录下可以查看到 以 ****_170323_1102.nmon 命名的文件 “***”为主机名称
我们通过more命令后发现都是我们看不懂的一些文本,这就需要我们把其转化成我们能看懂的excel格式的文件。首先我们把****_170323_1102.nmon文件导出到我们的windows本地。然后通过nmon Analyser 去生成报告CSV文件
下载安装 nmon Analyser
https://www.ibm.com/developerworks/community/wikis/home?lang=en#!/wiki/Power+Systems/page/nmon_analyser
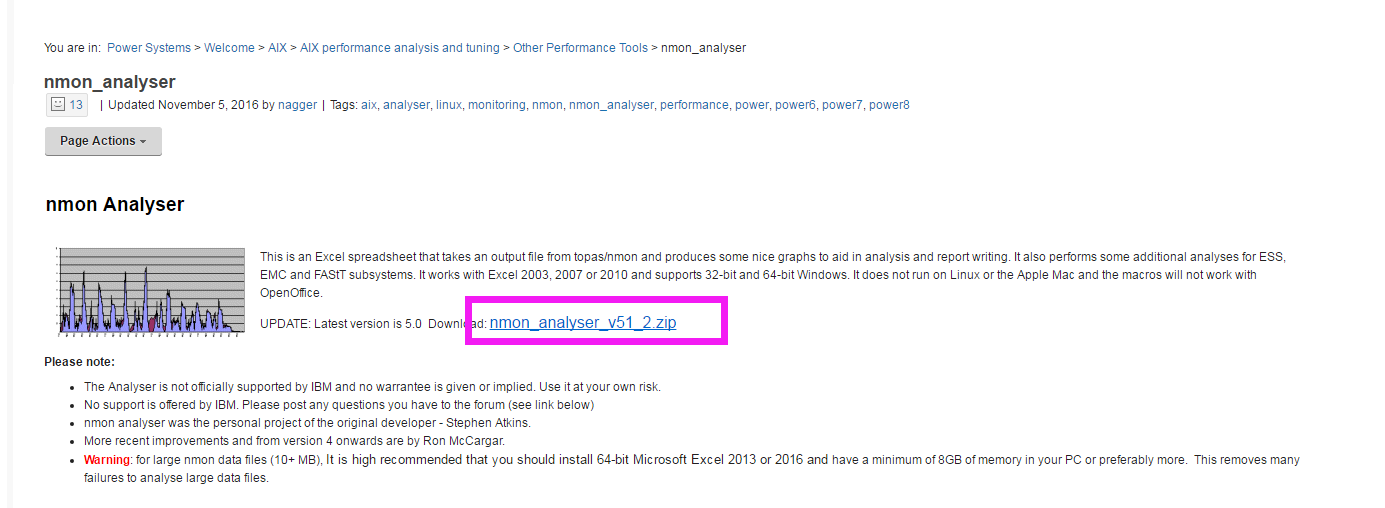
下载解压后 发现 一个是NA_UserGuide v51_2.docx的说明word格式的说明文档,另一个是nmon analyser v51_2.xlsm格式的nmon analyse文件。
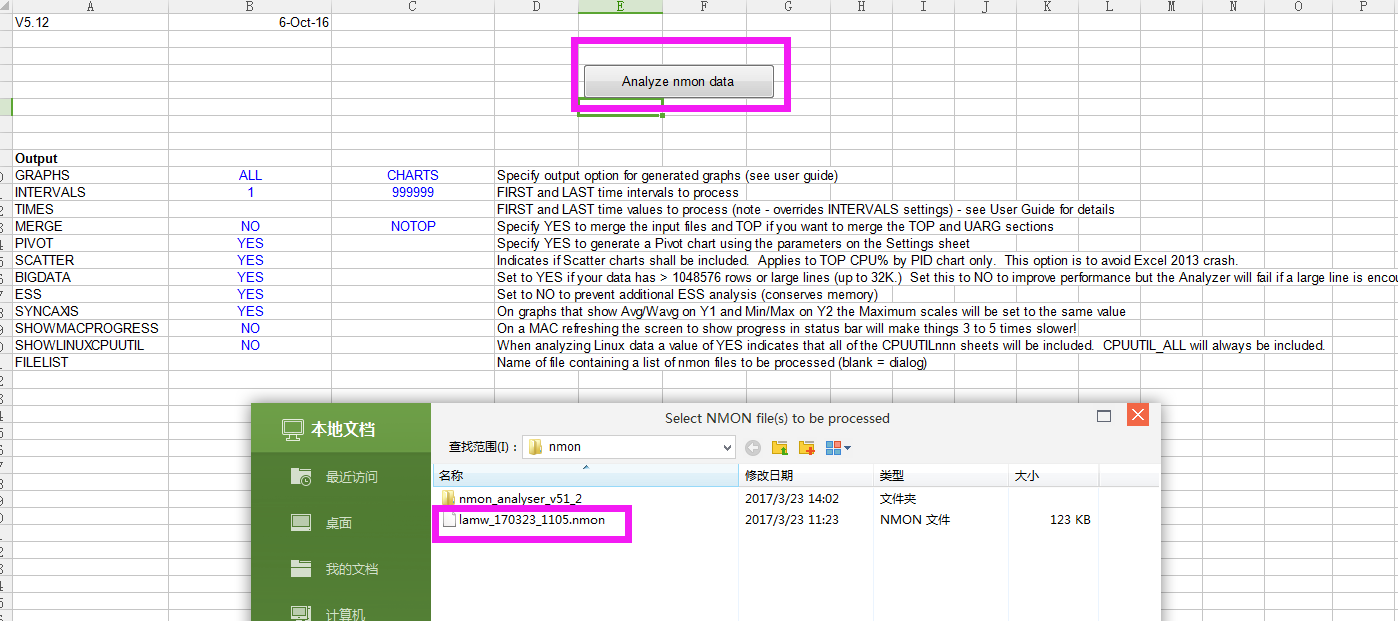
打开nmon analyser v51_2.xlsm 导入从linux中导出的 ****_170323_1102.nmon文件,生成报告excel文档
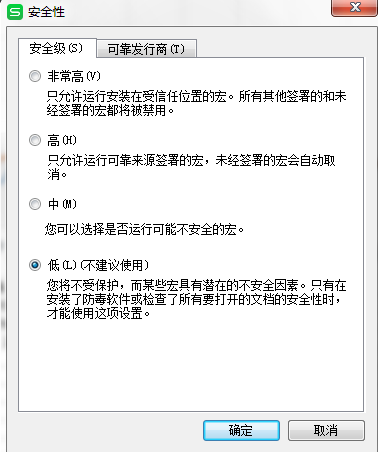
如果是用WPS打开nmon analyser v51_2.xlsm的,会提示安装 宏 ,wps是不带宏的,安装 宏 之后 调整Excel宏安全性:工具--宏--安全性----低
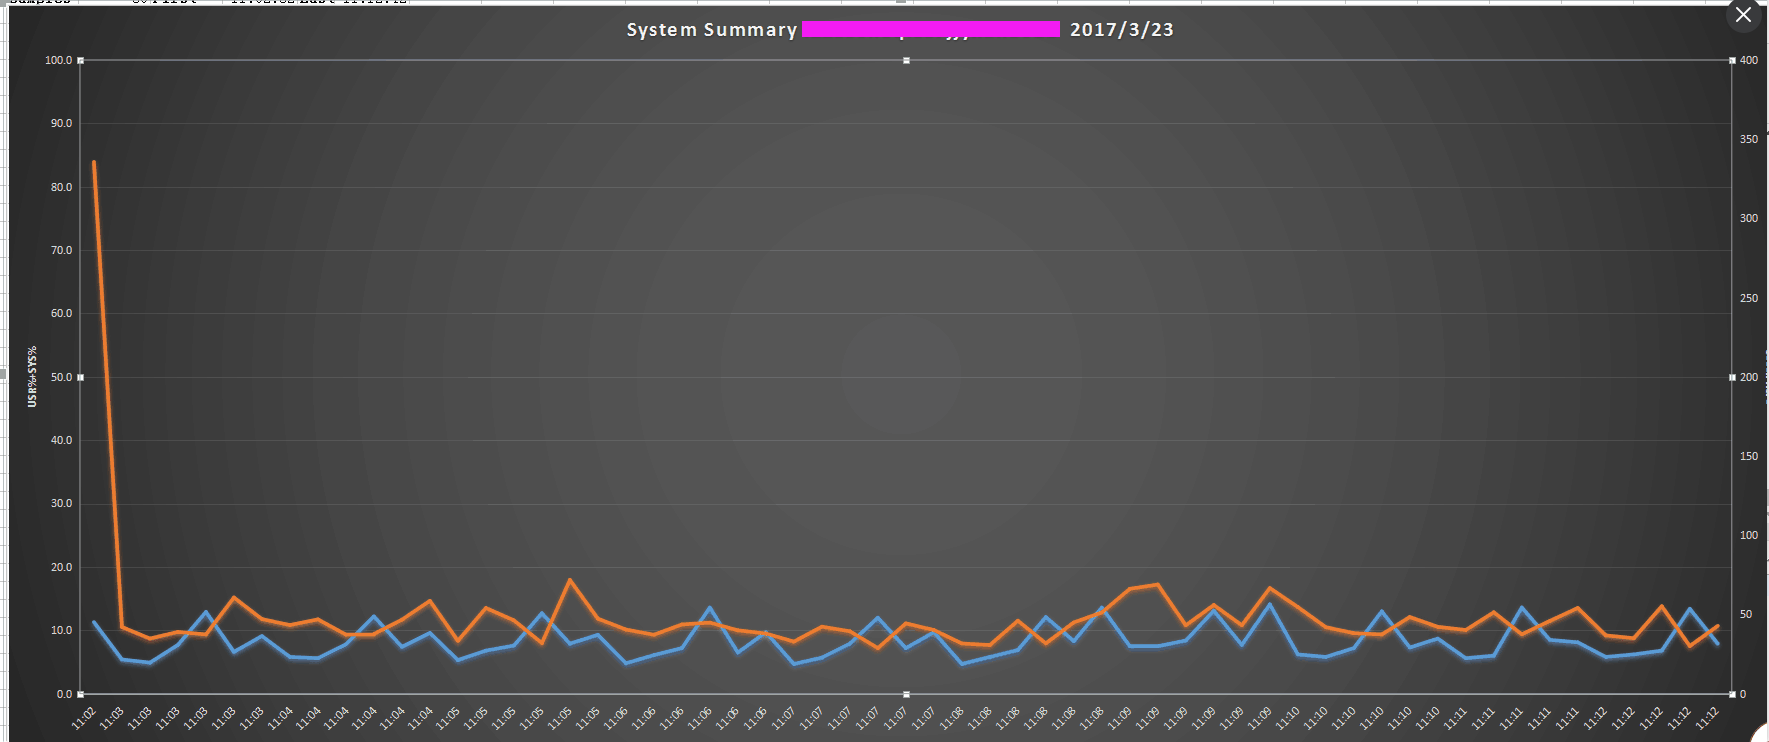

可以切换 展示的图片格式 查看所监控的数据信息
橙色 :系列"IO/sec"
蓝色 : 系列"CPU%"
【转载】linux性能监控分析及通过nmon_analyse生成分析报表的更多相关文章
- linux性能监控分析及通过nmon_analyse生成分析报表
nmon是一款分析 AIX 和 Linux 性能的免费工具 nmon 工具还可以将相同的数据捕获到一个文本文件,便于以后对报告进行分析和绘制图形.输出文件采用电子表格的格式 (.csv). 性能介绍 ...
- [转载]Linux 性能监控、测试、优化工具
Linux 平台上的性能工具有很多,眼花缭乱,长期的摸索和经验发现最好用的还是那些久经考验的.简单的小工具.系统性能专家 Brendan D. Gregg 在最近的 LinuxCon NA 2014 ...
- Linux性能监控与分析之--- CPU
Linux性能监控与分析之--- CPU 望月成三人关注 2016.07.25 18:16:12字数 1,576阅读 2,837 CPU性能指标 用户进程使用CPU的比率 系统进程使用CPU的比率 W ...
- Linux性能监控
转自:http://blog.csdn.net/chosen0ne/article/details/8200737 linux性能监控,就是要监控系统的各个子系统是否正常.linux主要的子系统包括: ...
- Linux 性能监控之CPU&内存&I/O监控Shell脚本2
Linux 性能监控之CPU&内存&I/O监控Shell脚本2 by:授客 QQ:1033553122 思路: 捕获数据->停止捕获数据->提取数据 备注:一些命令的输 ...
- Linux 性能监控之CPU&内存&I/O监控Shell脚本1
Linux 性能监控之CPU&内存&I/O监控Shell脚本1 by:授客 QQ:1033553122 #!/bin/bash # 获取要监控的本地服务器IP地址 IP=`if ...
- linux性能监控 -CPU、Memory、IO、Network等指标的讲解
[操作系统-linux]linux性能监控 -CPU.Memory.IO.Network等指标的讲解(转) 一.CPU 1.良好状态指标 CPU利用率:User Time <= 70%,Syst ...
- 【转载,整理】Linux性能监控
一. 比较全的linux性能检测网站 1. 很好的网站,原文:http://os.51cto.com/art/201402/430050.htm 监测 cpu.内存.网络.IO等命令及工具 2. ...
- Linux性能监控分析命令(五)—free命令介绍
性能监控分析的命令包括如下:1.vmstat2.sar3.iostat4.top5.free6.uptime7.netstat8.ps9.strace10.lsof 命令介绍:free命令是监控Lin ...
随机推荐
- WeQuant教程—1.2 从简单的量化系统开始
你大概知道量化的思想最早在古巴比伦人计算行星轨迹的时候就已经诞生(算术运算),后来借助古希腊的形式化逻辑的发展,人们日益能从量化的思想中提炼和描述自然规律并运用到生产之中.不过,基于量化的思想打造一个 ...
- [LeetCode] 641.Design Circular Deque 设计环形双向队列
Design your implementation of the circular double-ended queue (deque). Your implementation should su ...
- Gerrit - 代码评审工具Gerrit简介与安装
1 - 前言 Code Review 代码评审是指在软件开发过程中,对源代码的系统性检查,改进代码质量,查找系统缺陷,保证软件总体质量和提高开发者自身水平. 简单的说,Code Review是用来确认 ...
- 搭建基于docker 的redis分布式集群在docker for windows
https://blog.csdn.net/xielinrui123/article/details/85104446 首先在docker中下载使用 docker pull redis:3.0.7do ...
- 基于Livy的Spark提交平台搭建与开发
为了方便使用Spark的同学提交任务以及加强任务管理等原因,经调研采用Livy比较靠谱,下图大致罗列一下几种提交平台的差别. 本文会以基于mac的单机环境搭建一套Spark+Livy+Hadoop来展 ...
- Unity 新手引导
根据Shader动态生成遮罩 源码地址 圆形遮罩镂空处理脚本: using System; using System.Collections.Generic; using UnityEngine; u ...
- NOI2019:Stay at Home
7.16 NOI D1 从同步赛开始更起好了 先看了一圈题目,发现T1非常可做,二次函数因为对称轴在\(x < 0\)的地方所以有跟一次函数类似的单调性,搞个单调队列维护一下似乎就可以了.大力码 ...
- oracle 分页sql
select * from ( SELECT A.*, ROWNUM RN FROM ( SELECT A.*,B.USERPWiD from 测试表2 A left join 测试表3 B on A ...
- K-匿名算法研究
12月的最后几天,研究了下k匿名算法,在这里总结下. 提出背景 Internet 技术.大容量存储技术的迅猛发 展以及数据共享范围的逐步扩大,数据的自动采集 和发布越来越频繁,信息共享较以前来得更为容 ...
- git reset --hard HEAD^后显示more?的原因及如何解决
在windows的cmd控制台下操作git,想要回滚到上一次提交,但是输入git reset --hard HEAD^后就显示more? fatal: ambiguous argument 'HEAD ...