使有prometheus监控redis,mongodb,nginx,mysql,jmx
以下操作在CENTOS7环境。
使用prometheus做监控,使用grafana做dashboard的界面展示:
因prometheus自带的监控web界面图形化展示方面比较弱,推荐使用grafana集成prometheus展示;
一、软件安装
1)granafa的安装:
官方安装指南:https://grafana.com/grafana/download?platform=linux
wget https://s3-us-west-2.amazonaws.com/grafana-releases/release/grafana-5.2.2-1.x86_64.rpm
sudo yum localinstall grafana-5.2.2-1.x86_64.rpm
service grafana-server start
2)prometheus的安装:
官方下载地址:https://prometheus.io/download/
安装prometheus主程序
wget https://github.com/prometheus/prometheus/releases/download/v2.3.2/prometheus-2.3.2.linux-amd64.tar.gz
tar -zxvf prometheus-2.3.2.linux-amd64.tar.gz -C /usr/local/prometheus
cd /usr/local/prometheus
nohup ./prometheus >/dev/null &
安装 prometheus的告警程序
wget https://github.com/prometheus/alertmanager/releases/download/v0.15.2/alertmanager-0.15.2.linux-amd64.tar.gz
tar -zxvf alertmanager-0.15.2.linux-amd64.tar.gz -C /usr/local/prometheus
cd /usr/local/prometheus
nohup ./alertmanager >/dev/null &
3)需在各监控节点安装prometheus的node程序;
wget https://github.com/prometheus/node_exporter/releases/download/v0.16.0/node_exporter-0.16.0.linux-amd64.tar.gz
tar -zxvf node_exporter-0.16.0.linux-amd64.tar.gz -C /usr/local/prometheus
cd /usr/local/prometheus
nohup ./node_exporter >/dev/null &
二、安装exporter
prometheus可以理解为一个数据库+数据抓取工具,工具从各处抓来统一的数据,放入prometheus这一个时间序列数据库中。那如何保证各处的数据格式是统一的呢?就是通过这个exporter。exporter也是用GO写的程序,它开放一个http接口,对外提供格式化的数据。所以在不同的环境下,需要编写不同的exporter。好在已经有很多写好的exporter,我们可以直接使用,(本句是一句废话为了更好的排版显示)(https://github.com/prometheus这里可以找到很多exporter)我们这里直接使用mysqld_exporter(prometheus.io/download/#mysqld_exporter)。当然也要下载对应系统的版本。
2.1、mysql
解压后的内容如下:
wget https://github.com/prometheus/mysqld_exporter/releases/download/v0.11.0/mysqld_exporter-0.11.0.linux-amd64.tar.gz

tar -zxvf mysqld_exporter-0.11.0.linux-amd64.tar.gz -C /usr/local/prometheus
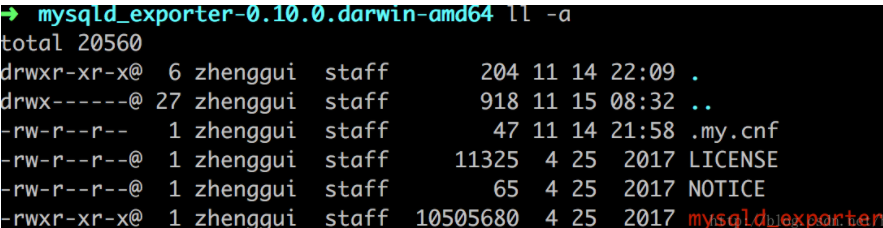
这里的mysqld_exporter是启动文件,.my.cnf是配置文件。想要正确的导出mysql的状态数据,必须在配置文件中正确的配置mysql的连接信息。我的配置如下:
配置.my.cnf文件
[client]
host = 127.0.0.1
user = REPL
password = Pbu4@123
socket = /mysqldata/data/mysqld.sock
[mysqladmin]
host = 127.0.0.1
user = zabbix
password = Zabbix@123
socket = /mysqldata/data/mysqld.sock
nohup ./mysqld_exporter --config.my-cnf=/etc/zabbix/.my.cnf --collect.binlog_size --collect.info_schema.processlist --collect.info_schema.innodb_metrics --collect.engine_innodb_status --collect.perf_schema.file_events --collect.perf_schema.eventswaits --collect.perf_schema.indexiowaits --collect.perf_schema.tableiowaits --collect.info_schema.tables --collect.info_schema.tablestats --collect.auto_increment.columns --collect.info_schema.userstats --collect.info_schema.innodb_cmp --collect.info_schema.innodb_cmpmem --collect.perf_schema.replication_group_member_stats >/dev/null &
可到grafana下载percona APP dashboard.
配置好了,就可以启动了。成功如下所示:
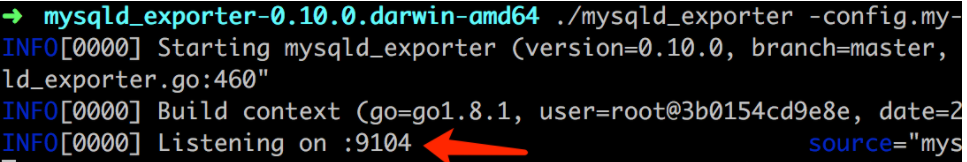
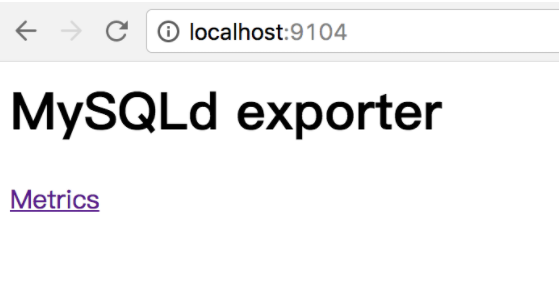
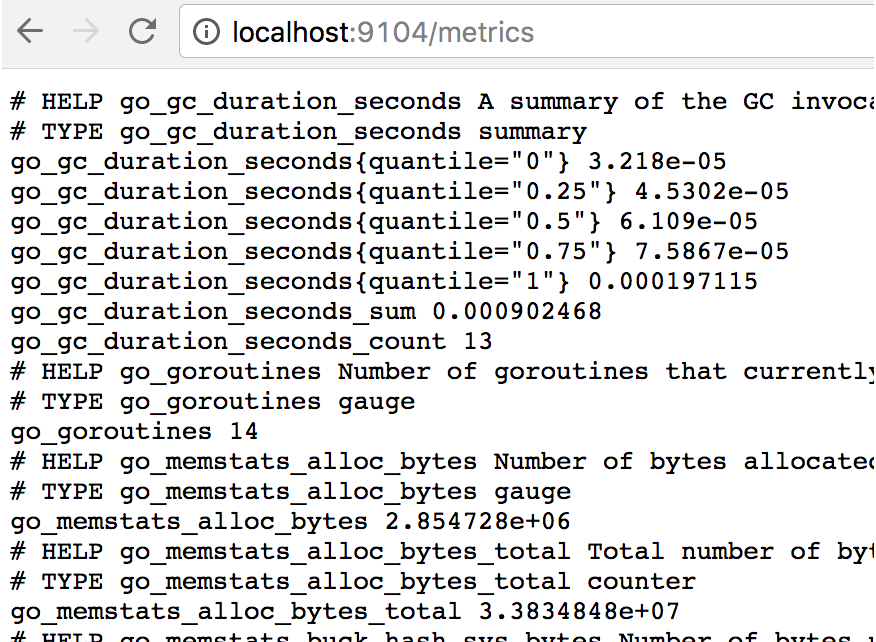
通过localhost:9104,就可以看到exporter导出的数据了:
在Prometheus中配置mysqld_exporter
exporter启动了,需要在Prometheus中正确的配置。修改prometheus目录中的prometheus.yml,增加配置如下:
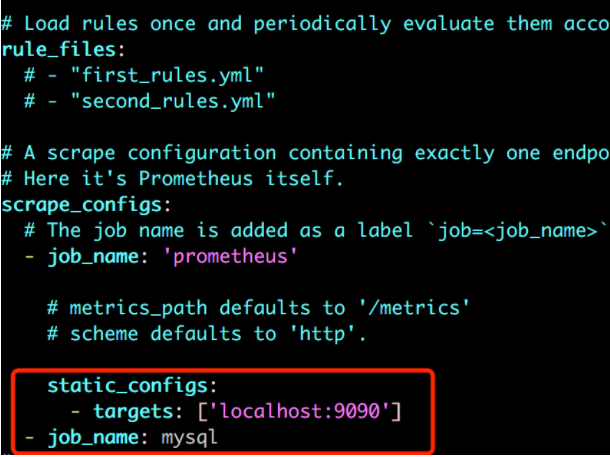
重启prometheus,点击导航栏中的status->targets可以看到,mysql的exporter已经集成进来了。 如下图:
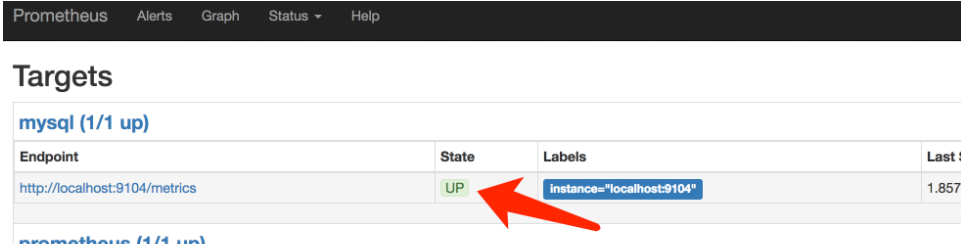
至此,prometheus这边监控mysql的环境搭建基本完成了。
2.2、mongodb的插件安装:
wget https://github.com/dcu/mongodb_exporter/releases/download/v1.0.0/mongodb_exporter-linux-amd64
tar -zxvf mongodb_exporter-linux-amd64 -C /usr/local/prometheus
cd /usr/local/prometheus
mongod配置副本集启动
./mongodb_exporter -mongodb.uri mongodb://192.168.152.128:27017,192.168.152.128:27018,192.168.152.128:27019
mongodb配置单机启动
/mongodb_exporter -mongodb.uri mongodb://192.168.152.128:27017
2.3、redis的插件安装:
redis 在redis服务器安装node_exporter和redis_exporter。
wget https://github.com/oliver006/redis_exporter/releases/download/v0.10.8/redis_exporter-v0.10.8.linux-amd64.tar.gz

wget https://github.com/prometheus/node_exporter/releases/download/0.13.0/node_exporter-0.13.0.linux-amd64.tar.gz

tar -zxvf node_exporter-0.13.0.linux-amd64.tar.gz -C /opt/prometheus_exporters --strip-components=1

tar -zxvf redis_exporter-v0.10.8.linux-amd64.tar.gz -C /opt/prometheus_exporters --strip-components=1

启动

nohup /opt/prometheus_exporters/node_exporter &

nohup /opt/prometheus_exporters/redis_exporter redis//192.168.0.17:6379 &

配置prometheus.yml 加入

- job_name: redis_exporter

  static_configs:

  - targets: ['192.168.0.17:9121']
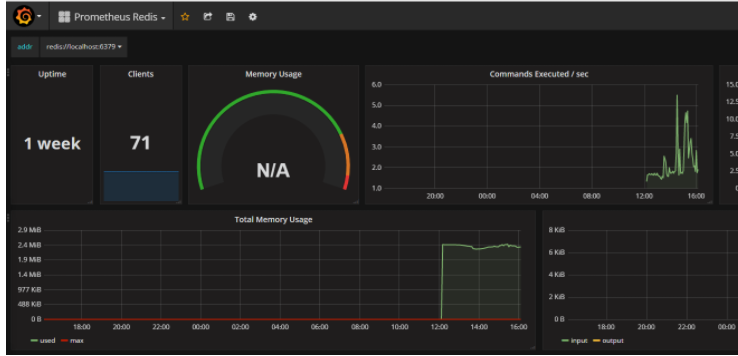
下载grafana的redis的prometheus-redis_rev1.json模板
wget https://grafana.com/api/dashboards/763/revisions/1/download
在grafana中导入json模板
2.4、nginx的插件安装:
下载源码nginx,再下载nginx-module-vts moudle进行编译安装。
git clone git://github.com/vozlt/nginx-module-vts.git
./configure --user=www --group=www --prefix=/usr/local/nginx --with-http_sysguard_module --with-stream --add-module=nginx-module-vts
make &&make install
更改Nginx Conf的配置,添加监控接口/status/:
http {
vhost_traffic_status_zone;
vhost_traffic_status_filter_by_host on;
...
server {
...
location /status {
vhost_traffic_status_display;
vhost_traffic_status_display_format html;
}
}
}
2.5、jmx的插件安装:
注意只对Oracle原生的jdk的相关指标可监控,openjdk的只能监控部分指标。
wget https://repo1.maven.org/maven2/io/prometheus/jmx/jmx_prometheus_javaagent/0.3.1/jmx_prometheus_javaagent-0.3.1.jar
tar -zxvf jmx_prometheus_javaagent-0.3.1.jar
配置config.yml文件
---
startDelaySeconds: 0
hostPort: localhost:58888 #master为本机IP(一般可设置为localhost);1234为想设置的jmx端口(可设置为未被占用的端口)
ssl: false
lowercaseOutputName: false
lowercaseOutputLabelNames: false
启动jar
java -Djava.security.egd=file:/dev/./urandom -javaagent:/var/lib/prometheus/jmx_prometheus_javaagent-0.3.1.jar=9157:/etc/prometheus/config.yml -Dcom.sun.management.jmxremote.ssl=false -Dcom.sun.management.jmxremote.authenticate=false -Dcom.sun.management.jmxremote.port=58888 -Djava.rmi.server.hostname=localhost -jar /app.jar
三、最后在安装后的granfa里,配置prometheus 源,再到granfa里下载相关的dashboard进行配置。
使有prometheus监控redis,mongodb,nginx,mysql,jmx的更多相关文章
- Prometheus监控 Redis & Redis Cluster 说明
说明 在前面的Prometheus + Grafana 部署说明之「安装」文章里,大致介绍说明了Prometheus和Grafana的一些安装使用,现在开始如何始部署Prometheus+Grafan ...
- 二 prometheus 监控 Redis
Prometheus 监控Redis需要用到redis_exporter客户端, Prometheus -> redis_exporter这个模式, 类似监控Mysql 一个思路. 1 ) 设置 ...
- prometheus监控redis,redis-cluster
Prometheus监控redis使用的是redis_exporter, 作者GitHub: https://github.com/oliver006/redis_exporter 需要说明的是: r ...
- Prometheus 监控 Redis 集群的正确姿势
Prometheus 监控Redis的正确姿势(redis集群) Prometheus 监控 Redis cluster,其实套路都是一样的,使用 exporter. exporter 负责采集指标, ...
- linux+node.js+redis+mongodb+nginx环境的搭建
1.推荐购买阿里云服务器,使用Centos7.0的服务器版本,在创建完全系统并进入之后,第一步是更新服务器的相关组件 yum -y install gcc gcc-c++ openssl-dev ...
- supervisor 监控redis & mongodb
安装 安装python brew install python 安装pipwget https://bootstrap.pypa.io/get-pip.pysudo python get-pip.py ...
- prometheus监控redis
下载redis_exporter插件 代理插件不一定非要安装在redis端 wget https://github.com/oliver006/redis_exporter/releases/down ...
- prometheus 监控 redis + rabbitmq
1.安装部署 1.1 wget https://github.com/oliver006/redis_exporter/releases/download/v0.15.0/redis_exporter ...
- prometheus 监控的目标 - nginx - apache
1.jvm类型 8563的grafanadashboard: gc时间,使用的现场,加载的类数 2.apache , nginx 用户连接状态,waiting数量 (使用nginx_status) c ...
随机推荐
- .net正则IP加端口,并返回IP加端口
public string GetIp(string url) { var reg = new Regex(@"\d{2,3}([.]\d{1,3}){3}:\d{2,5}"); ...
- laravel 实现增 与查
//调用模型层 <?phpnamespace App;use Illuminate\Support\Facades\DB;use Illuminate\Database\Eloquent\Mod ...
- java 打包 war包
接下来,执行jar命令,格式为: jar cvf cmd.war . 打包文件名称 要打包的目录 打包文件保存路径 解压: jar xvf cmd.war
- ssl证书安装到iis服务器
1.先购买ssl证书, 2.对付会先发一份邮件到你的邮箱,进行验证 3.再查看邮箱,会发现有了对应的证书文件. 附件会有一个压缩包,里面包含4份证书文件, 还有一个通配符的字符串. 4.下载之后, 先 ...
- GeoServer java.io.IOException: No such resource: generic.sld No such resource: generic.sld
原因是 发布 图层时 没有设置类型 默认 generic 但是我们的数据库中 没有这个 解决办法: 点击 图层--点击 相应的 图层名称 ---发布 --- WMS Settings 下面的Defa ...
- nodejs --- formidable模块 , post 上传.
1. 只有一个文件域: var formidable = require('formidable'), http = require('http'), util = require('util'); ...
- FCC JS基础算法题(11):Seek and Destroy (摧毁数组)
题目描述: 实现一个摧毁(destroyer)函数,第一个参数是待摧毁的数组,其余的参数是待摧毁的值. 我们可以使用arguments来进行参数的遍历. function destroyer(arr) ...
- Matlab_audiowrite_音频生成
输出音频文件所需函数为 audiowrite .通过例程进行解释: % 生成时间序列 fs = 5000; % [Hz] 信号采样频率 T = 1; % [s] 信号长度 x = 0:1/fs:T; ...
- 剑指Offer 52. 正则表达式匹配 (字符串)
题目描述 请实现一个函数用来匹配包括'.'和'*'的正则表达式.模式中的字符'.'表示任意一个字符,而'*'表示它前面的字符可以出现任意次(包含0次). 在本题中,匹配是指字符串的所有字符匹配整个模式 ...
- Xcodebuild ipa shell
命令行下打包iOS App工程: #!/bin/sh # # How To Build ? #http://www.jianshu.com/p/3f43370437d2 #http://www.jia ...