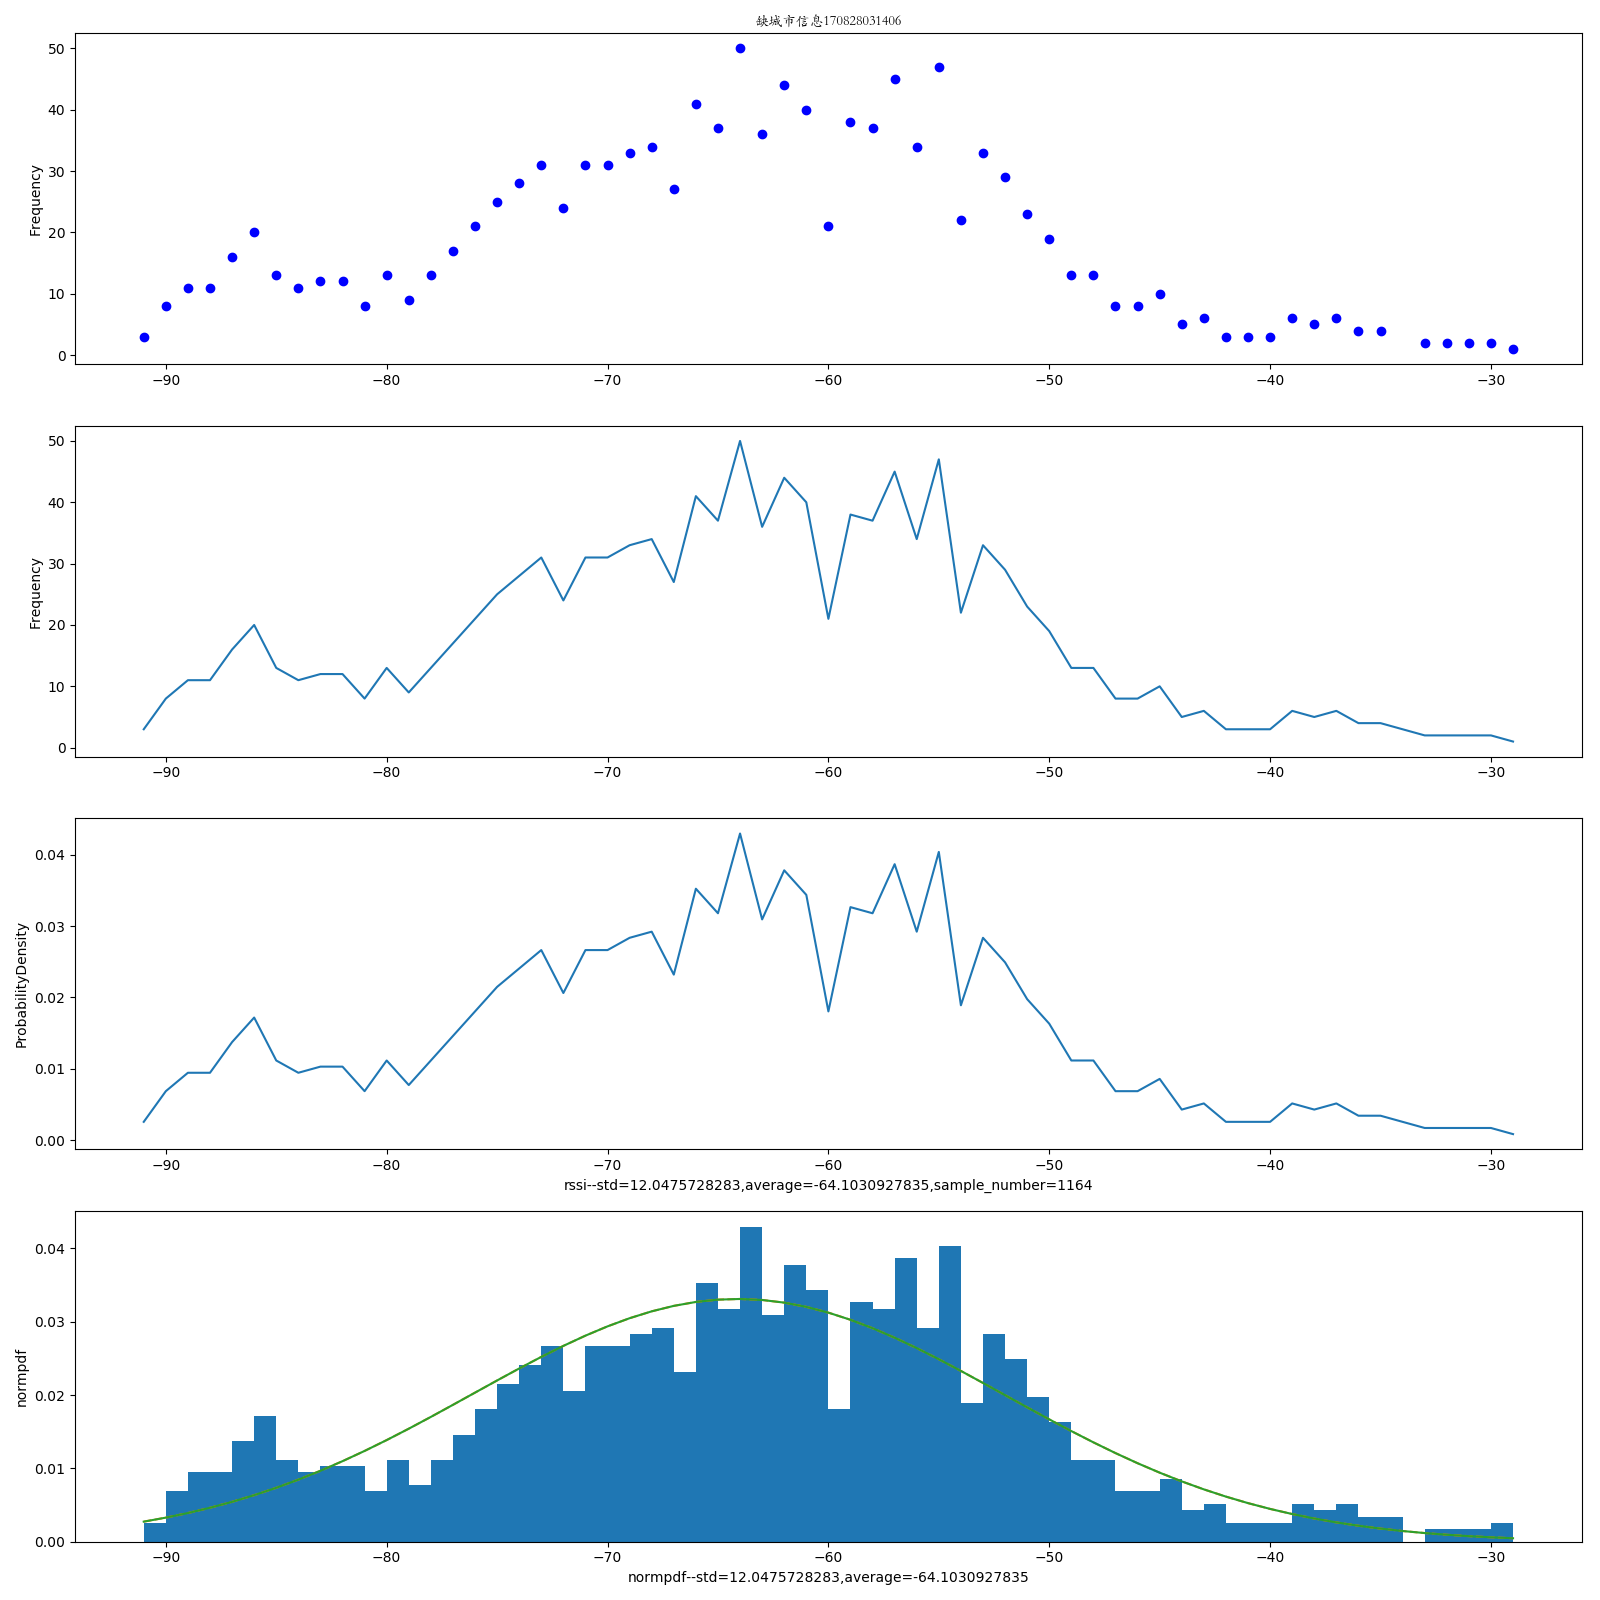
【基于rssi室内定位报告】rssi分布情况标识位置


import matplotlib
matplotlib.use('Agg')
import numpy as np
from numpy import array
from matplotlib import pyplot
from scipy import integrate
import math
import time
from sys import path
path.append('D:\pymine\clean\Gauss_rssi_model\import_function')
from draw import *
import matplotlib.mlab as mlab
zhfont1 = matplotlib.font_manager.FontProperties(fname='C:\Windows\Fonts\STKAITI.TTF')
import sqlite3
from openpyxl import Workbook
print('ing')
def gen_rssi_model(rssi_list):
x_list = sorted(list(set(rssi_list)))
frequency_first_count, frequency_first_value, frequency_first_index, frequency_first_value_frequency, frequency_second_count, frequency_second_value, frequency_second_index, frequency_second_value_frequency = 0, 0, 0, 0, 0, 0, 0, 0
rssi_list_len = len(rssi_list)
for i in x_list:
i_value, i_count, i_index = i, rssi_list.count(i), x_list.index(i)
if i_count > frequency_first_count:
frequency_first_value, frequency_first_count, frequency_first_index, frequency_first_value_frequency = i_value, i_count, i_index, i_count / rssi_list_len
if i_count < frequency_first_count and i_count > frequency_second_count:
frequency_second_value, frequency_second_count, frequency_second_index, frequency_second_value_frequency = i_value, i_count, i_index, i_count / rssi_list_len
res_dic, gauss_rssi_model_type = {}, 1
tmp_max, tmp_min = max(frequency_first_index, frequency_second_index), min(frequency_first_index,
frequency_second_index)
frequency_first_second_middle_value, frequency_first_second_middle_count, frequency_first_second_middle_index = \
x_list[tmp_min + 1], rssi_list.count((x_list[tmp_min + 1])), tmp_min + 1
len_ = len(x_list)
for i in range(0, len_, 1):
if i <= tmp_min or i >= tmp_max:
continue
i_value = x_list[i]
i_count = rssi_list.count(i_value)
i_index = i
if i_count < frequency_first_second_middle_count:
frequency_first_second_middle_value, frequency_first_second_middle_count, frequency_first_second_middle_index = i_value, i_count, i_index
if frequency_first_second_middle_value > (frequency_first_value + frequency_second_value) * 0.5:
gauss_rssi_model_type = 2
res_dic['gauss_rssi_model_type'], res_dic['frequency_first_value'], res_dic['frequency_first_count'], res_dic[
'frequency_first_index'], res_dic['frequency_second_value'], res_dic['frequency_second_count'], res_dic[
'frequency_second_index'], res_dic['frequency_first_second_middle_value'], res_dic[
'frequency_first_second_middle_count'], res_dic[
'frequency_first_second_middle_index'] = gauss_rssi_model_type, frequency_first_value, frequency_first_count, frequency_first_index, frequency_second_value, frequency_second_count, frequency_second_index, frequency_first_second_middle_value, frequency_first_second_middle_count, frequency_first_second_middle_index
return res_dic
def pdf_Normal_distribution_integrate(average_, standard_deviation, x1, x2):
f = lambda x: (np.exp(-(x - average_) ** 2 / (2 * standard_deviation ** 2))) / (
np.sqrt(2 * np.pi)) / standard_deviation
# return integrate.quad(f, x1, x2)
# TODO MODIFY try to be more precise
# return integrate.quad(f, -np.inf, x1)[0] - integrate.quad(f, -np.inf, x2)[0]
return integrate.quad(f, -np.inf, x2)[0] - integrate.quad(f, -np.inf, x1)[0]
# TODO DEL
# mlab.normpdf(len_, np_average, np_std)
def pdf_Normal_distribution_integrate_2_linear_combination(average0, standard_deviation0, average1, standard_deviation1,
x1, x2, weight0=0.5, weight1=0.5):
p0, p1 = pdf_Normal_distribution_integrate(average0, standard_deviation0, x1,
x2), pdf_Normal_distribution_integrate(average1, standard_deviation1, x1,
x2)
return weight0 * p0 + weight1 * p1
def get_list_quartern_1_3(l):
quartern_index_1 = math.ceil(len(l) / 4)
quartern_value_1 = l[quartern_index_1]
quartern_index_3 = quartern_index_1 * 3
quartern_value_3 = l[quartern_index_3]
dic_ = {}
dic_['quartern_index_1'] = quartern_index_1
dic_['quartern_value_1'] = quartern_value_1
dic_['quartern_index_3'] = quartern_index_3
dic_['quartern_value_3'] = quartern_value_3
return dic_
def draw_frequency_hist(l_, title_, xlabel='rssi', dir_='./savefig/'):
rssi_list = l_
np_std = np.std(rssi_list)
np_average = np.average(rssi_list)
data_ = array(l_)
pyplot.hist(data_, 300)
xlabel = '%s--std=%s,average=%s,sample_number=%s' % (xlabel, np_std, np_average, len(rssi_list))
pyplot.xlabel(xlabel)
pyplot.ylabel('Frequency')
localtime_ = time.strftime("%y%m%d%H%M%S", time.localtime())
title_ = '%s%s' % (title_, localtime_)
pyplot.title(title_, fontproperties=zhfont1)
dir_ = '%s%s' % (dir_, title_)
pyplot.savefig(dir_)
pyplot.close()
def draw_probability_density(rssi_list, title_, xlabel='rssi', dir_='./savefig/'):
np_std = np.std(rssi_list)
np_average = np.average(rssi_list)
x_list = sorted(list(set(rssi_list)))
len_ = len(rssi_list)
loop_ = len(x_list)
x, y = [], []
for i in range(0, loop_, 1):
val = x_list[i]
probability_density = rssi_list.count(val) / len_
x.append(val)
y.append(probability_density)
pyplot.plot(x, y)
xlabel = '%s--std=%s,average=%s,sample_number=%s' % (xlabel, np_std, np_average, len(rssi_list))
pyplot.xlabel(xlabel)
pyplot.ylabel('ProbabilityDensity')
localtime_ = time.strftime("%y%m%d%H%M%S", time.localtime())
title_ = '%s%s' % (title_, localtime_)
pyplot.title(title_, fontproperties=zhfont1)
dir_ = '%s%s' % (dir_, title_)
pyplot.savefig(dir_)
pyplot.close()
def from_db_to_res(db, sql, odd_even=0):
conn = sqlite3.connect(db)
cursor = conn.execute(sql)
res_dic, counter_ = {}, 0
for row in cursor:
counter_ += 1
if counter_ % 2 == odd_even:
continue
db_id, gather_point, mac, rssi, timestamp = row
gather_point = gather_point.replace('\n', '')
if gather_point not in res_dic:
res_dic[gather_point] = {}
res_dic[gather_point]['rssi_list'] = []
res_dic[gather_point]['rssi_list'].append(rssi)
for gather_point in res_dic:
rssi_list = sorted(res_dic[gather_point]['rssi_list'])
np_std = np.std(rssi_list)
np_average = np.average(rssi_list)
res_dic[gather_point]['rssi_list_np_std'] = np_std
res_dic[gather_point]['rssi_list_np_average'] = np_average
rssi_model = gen_rssi_model(rssi_list)
res_dic[gather_point]['rssi_model'] = rssi_model
list_quartern_1_3_dic = get_list_quartern_1_3(rssi_list)
res_dic[gather_point]['quartern_index_1'], res_dic[gather_point]['quartern_value_1'], res_dic[gather_point][
'quartern_index_3'], res_dic[gather_point]['quartern_value_3'] = \
list_quartern_1_3_dic['quartern_index_1'], list_quartern_1_3_dic['quartern_value_1'], list_quartern_1_3_dic[
'quartern_index_3'], list_quartern_1_3_dic['quartern_value_3']
return res_dic
db, sql = 'wifi_Tom_0814.db', 'SELECT * FROM wifi'
Tom_home_dic_even = from_db_to_res(db, sql)
Tom_home_dic_odd = from_db_to_res(db, sql, 1)
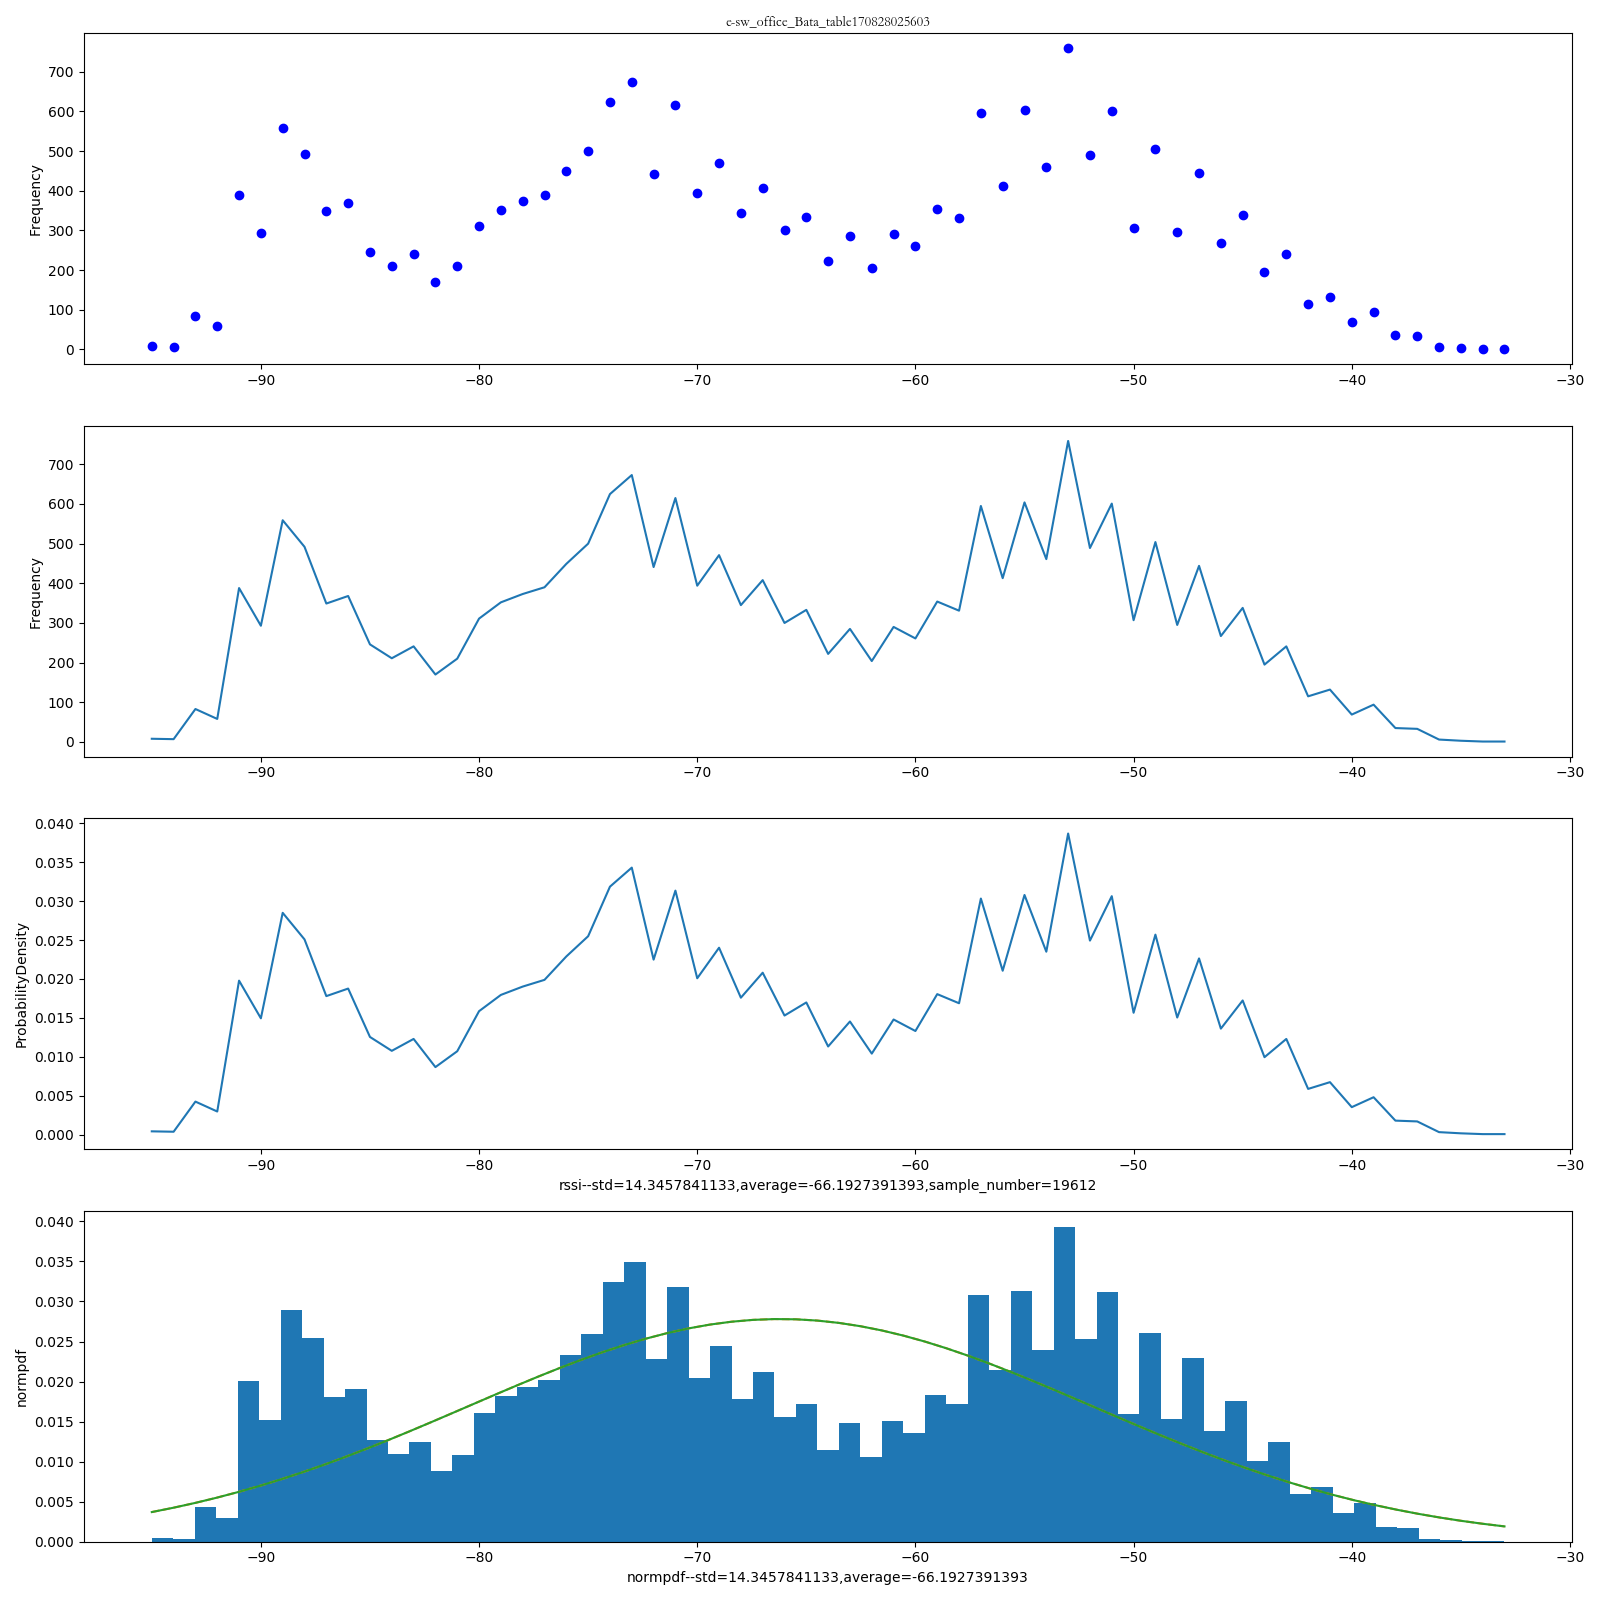
db, sql = 'wifi_beta_office_0812am.db', 'SELECT * FROM wifi WHERE belongpoint IN ("sw_office_Bata_table") '
Beta_table_dic_even = from_db_to_res(db, sql)
Beta_table_dic_odd = from_db_to_res(db, sql, 1)
k = 'sw_office_Bata_table'
rssi_list = Beta_table_dic_odd[k]['rssi_list']
title_ = '%s%s' % ('o-', k)
draw_frequency_hist_probability_density(rssi_list, title_, xlabel='rssi', dir_='./savefig/')
k = 'sw_office_Bata_table'
rssi_list = Beta_table_dic_even[k]['rssi_list']
title_ = '%s%s' % ('e-', k)
draw_frequency_hist_probability_density(rssi_list, title_, xlabel='rssi', dir_='./savefig/')
k = '下沙88栋'
rssi_list = Tom_home_dic_odd[k]['rssi_list']
title_ = '%s%s' % ('o-', k)
draw_frequency_hist_probability_density(rssi_list, title_, xlabel='rssi', dir_='./savefig/')
k = '下沙88栋'
rssi_list = Tom_home_dic_even[k]['rssi_list']
title_ = '%s%s' % ('e-', k)
draw_frequency_hist_probability_density(rssi_list, title_, xlabel='rssi', dir_='./savefig/')
report_dic = {}
def compute_relative_integrate(dic_, dic_x, type_, direction_='Tom_Beta'):
global report_dic
if direction_ not in report_dic:
report_dic[direction_] = {}
report_dic[direction_][type_] = {}
report_dic[direction_][type_]['simple_dic'] = {}
if direction_ == 'Tom_Beta':
dic_, dic_x = dic_['下沙88栋'], dic_x['sw_office_Bata_table']
elif direction_ == 'Tom_Tom':
dic_, dic_x = dic_['下沙88栋'], dic_x['下沙88栋']
elif direction_ == 'Beta_Tom':
dic_, dic_x = dic_['sw_office_Bata_table'], dic_x['下沙88栋']
elif direction_ == 'Beta_Beta':
dic_, dic_x = dic_['sw_office_Bata_table'], dic_x['sw_office_Bata_table']
average_, standard_deviation, x1, x2 = dic_['rssi_list_np_average'], dic_['rssi_list_np_std'], dic_x[
'quartern_value_1'], dic_x['quartern_value_3']
res = pdf_Normal_distribution_integrate(average_, standard_deviation, x1, x2)
simple_dic = {}
simple_dic['integrand'], simple_dic['to'], simple_dic['res'] = dic_, dic_x, res
report_dic[direction_][type_]['simple_dic'] = simple_dic
return res
# TODO MODIFY
dic_, dic_x = Tom_home_dic_even, Beta_table_dic_even
Tom_e_Beta_e_pdf_integrate = compute_relative_integrate(dic_, dic_x, 'e_e')
dic_, dic_x = Tom_home_dic_even, Beta_table_dic_odd
Tom_e_Beta_o_pdf_integrate = compute_relative_integrate(dic_, dic_x, 'e_o')
dic_, dic_x = Tom_home_dic_odd, Beta_table_dic_even
Tom_o_Beta_e_pdf_integrate = compute_relative_integrate(dic_, dic_x, 'o_e')
dic_, dic_x = Tom_home_dic_odd, Beta_table_dic_odd
Tom_o_Beta_o_pdf_integrate = compute_relative_integrate(dic_, dic_x, 'o_o')
dic_, dic_x = Tom_home_dic_odd, Tom_home_dic_odd
Tom_o_Tom_o_pdf_integrate = compute_relative_integrate(dic_, dic_x, 'o_o', 'Tom_Tom')
dic_, dic_x = Tom_home_dic_odd, Tom_home_dic_even
Tom_o_Tom_e_pdf_integrate = compute_relative_integrate(dic_, dic_x, 'o_e', 'Tom_Tom')
dic_, dic_x = Tom_home_dic_even, Tom_home_dic_even
Tom_e_Tom_e_pdf_integrate = compute_relative_integrate(dic_, dic_x, 'e_e', 'Tom_Tom')
dic_, dic_x = Tom_home_dic_even, Tom_home_dic_odd
Tom_e_Tom_o_pdf_integrate = compute_relative_integrate(dic_, dic_x, 'e_o', 'Tom_Tom')
dic_, dic_x = Beta_table_dic_even, Tom_home_dic_even
Beta_e_Tom_e_pdf_integrate = compute_relative_integrate(dic_, dic_x, 'e_e', 'Beta_Tom')
dic_, dic_x = Beta_table_dic_even, Tom_home_dic_odd
Beta_e_Tom_o_pdf_integrate = compute_relative_integrate(dic_, dic_x, 'e_o', 'Beta_Tom')
dic_, dic_x = Beta_table_dic_odd, Tom_home_dic_even
Beta_o_Tom_e_pdf_integrate = compute_relative_integrate(dic_, dic_x, 'o_e', 'Beta_Tom')
dic_, dic_x = Beta_table_dic_odd, Tom_home_dic_odd
Beta_o_Tom_o_pdf_integrate = compute_relative_integrate(dic_, dic_x, 'o_o', 'Beta_Tom')
dic_, dic_x = Beta_table_dic_odd, Beta_table_dic_odd
Beta_o_Beta_o_pdf_integrate = compute_relative_integrate(dic_, dic_x, 'o_o', 'Beta_Beta')
dic_, dic_x = Beta_table_dic_odd, Beta_table_dic_even
Beta_o_Beta_e_pdf_integrate = compute_relative_integrate(dic_, dic_x, 'o_e', 'Beta_Beta')
dic_, dic_x = Beta_table_dic_even, Beta_table_dic_even
Beta_e_Beta_e_pdf_integrate = compute_relative_integrate(dic_, dic_x, 'e_e', 'Beta_Beta')
dic_, dic_x = Beta_table_dic_even, Beta_table_dic_odd
Beta_e_Beta_o_pdf_integrate = compute_relative_integrate(dic_, dic_x, 'e_o', 'Beta_Beta')
for direction_ in report_dic:
for type_ in report_dic[direction_]:
ll = []
simple_dic = report_dic[direction_][type_]['simple_dic']
to_dic, integrand_dic = simple_dic['to'], simple_dic['integrand']
to_quartern_index_1, to_quartern_index_3, to_quartern_value_1, to_quartern_value_3, to_rssi_list_np_average, to_rssi_list_np_std = \
to_dic['quartern_index_1'], to_dic['quartern_index_3'], to_dic['quartern_value_1'], to_dic[
'quartern_value_3'], \
to_dic['rssi_list_np_average'], to_dic['rssi_list_np_std']
integrand_quartern_index_1, integrand_quartern_index_3, integrand_quartern_value_1, integrand_quartern_value_3, integrand_rssi_list_np_average, integrand_rssi_list_np_std = \
integrand_dic['quartern_index_1'], integrand_dic['quartern_index_3'], integrand_dic['quartern_value_1'], \
integrand_dic['quartern_value_3'], integrand_dic['rssi_list_np_average'], integrand_dic['rssi_list_np_std']
to_rssi_model, integrand_rssi_model = to_dic['rssi_model'], integrand_dic['rssi_model']
to_gauss_rssi_model_type, to_frequency_first_value, to_frequency_first_count, to_frequency_first_index, to_frequency_second_value, to_frequency_second_count, to_frequency_second_index, to_frequency_first_second_middle_value, to_frequency_first_second_middle_count, to_frequency_first_second_middle_index = \
to_rssi_model['gauss_rssi_model_type'], to_rssi_model['frequency_first_value'], \
to_rssi_model['frequency_first_count'], to_rssi_model['frequency_first_index'], \
to_rssi_model['frequency_second_value'], to_rssi_model['frequency_second_count'], \
to_rssi_model['frequency_second_index'], to_rssi_model['frequency_first_second_middle_value'], \
to_rssi_model['frequency_first_second_middle_count'], to_rssi_model[
'frequency_first_second_middle_index']
integrand_gauss_rssi_model_type, integrand_frequency_first_value, integrand_frequency_first_count, integrand_frequency_first_index, integrand_frequency_second_value, integrand_frequency_second_count, integrand_frequency_second_index, integrand_frequency_first_second_middle_value, integrand_frequency_first_second_middle_count, integrand_frequency_first_second_middle_index = \
integrand_rssi_model['gauss_rssi_model_type'], integrand_rssi_model['frequency_first_value'], \
integrand_rssi_model['frequency_first_count'], integrand_rssi_model['frequency_first_index'], \
integrand_rssi_model['frequency_second_value'], integrand_rssi_model['frequency_second_count'], \
integrand_rssi_model['frequency_second_index'], integrand_rssi_model['frequency_first_second_middle_value'], \
integrand_rssi_model['frequency_first_second_middle_count'], integrand_rssi_model[
'frequency_first_second_middle_index']
res_single = pdf_Normal_distribution_integrate(integrand_rssi_list_np_average, integrand_rssi_list_np_std,
to_quartern_value_1, to_quartern_value_3)
# 双峰模型:假设两个“子分布”均为正太分布且离散程度相同均等于全量数据的方差
res_double = pdf_Normal_distribution_integrate_2_linear_combination(integrand_frequency_first_value,
integrand_rssi_list_np_std,
integrand_frequency_second_value,
integrand_rssi_list_np_std,
to_quartern_value_1, to_quartern_value_3)
report_dic[direction_][type_]['simple_dic']['res_single'], report_dic[direction_][type_]['simple_dic'][
'res_double'] = res_single, res_double
dd = 8
# wb = Workbook()
# worksheet = wb.active
# title_ = 'direction_, type_, res_single, res_double, to_rssi_list_np_average, to_rssi_list_np_std, to_quartern_index_1, to_quartern_value_1, to_quartern_index_3, to_quartern_value_3, to_gauss_rssi_model_type, to_frequency_first_value, to_frequency_first_count, to_frequency_first_index, to_frequency_second_value, to_frequency_second_count, to_frequency_second_index, to_frequency_first_second_middle_value, to_frequency_first_second_middle_count, to_frequency_first_second_middle_index, integrand_rssi_list_np_average, integrand_rssi_list_np_std,integrand_quartern_index_1, integrand_quartern_value_1, integrand_quartern_index_3,integrand_quartern_value_3,integrand_gauss_rssi_model_type, integrand_frequency_first_value, integrand_frequency_first_count, integrand_frequency_first_index, integrand_frequency_second_value, integrand_frequency_second_count, integrand_frequency_second_index, integrand_frequency_first_second_middle_value, integrand_frequency_first_second_middle_count, integrand_frequency_first_second_middle_index'
# title_l = title_.replace(' ', '').split(',')
# worksheet.append(title_l)
# for direction_ in report_dic:
# for type_ in report_dic[direction_]:
# ll = []
# simple_dic = report_dic[direction_][type_]['simple_dic']
# to_dic, integrand_dic = simple_dic['to'], simple_dic['integrand']
# to_quartern_index_1, to_quartern_index_3, to_quartern_value_1, to_quartern_value_3, to_rssi_list_np_average, to_rssi_list_np_std = \
# to_dic['quartern_index_1'], to_dic['quartern_index_3'], to_dic['quartern_value_1'], to_dic[
# 'quartern_value_3'], \
# to_dic['rssi_list_np_average'], to_dic['rssi_list_np_std']
# integrand_quartern_index_1, integrand_quartern_index_3, integrand_quartern_value_1, integrand_quartern_value_3, integrand_rssi_list_np_average, integrand_rssi_list_np_std = \
# integrand_dic['quartern_index_1'], integrand_dic['quartern_index_3'], integrand_dic['quartern_value_1'], \
# integrand_dic['quartern_value_3'], integrand_dic['rssi_list_np_average'], integrand_dic['rssi_list_np_std']
# to_rssi_model, integrand_rssi_model = to_dic['rssi_model'], integrand_dic['rssi_model']
#
# to_gauss_rssi_model_type, to_frequency_first_value, to_frequency_first_count, to_frequency_first_index, to_frequency_second_value, to_frequency_second_count, to_frequency_second_index, to_frequency_first_second_middle_value, to_frequency_first_second_middle_count, to_frequency_first_second_middle_index = \
# to_rssi_model['gauss_rssi_model_type'], to_rssi_model['frequency_first_value'], \
# to_rssi_model['frequency_first_count'], to_rssi_model['frequency_first_index'], \
# to_rssi_model['frequency_second_value'], to_rssi_model['frequency_second_count'], \
# to_rssi_model['frequency_second_index'], to_rssi_model['frequency_first_second_middle_value'], \
# to_rssi_model['frequency_first_second_middle_count'], to_rssi_model[
# 'frequency_first_second_middle_index']
#
# integrand_gauss_rssi_model_type, integrand_frequency_first_value, integrand_frequency_first_count, integrand_frequency_first_index, integrand_frequency_second_value, integrand_frequency_second_count, integrand_frequency_second_index, integrand_frequency_first_second_middle_value, integrand_frequency_first_second_middle_count, integrand_frequency_first_second_middle_index = \
# integrand_rssi_model['gauss_rssi_model_type'], integrand_rssi_model['frequency_first_value'], \
# integrand_rssi_model['frequency_first_count'], integrand_rssi_model['frequency_first_index'], \
# integrand_rssi_model['frequency_second_value'], integrand_rssi_model['frequency_second_count'], \
# integrand_rssi_model['frequency_second_index'], integrand_rssi_model['frequency_first_second_middle_value'], \
# integrand_rssi_model['frequency_first_second_middle_count'], integrand_rssi_model[
# 'frequency_first_second_middle_index']
#
# res_single, res_double = report_dic[direction_][type_]['simple_dic']['res_single'], \
# report_dic[direction_][type_]['simple_dic']['res_double']
#
# ll = direction_, type_, res_single, res_double, to_rssi_list_np_average, to_rssi_list_np_std, to_quartern_index_1, to_quartern_value_1, to_quartern_index_3, to_quartern_value_3, to_gauss_rssi_model_type, to_frequency_first_value, to_frequency_first_count, to_frequency_first_index, to_frequency_second_value, to_frequency_second_count, to_frequency_second_index, to_frequency_first_second_middle_value, to_frequency_first_second_middle_count, to_frequency_first_second_middle_index, integrand_rssi_list_np_average, integrand_rssi_list_np_std, integrand_quartern_index_1, integrand_quartern_value_1, integrand_quartern_index_3, integrand_quartern_value_3, integrand_gauss_rssi_model_type, integrand_frequency_first_value, integrand_frequency_first_count, integrand_frequency_first_index, integrand_frequency_second_value, integrand_frequency_second_count, integrand_frequency_second_index, integrand_frequency_first_second_middle_value, integrand_frequency_first_second_middle_count, integrand_frequency_first_second_middle_index
# worksheet.append(ll)
# file_name = '自采集数据-单双峰-概率计算结果'
# localtime_ = time.strftime("%y%m%d%H%M%S", time.localtime())
# file_name_save = '%s%s%s' % (file_name, localtime_, '.xlsx')
# wb.save(file_name_save)
#
# print('ok-finished', localtime_)
import matplotlib

matplotlib.use('Agg')

import numpy as np

from numpy import array

from matplotlib import pyplot

from scipy import integrate

import math

import time

import matplotlib.mlab as mlab

zhfont1 = matplotlib.font_manager.FontProperties(fname='C:\Windows\Fonts\STKAITI.TTF')

def draw_frequency_hist_probability_density(rssi_list, title_, xlabel='rssi', dir_='./savefig/'):

    np_std = np.std(rssi_list)

    np_average = np.average(rssi_list)

    x_list = sorted(list(set(rssi_list)))

    len_ = len(rssi_list)

    loop_ = len(x_list)

    x, y1, y2 = [], [], []

    for i in range(0, loop_, 1):

        val = x_list[i]

        frequency, probability_density = rssi_list.count(val), rssi_list.count(val) / len_

        x.append(val)

        y1.append(frequency)

        y2.append(probability_density)

    fig, (ax1, ax2, ax3, ax4) = pyplot.subplots(4, 1)

    fig.set_size_inches(16, 16)

    ax1.set_ylabel('Frequency')

    localtime_ = time.strftime("%y%m%d%H%M%S", time.localtime())

    title_ = '%s%s' % (title_, localtime_)

    ax1.set_title(title_, fontproperties=zhfont1)

    ax2.set_ylabel('Frequency')

    xlabel_3 = '%s--std=%s,average=%s,sample_number=%s' % (xlabel, np_std, np_average, len(rssi_list))

    ax3.set_xlabel(xlabel_3)

    ax3.set_ylabel('ProbabilityDensity')

    ax1.plot(x, y1, 'bo')

    ax2.plot(x, y1)

    ax3.plot(x, y2)

    # Tweak spacing to prevent clipping of ylabel

    sigma = np.std(rssi_list)

    mu = np.average(rssi_list)

    x = array(rssi_list)

    # num_bins = 100

    # n, bins, patches = ax4.hist(x, num_bins, normed=1)

    num_bins = len(x_list)

    n, bins, patches = ax4.hist(x, num_bins, normed=1)

    # n, bins, patches = ax4.hist(x, normed=1)

    # add a 'best fit' line

    y = mlab.normpdf(bins, mu, sigma)

    ax4.plot(bins, y, '--')

    xlabel_4 = '%s--std=%s,average=%s' % ('normpdf', np_std, np_average)

    ax4.set_xlabel(xlabel_4)

    ylabel_4 = 'normpdf'

    ax4.set_ylabel(ylabel_4)

    # str_= '%s: $\mu=$s, $\sigma=$s$' % ('te')

    # ax4.set_title(str_)

    ax4.plot(bins, y)

    fig.tight_layout()

    # pyplot.plot()

    dir_ = '%s%s' % (dir_, title_)

    pyplot.show()

    pyplot.savefig(dir_)

    pyplot.close()
【基于rssi室内定位报告】rssi分布情况标识位置的更多相关文章
- 室内定位系列(一)——WiFi位置指纹(译)
原文:<Advanced Location-Based Technologies and Services>--chapter 2 WiFi Location Fingerprint 作者 ...
- 基于 WiFi ( Wireless Fidelity) 的室内定位技术
系统的拓扑结构 基于信号强度的定位技术(RSSI, Received Signal Strength Indication) 无线信号的信号强度随着传播距离的增加而衰减,接收方与发送方离得越近, 则接 ...
- 基于 H5 WebGL 的 3D 室内定位及电子围栏
前言 现代工业化的推进在极大加速现代化进程的同时也带来的相应的安全隐患,在传统的可视化监控领域,一般都是基于 Web SCADA 的前端技术来实现 2D 可视化监控,本系统采用 Hightopo 的 ...
- 【机器学习】WIFI室内定位
WIFI室内定位-指纹法 在A1区域内每个点上采集四个WiFi的信号数据(信号强度),五点.九点.十六点采样. 5*5=25区域*16数据=400样本,用来训练 样本数 R B G1 G2 1 2 ...
- 蓝牙Ibeacon室内定位和微信摇一摇周边原理分析
苹果推出Ibeacon室内定位技术是为了弥补GPS无法覆盖室内定位这种场景.苹果意味着创新,在其推动下,蓝牙Ibeacon得到了极大的应用.而腾讯则是利用蓝牙Ibeacon在场景体验方面进行了创新,实 ...
- 关于Wifi室内定位应用中的一些问题:
公司目前在办公室内布设了一套室内定位的实验环境,用的是华为路由器,采用的算法是基于信号强度的RSSI算法.公司目前希望能使用这套设备得到无线网络覆盖范围下的所有移动设备(对应每个人)的MAC地址,同时 ...
- iBeacon室内定位原理解析【转】
目前,技术发展持续火热,因着iBeacon的定位精度和造价都比较符合国内室内定位的市场需求,下面我们来聊一聊iBeacon室内定位原理. iBeacon定位原理 iBeacon是一项低耗能蓝牙技术,工 ...
- 解答室内定位技术新方向:蓝牙AoA定位,值得了解 ——概念了解
转载搜狐 室内定位一直被炒的非常火的黑科技,也是近年资本追逐的热点,市场上一直有众多宣称可以做到厘米级,米级精度定位的公司,但问题很多,无法大规模商用.近些年有很多人尝试使用蓝牙beacon方式做定位 ...
- 浅谈UWB(超宽带)室内定位技术(转载)
技术背景 随着无线通信技术的发展和数据处理能力的提高,基于位置的服务成为最有前途的互联网业务之一.无论移动在室内还是室外环境下,快速准确地获得移动终端的位置信息和提供位置服务的需求变得日益迫切.通信和 ...
随机推荐
- 完全分布式安装hadoop
以三个节点为例的服务器集群来安装和配置hadoop 以下是各服务器ip地址和对应所做的节点 192.168.61.128 master 192.168.61.129 slave1 192.168.61 ...
- PHP empty()函数说明---用了N遍了就是记不住
从表面上看,很容易误解empty()函数是判断字符串是否为空的函数,其实并不是,我也因此吃了很多亏. empty()函数是用来测试变量是否已经配置.若变量已存在.非空字符串或者非零,则返回 false ...
- 2017.3.31 spring mvc教程(四)全局的异常处理
学习的博客:http://elf8848.iteye.com/blog/875830/ 我项目中所用的版本:4.2.0.博客的时间比较早,11年的,学习的是Spring3 MVC.不知道版本上有没有变 ...
- liunx下安装第三方Python(PIP安装)
wget https://pypi.python.org/packages/source/p/pip/pip-6.0.8.tar.gz $ tar zvxf pip-6.0.8.tar.gz $ cd ...
- bat 同步windows系统时间
需要使用管理员权限运行 net start w32timew32tm /config /updatew32tm /resync /rediscovernet stop w32timepause
- vue 访问子组件示例 或者子元素
1.子组件 <base-input ref="usernameInput"></base-input> this.$refs.usernameInput 2 ...
- xml中处理特殊字符和转义字符
XML 中的特殊字符 > 和 开始标记 > 例如: 5 ]] 如何获得这些HTML内容呢? XmlDocument doc = new XmlDocument(); doc.Load(&q ...
- MySql 删除相同前缀的表名
SELECT CONCAT('drop table ', table_name, ';') FROM information_schema.tables WHERE table_name LIKE ' ...
- java ee xml 学习
该文章对j2ee的xml各种标签做了详细全面的说明 http://01121264-163-com.iteye.com/blog/1530063
- Socket协议通讯
Socket协议通讯 服务器端代码: using System; using System.Collections.Generic; using System.ComponentModel; us ...