Jmeter+ InfluxDB+Grafana安装配置
前置条件:
系统:windows
jmeter:5.1
InfluxDB安装
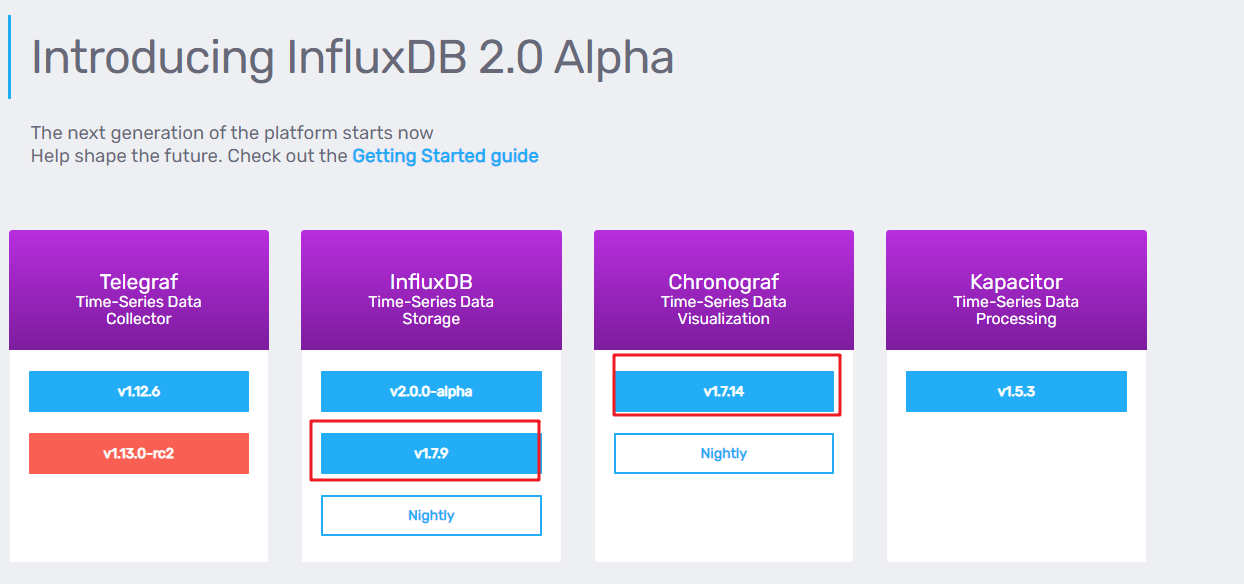
下载InfluxDB-v1.7.9和Chronograf-v1.7.14(InfluxDB的可视化web端)。
下载完成之后,解压到本地:如图
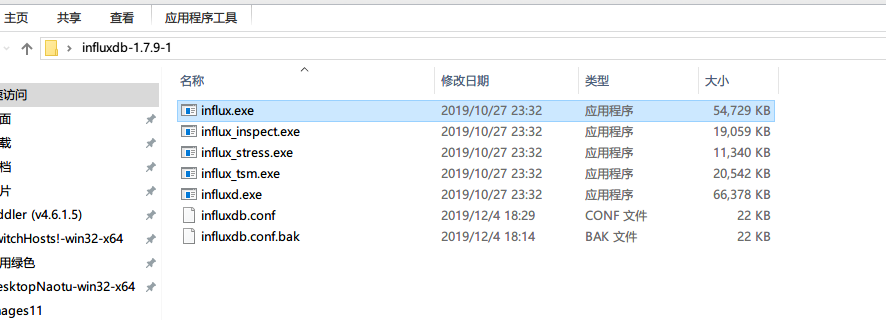
第一步:双击[influxd.exe],然后再双击[influx.exe]进入influx命令模式,使用show databases查看数据库信息,如图
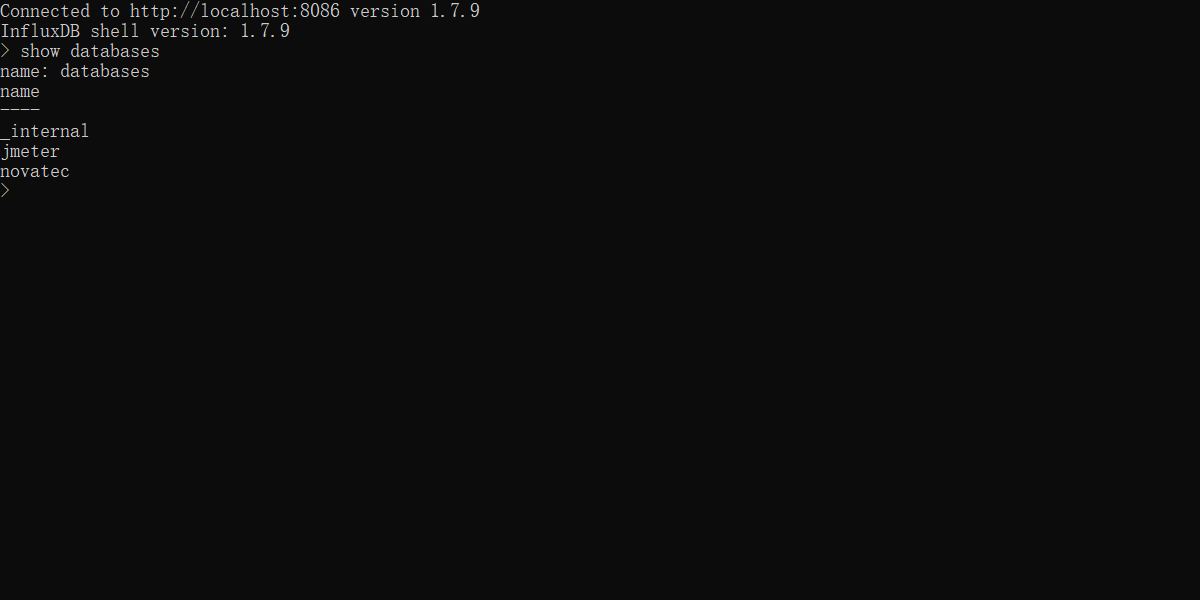
创建数据库:
CREATE DATABASE jmeter
CREATE DATABASE novatec
influxdb.conf修改的配置:
[[graphite]]

  # Determines whether the graphite endpoint is enabled.

  # enabled = false

  # database = "graphite"

  # retention-policy = ""

  # bind-address = ":2003"

  # protocol = "tcp"

  # consistency-level = "one"

  # 2019-12-04 修改graphite配置

  enabled = true

  database = "novatec"

  bind-address = ":2003"

  protocol = "tcp"

  consistency-level = "one"
Chronograf安装
下载好Chronograf安装,这里省略...
然后打开浏览器输入http://localhost:8888/可以查看本地influx数据库
Grafana安装配置
下载Grafana官网https://grafana.com/grafana/download下载需要的版本,这里使用的是windows版本
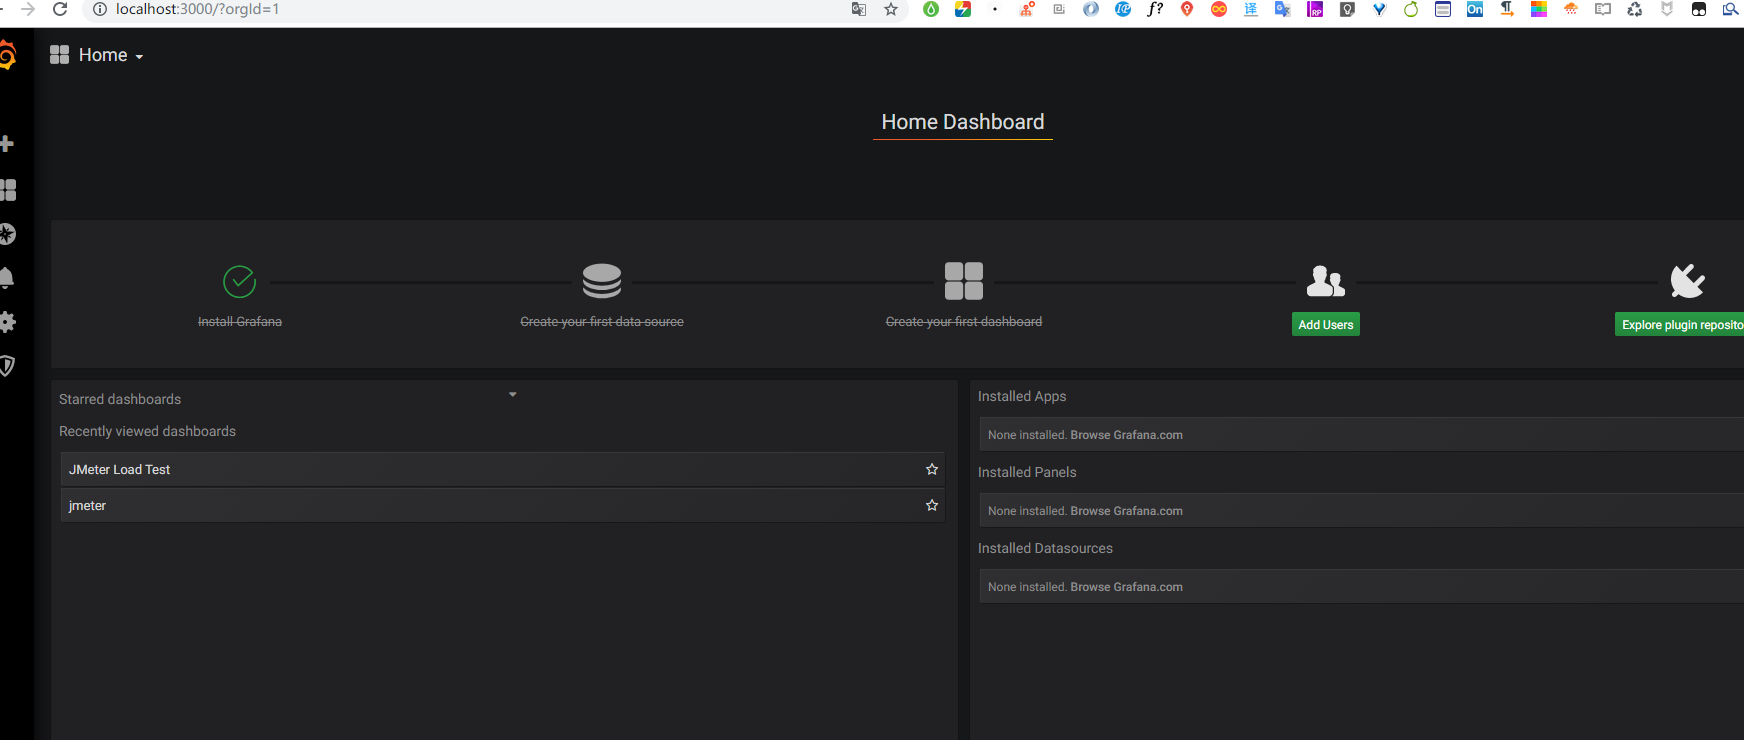
安装完成之后,打开浏览器http://localhost:3000/,如图,确认端口号没有被占用,打开grafana仪表板。使用admin的登录名和密码,界面如图
配置过程:
选择Add DataSource选项:
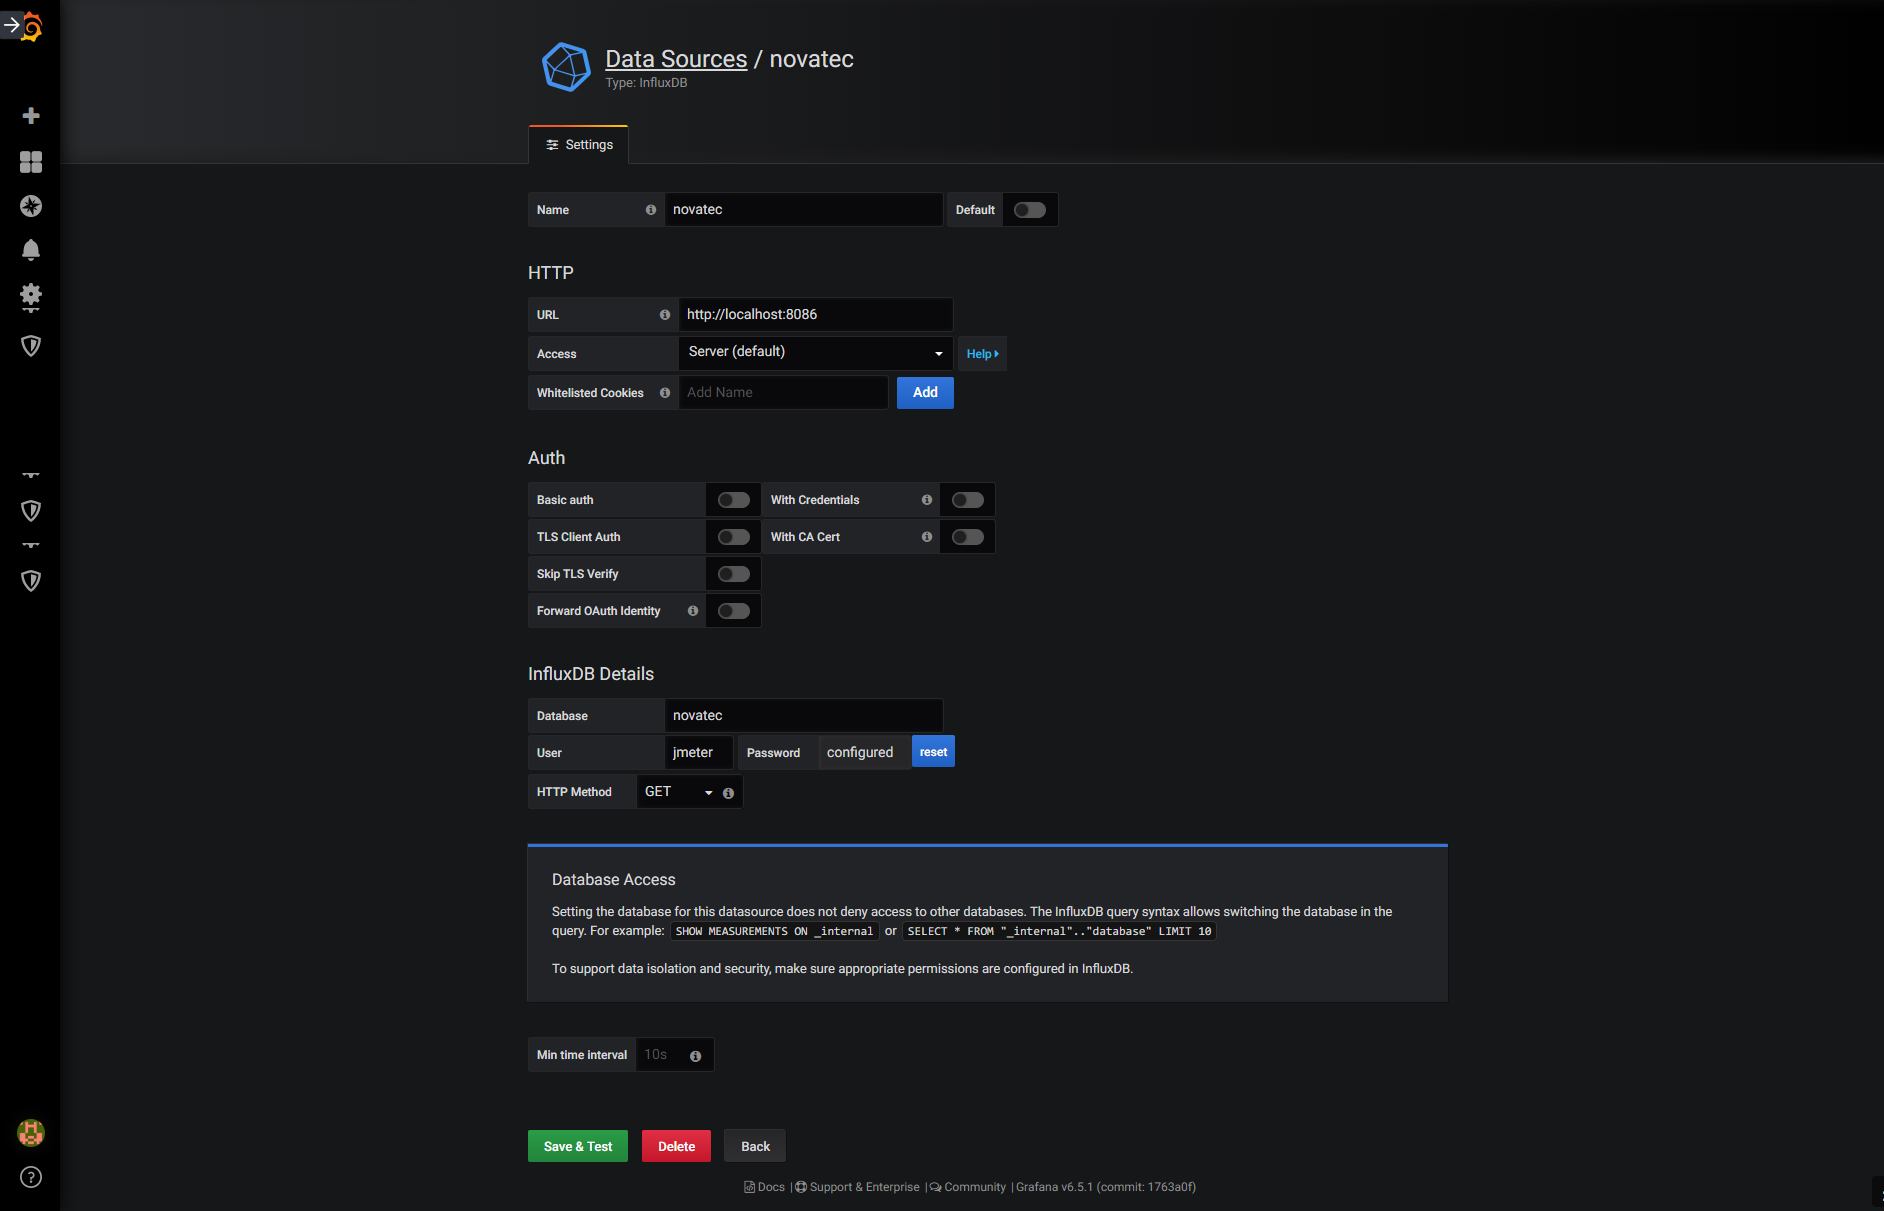
然后使用以下设置配置DataSource:
- 名称:Influxdb,任何名称都应该有用,
- 输入:InfluxDB,当我们连接到InfluxDB数据库时,
- 网址:
http://localhost:8086/, - 访问:,默认server,因为它直接连接到数据库,
- 数据库:novatec,以前创建的数据库。
- user:数据库的用户
- 密码:数据库的密码,这里为空
安装JMeter InfluxDB Writer
- 从JMeter InfluxDB Writer下载页面下载插件,
- 复制插件JMETER_HOME / lib / ext,
- 重启JMeter。
配置JMeter InfluxDB Writer
- 打开JMeter,然后打开示例JMX Script,
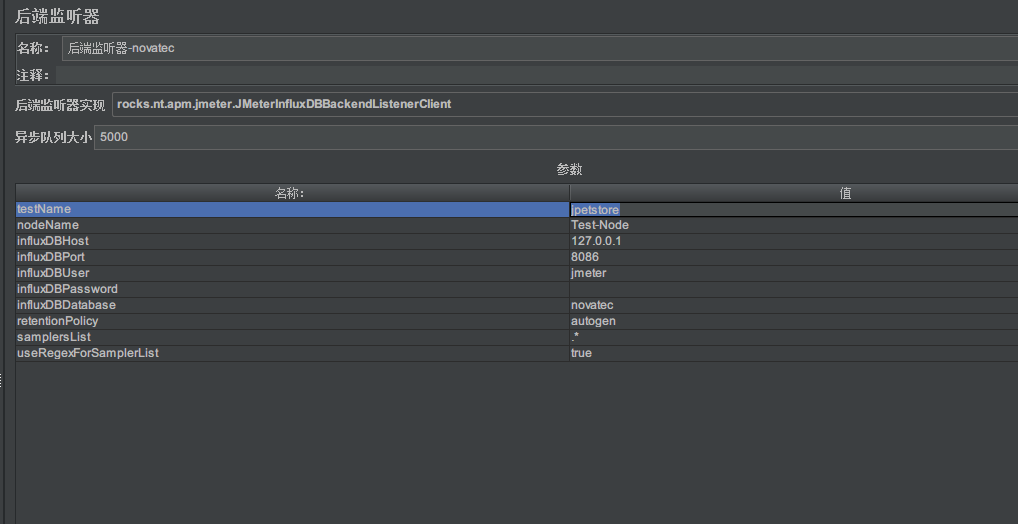
- 右键单击测试计划,然后选择Add> Listener> Backend Listener,
- 使用以下设置配置后端侦听器:
- testName:jpetstore,
- nodeName:测试节点,
- 流入数据库端口:8086,
- 潮流DBUser:jmeter,
- 流入数据库密码:无,
- InfluxDBDatabase:novatec。
让其他设置使用默认设置。如图
在Grafana创建新的Data-Source Novatec
- 创建映射到数据库的新数据源
novatec。
导入Novatec仪表板
请按照文档说明如何导入Grafana仪表板的详细信息。
- 打开Grafana,
- 选择导入新仪表板,
- 输入ID
1152,即Novatec仪表板的ID, - 选择指向
novatec数据库的数据源。
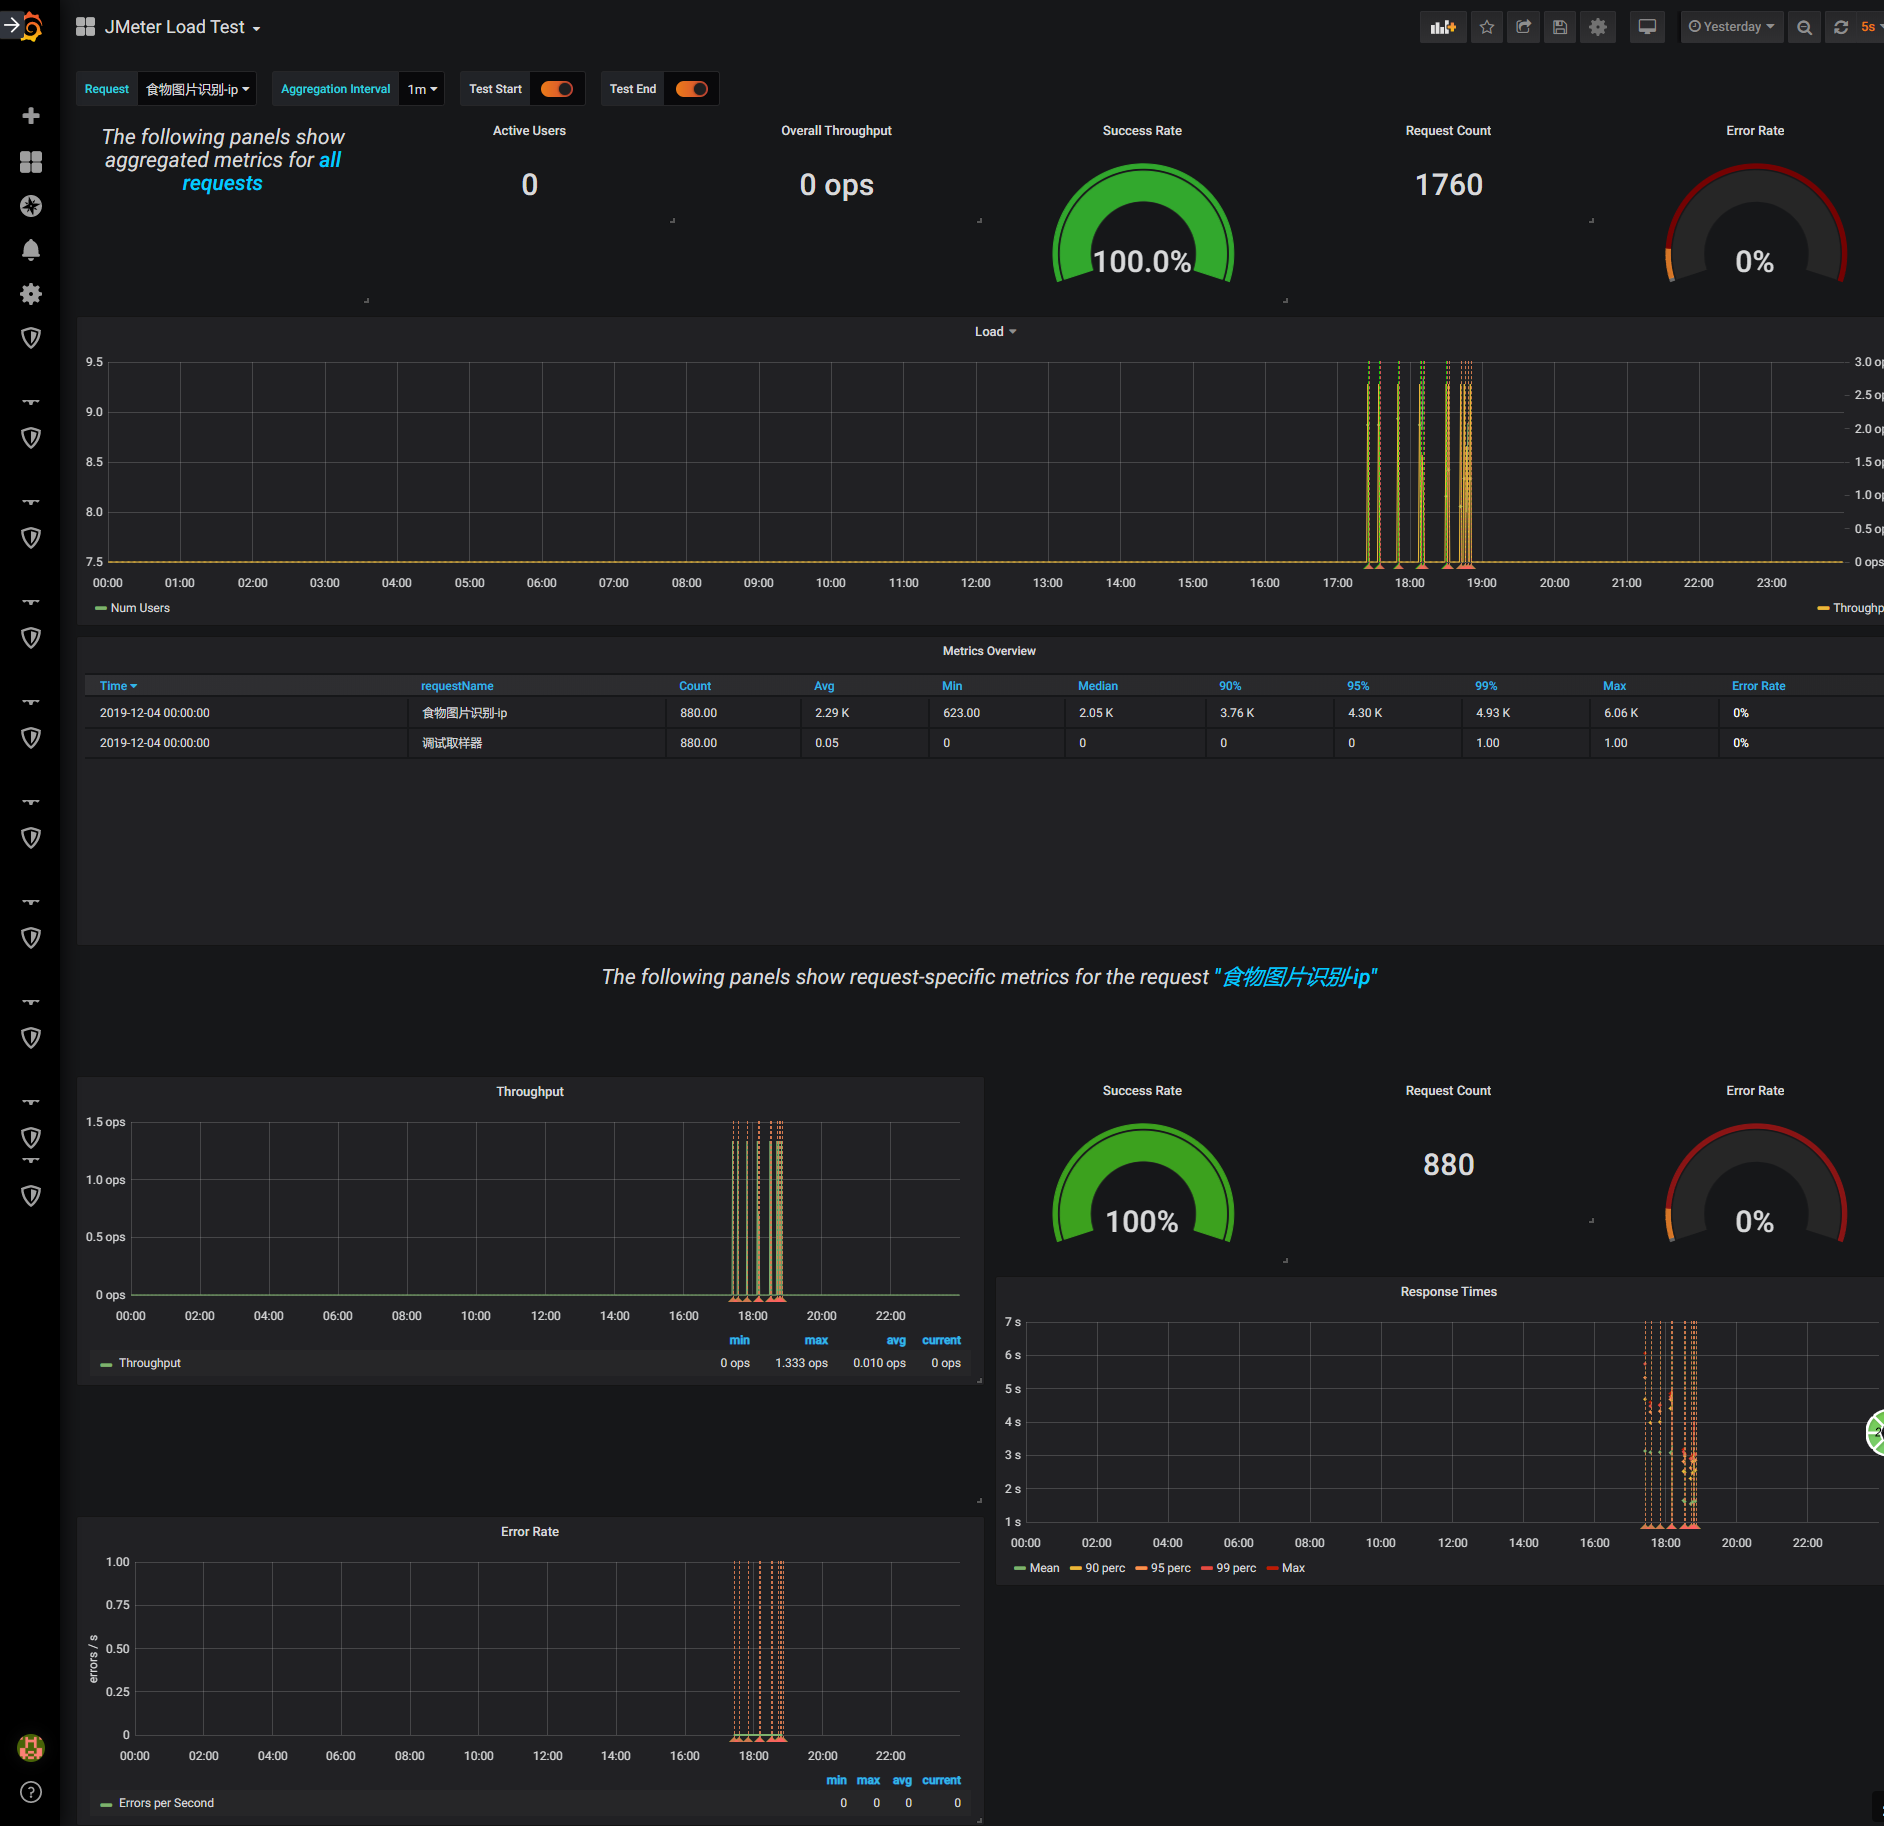
您应该能够在仪表板中看到动画图表。
参考博客:JMETER结果分析
附件:Influxdb.conf配置文件
### Welcome to the InfluxDB configuration file.

# The values in this file override the default values used by the system if

# a config option is not specified. The commented out lines are the configuration

# field and the default value used. Uncommenting a line and changing the value

# will change the value used at runtime when the process is restarted.

# Once every 24 hours InfluxDB will report usage data to usage.influxdata.com

# The data includes a random ID, os, arch, version, the number of series and other

# usage data. No data from user databases is ever transmitted.

# Change this option to true to disable reporting.

# reporting-disabled = false

# Bind address to use for the RPC service for backup and restore.

# bind-address = "127.0.0.1:8088"

###

### [meta]

###

### Controls the parameters for the Raft consensus group that stores metadata

### about the InfluxDB cluster.

###

[meta]

  # Where the metadata/raft database is stored

  dir = "D:/influxdb/meta"

  # Automatically create a default retention policy when creating a database.

  # retention-autocreate = true

  # If log messages are printed for the meta service

  logging-enabled = true

###

### [data]

###

### Controls where the actual shard data for InfluxDB lives and how it is

### flushed from the WAL. "dir" may need to be changed to a suitable place

### for your system, but the WAL settings are an advanced configuration. The

### defaults should work for most systems.

###

[data]

  # The directory where the TSM storage engine stores TSM files.

  dir = "D:/influxdb/data"

  # The directory where the TSM storage engine stores WAL files.

  wal-dir = "D:/influxdb/wal"

  # The amount of time that a write will wait before fsyncing.  A duration

  # greater than 0 can be used to batch up multiple fsync calls.  This is useful for slower

  # disks or when WAL write contention is seen.  A value of 0s fsyncs every write to the WAL.

  # Values in the range of 0-100ms are recommended for non-SSD disks.

  # wal-fsync-delay = "0s"

  # The type of shard index to use for new shards.  The default is an in-memory index that is

  # recreated at startup.  A value of "tsi1" will use a disk based index that supports higher

  # cardinality datasets.

  # index-version = "inmem"

  # Trace logging provides more verbose output around the tsm engine. Turning

  # this on can provide more useful output for debugging tsm engine issues.

  # trace-logging-enabled = false

  # Whether queries should be logged before execution. Very useful for troubleshooting, but will

  # log any sensitive data contained within a query.

  # query-log-enabled = true

  # Validates incoming writes to ensure keys only have valid unicode characters.

  # This setting will incur a small overhead because every key must be checked.

  # validate-keys = false

  # Settings for the TSM engine

  # CacheMaxMemorySize is the maximum size a shard's cache can

  # reach before it starts rejecting writes.

  # Valid size suffixes are k, m, or g (case insensitive, 1024 = 1k).

  # Values without a size suffix are in bytes.

  # cache-max-memory-size = "1g"

  # CacheSnapshotMemorySize is the size at which the engine will

  # snapshot the cache and write it to a TSM file, freeing up memory

  # Valid size suffixes are k, m, or g (case insensitive, 1024 = 1k).

  # Values without a size suffix are in bytes.

  # cache-snapshot-memory-size = "25m"

  # CacheSnapshotWriteColdDuration is the length of time at

  # which the engine will snapshot the cache and write it to

  # a new TSM file if the shard hasn't received writes or deletes

  # cache-snapshot-write-cold-duration = "10m"

  # CompactFullWriteColdDuration is the duration at which the engine

  # will compact all TSM files in a shard if it hasn't received a

  # write or delete

  # compact-full-write-cold-duration = "4h"

  # The maximum number of concurrent full and level compactions that can run at one time.  A

  # value of 0 results in 50% of runtime.GOMAXPROCS(0) used at runtime.  Any number greater

  # than 0 limits compactions to that value.  This setting does not apply

  # to cache snapshotting.

  # max-concurrent-compactions = 0

  # CompactThroughput is the rate limit in bytes per second that we

  # will allow TSM compactions to write to disk. Note that short bursts are allowed

  # to happen at a possibly larger value, set by CompactThroughputBurst

  # compact-throughput = "48m"

  # CompactThroughputBurst is the rate limit in bytes per second that we

  # will allow TSM compactions to write to disk.

  # compact-throughput-burst = "48m"

  # If true, then the mmap advise value MADV_WILLNEED will be provided to the kernel with respect to

  # TSM files. This setting has been found to be problematic on some kernels, and defaults to off.

  # It might help users who have slow disks in some cases.

  # tsm-use-madv-willneed = false

  # Settings for the inmem index

  # The maximum series allowed per database before writes are dropped.  This limit can prevent

  # high cardinality issues at the database level.  This limit can be disabled by setting it to

  # 0.

  # max-series-per-database = 1000000

  # The maximum number of tag values per tag that are allowed before writes are dropped.  This limit

  # can prevent high cardinality tag values from being written to a measurement.  This limit can be

  # disabled by setting it to 0.

  # max-values-per-tag = 100000

  # Settings for the tsi1 index

  # The threshold, in bytes, when an index write-ahead log file will compact

  # into an index file. Lower sizes will cause log files to be compacted more

  # quickly and result in lower heap usage at the expense of write throughput.

  # Higher sizes will be compacted less frequently, store more series in-memory,

  # and provide higher write throughput.

  # Valid size suffixes are k, m, or g (case insensitive, 1024 = 1k).

  # Values without a size suffix are in bytes.

  # max-index-log-file-size = "1m"

  # The size of the internal cache used in the TSI index to store previously

  # calculated series results. Cached results will be returned quickly from the cache rather

  # than needing to be recalculated when a subsequent query with a matching tag key/value

  # predicate is executed. Setting this value to 0 will disable the cache, which may

  # lead to query performance issues.

  # This value should only be increased if it is known that the set of regularly used

  # tag key/value predicates across all measurements for a database is larger than 100. An

  # increase in cache size may lead to an increase in heap usage.

  series-id-set-cache-size = 100

###

### [coordinator]

###

### Controls the clustering service configuration.

###

[coordinator]

  # The default time a write request will wait until a "timeout" error is returned to the caller.

  # write-timeout = "10s"

  # The maximum number of concurrent queries allowed to be executing at one time.  If a query is

  # executed and exceeds this limit, an error is returned to the caller.  This limit can be disabled

  # by setting it to 0.

  # max-concurrent-queries = 0

  # The maximum time a query will is allowed to execute before being killed by the system.  This limit

  # can help prevent run away queries.  Setting the value to 0 disables the limit.

  # query-timeout = "0s"

  # The time threshold when a query will be logged as a slow query.  This limit can be set to help

  # discover slow or resource intensive queries.  Setting the value to 0 disables the slow query logging.

  # log-queries-after = "0s"

  # The maximum number of points a SELECT can process.  A value of 0 will make

  # the maximum point count unlimited.  This will only be checked every second so queries will not

  # be aborted immediately when hitting the limit.

  # max-select-point = 0

  # The maximum number of series a SELECT can run.  A value of 0 will make the maximum series

  # count unlimited.

  # max-select-series = 0

  # The maximum number of group by time bucket a SELECT can create.  A value of zero will max the maximum

  # number of buckets unlimited.

  # max-select-buckets = 0

###

### [retention]

###

### Controls the enforcement of retention policies for evicting old data.

###

[retention]

  # Determines whether retention policy enforcement enabled.

  # enabled = true

  # The interval of time when retention policy enforcement checks run.

  # check-interval = "30m"

  check-interval = "30m"

###

### [shard-precreation]

###

### Controls the precreation of shards, so they are available before data arrives.

### Only shards that, after creation, will have both a start- and end-time in the

### future, will ever be created. Shards are never precreated that would be wholly

### or partially in the past.

[shard-precreation]

  # Determines whether shard pre-creation service is enabled.

  # enabled = true

  # The interval of time when the check to pre-create new shards runs.

  # check-interval = "10m"

  check-interval = "10m"

  # The default period ahead of the endtime of a shard group that its successor

  # group is created.

  # advance-period = "30m"

  advance-period = "30m"

###

### Controls the system self-monitoring, statistics and diagnostics.

###

### The internal database for monitoring data is created automatically if

### if it does not already exist. The target retention within this database

### is called 'monitor' and is also created with a retention period of 7 days

### and a replication factor of 1, if it does not exist. In all cases the

### this retention policy is configured as the default for the database.

[monitor]

  # Whether to record statistics internally.

  # store-enabled = true

  store-enabled = true

  # The destination database for recorded statistics

  # store-database = "_internal"

  store-database = "_internal"

  # The interval at which to record statistics

  # store-interval = "10s"

  store-interval = "10s"

###

### [http]

###

### Controls how the HTTP endpoints are configured. These are the primary

### mechanism for getting data into and out of InfluxDB.

###

[http]

  # Determines whether HTTP endpoint is enabled.

  # enabled = true

  enabled = true

  # Determines whether the Flux query endpoint is enabled.

  # flux-enabled = false

  # Determines whether the Flux query logging is enabled.

  # flux-log-enabled = false

  # The bind address used by the HTTP service.

  # bind-address = ":8086"

  bind-address = ":8086"

  # Determines whether user authentication is enabled over HTTP/HTTPS.

  # auth-enabled = false

  # The default realm sent back when issuing a basic auth challenge.

  # realm = "InfluxDB"

  # Determines whether HTTP request logging is enabled.

  # log-enabled = true

  # Determines whether the HTTP write request logs should be suppressed when the log is enabled.

  # suppress-write-log = false

  # When HTTP request logging is enabled, this option specifies the path where

  # log entries should be written. If unspecified, the default is to write to stderr, which

  # intermingles HTTP logs with internal InfluxDB logging.

  #

  # If influxd is unable to access the specified path, it will log an error and fall back to writing

  # the request log to stderr.

  # access-log-path = ""

  # Filters which requests should be logged. Each filter is of the pattern NNN, NNX, or NXX where N is

  # a number and X is a wildcard for any number. To filter all 5xx responses, use the string 5xx.

  # If multiple filters are used, then only one has to match. The default is to have no filters which

  # will cause every request to be printed.

  # access-log-status-filters = []

  # Determines whether detailed write logging is enabled.

  # write-tracing = false

  # Determines whether the pprof endpoint is enabled.  This endpoint is used for

  # troubleshooting and monitoring.

  # pprof-enabled = true

  # Enables authentication on pprof endpoints. Users will need admin permissions

  # to access the pprof endpoints when this setting is enabled. This setting has

  # no effect if either auth-enabled or pprof-enabled are set to false.

  # pprof-auth-enabled = false

  # Enables a pprof endpoint that binds to localhost:6060 immediately on startup.

  # This is only needed to debug startup issues.

  # debug-pprof-enabled = false

  # Enables authentication on the /ping, /metrics, and deprecated /status

  # endpoints. This setting has no effect if auth-enabled is set to false.

  # ping-auth-enabled = false

  # Determines whether HTTPS is enabled.

  # https-enabled = false

  # The SSL certificate to use when HTTPS is enabled.

  # https-certificate = "/etc/ssl/influxdb.pem"

  # Use a separate private key location.

  # https-private-key = ""

  # The JWT auth shared secret to validate requests using JSON web tokens.

  # shared-secret = ""

  # The default chunk size for result sets that should be chunked.

  # max-row-limit = 0

  # The maximum number of HTTP connections that may be open at once.  New connections that

  # would exceed this limit are dropped.  Setting this value to 0 disables the limit.

  # max-connection-limit = 0

  # Enable http service over unix domain socket

  # unix-socket-enabled = false

  # The path of the unix domain socket.

  # bind-socket = "/var/run/influxdb.sock"

  # The maximum size of a client request body, in bytes. Setting this value to 0 disables the limit.

  # max-body-size = 25000000

  # The maximum number of writes processed concurrently.

  # Setting this to 0 disables the limit.

  # max-concurrent-write-limit = 0

  # The maximum number of writes queued for processing.

  # Setting this to 0 disables the limit.

  # max-enqueued-write-limit = 0

  # The maximum duration for a write to wait in the queue to be processed.

  # Setting this to 0 or setting max-concurrent-write-limit to 0 disables the limit.

  # enqueued-write-timeout = 0

###

### [logging]

###

### Controls how the logger emits logs to the output.

###

[logging]

  # Determines which log encoder to use for logs. Available options

  # are auto, logfmt, and json. auto will use a more a more user-friendly

  # output format if the output terminal is a TTY, but the format is not as

  # easily machine-readable. When the output is a non-TTY, auto will use

  # logfmt.

  # format = "auto"

  # Determines which level of logs will be emitted. The available levels

  # are error, warn, info, and debug. Logs that are equal to or above the

  # specified level will be emitted.

  # level = "info"

  # Suppresses the logo output that is printed when the program is started.

  # The logo is always suppressed if STDOUT is not a TTY.

  # suppress-logo = false

###

### [subscriber]

###

### Controls the subscriptions, which can be used to fork a copy of all data

### received by the InfluxDB host.

###

[subscriber]

  # Determines whether the subscriber service is enabled.

  # enabled = true

  # The default timeout for HTTP writes to subscribers.

  # http-timeout = "30s"

  # Allows insecure HTTPS connections to subscribers.  This is useful when testing with self-

  # signed certificates.

  # insecure-skip-verify = false

  # The path to the PEM encoded CA certs file. If the empty string, the default system certs will be used

  # ca-certs = ""

  # The number of writer goroutines processing the write channel.

  # write-concurrency = 40

  # The number of in-flight writes buffered in the write channel.

  # write-buffer-size = 1000

###

### [[graphite]]

###

### Controls one or many listeners for Graphite data.

###

[[graphite]]

  # Determines whether the graphite endpoint is enabled.

  # enabled = false

  # database = "graphite"

  # retention-policy = ""

  # bind-address = ":2003"

  # protocol = "tcp"

  # consistency-level = "one"

  # 2019-12-04 修改graphite配置

  enabled = true

  database = "novatec"

  bind-address = ":2003"

  protocol = "tcp"

  consistency-level = "one"

  # These next lines control how batching works. You should have this enabled

  # otherwise you could get dropped metrics or poor performance. Batching

  # will buffer points in memory if you have many coming in.

  # Flush if this many points get buffered

  # batch-size = 5000

  # number of batches that may be pending in memory

  # batch-pending = 10

  # Flush at least this often even if we haven't hit buffer limit

  # batch-timeout = "1s"

  # UDP Read buffer size, 0 means OS default. UDP listener will fail if set above OS max.

  # udp-read-buffer = 0

  ### This string joins multiple matching 'measurement' values providing more control over the final measurement name.

  # separator = "."

  ### Default tags that will be added to all metrics.  These can be overridden at the template level

  ### or by tags extracted from metric

  # tags = ["region=us-east", "zone=1c"]

  ### Each template line requires a template pattern.  It can have an optional

  ### filter before the template and separated by spaces.  It can also have optional extra

  ### tags following the template.  Multiple tags should be separated by commas and no spaces

  ### similar to the line protocol format.  There can be only one default template.

  # templates = [

  #   "*.app env.service.resource.measurement",

  #   # Default template

  #   "server.*",

  # ]

###

### [collectd]

###

### Controls one or many listeners for collectd data.

###

[[collectd]]

  # enabled = false

  # bind-address = ":25826"

  # database = "collectd"

  # retention-policy = ""

  #

  # The collectd service supports either scanning a directory for multiple types

  # db files, or specifying a single db file.

  # typesdb = "/usr/local/share/collectd"

  #

  # security-level = "none"

  # auth-file = "/etc/collectd/auth_file"

  # These next lines control how batching works. You should have this enabled

  # otherwise you could get dropped metrics or poor performance. Batching

  # will buffer points in memory if you have many coming in.

  # Flush if this many points get buffered

  # batch-size = 5000

  # Number of batches that may be pending in memory

  # batch-pending = 10

  # Flush at least this often even if we haven't hit buffer limit

  # batch-timeout = "10s"

  # UDP Read buffer size, 0 means OS default. UDP listener will fail if set above OS max.

  # read-buffer = 0

  # Multi-value plugins can be handled two ways.

  # "split" will parse and store the multi-value plugin data into separate measurements

  # "join" will parse and store the multi-value plugin as a single multi-value measurement.

  # "split" is the default behavior for backward compatibility with previous versions of influxdb.

  # parse-multivalue-plugin = "split"

###

### [opentsdb]

###

### Controls one or many listeners for OpenTSDB data.

###

[[opentsdb]]

  # enabled = false

  # bind-address = ":4242"

  # database = "opentsdb"

  # retention-policy = ""

  # consistency-level = "one"

  # tls-enabled = false

  # certificate= "/etc/ssl/influxdb.pem"

  # Log an error for every malformed point.

  # log-point-errors = true

  # These next lines control how batching works. You should have this enabled

  # otherwise you could get dropped metrics or poor performance. Only points

  # metrics received over the telnet protocol undergo batching.

  # Flush if this many points get buffered

  # batch-size = 1000

  # Number of batches that may be pending in memory

  # batch-pending = 5

  # Flush at least this often even if we haven't hit buffer limit

  # batch-timeout = "1s"

###

### [[udp]]

###

### Controls the listeners for InfluxDB line protocol data via UDP.

###

[[udp]]

  # enabled = false

  # bind-address = ":8089"

  # database = "udp"

  # retention-policy = ""

  # InfluxDB precision for timestamps on received points ("" or "n", "u", "ms", "s", "m", "h")

  # precision = ""

  # These next lines control how batching works. You should have this enabled

  # otherwise you could get dropped metrics or poor performance. Batching

  # will buffer points in memory if you have many coming in.

  # Flush if this many points get buffered

  # batch-size = 5000

  # Number of batches that may be pending in memory

  # batch-pending = 10

  # Will flush at least this often even if we haven't hit buffer limit

  # batch-timeout = "1s"

  # UDP Read buffer size, 0 means OS default. UDP listener will fail if set above OS max.

  # read-buffer = 0

###

### [continuous_queries]

###

### Controls how continuous queries are run within InfluxDB.

###

[continuous_queries]

  # Determines whether the continuous query service is enabled.

  # enabled = true

  # Controls whether queries are logged when executed by the CQ service.

  # log-enabled = true

  # Controls whether queries are logged to the self-monitoring data store.

  # query-stats-enabled = false

  # interval for how often continuous queries will be checked if they need to run

  # run-interval = "1s"

###

### [tls]

###

### Global configuration settings for TLS in InfluxDB.

###

[tls]

  # Determines the available set of cipher suites. See https://golang.org/pkg/crypto/tls/#pkg-constants

  # for a list of available ciphers, which depends on the version of Go (use the query

  # SHOW DIAGNOSTICS to see the version of Go used to build InfluxDB). If not specified, uses

  # the default settings from Go's crypto/tls package.

  # ciphers = [

  #   "TLS_ECDHE_ECDSA_WITH_CHACHA20_POLY1305",

  #   "TLS_ECDHE_RSA_WITH_AES_128_GCM_SHA256",

  # ]

  # Minimum version of the tls protocol that will be negotiated. If not specified, uses the

  # default settings from Go's crypto/tls package.

  # min-version = "tls1.2"

  # Maximum version of the tls protocol that will be negotiated. If not specified, uses the

  # default settings from Go's crypto/tls package.

  # max-version = "tls1.2"
错误集锦
首次安装配置完成之后,在数据库可以看到novatec的数据信息,但是在grafana中没有实时结果,修改界面中的sql没有发现什么问题,后来发现是查看筛选条件出的问题
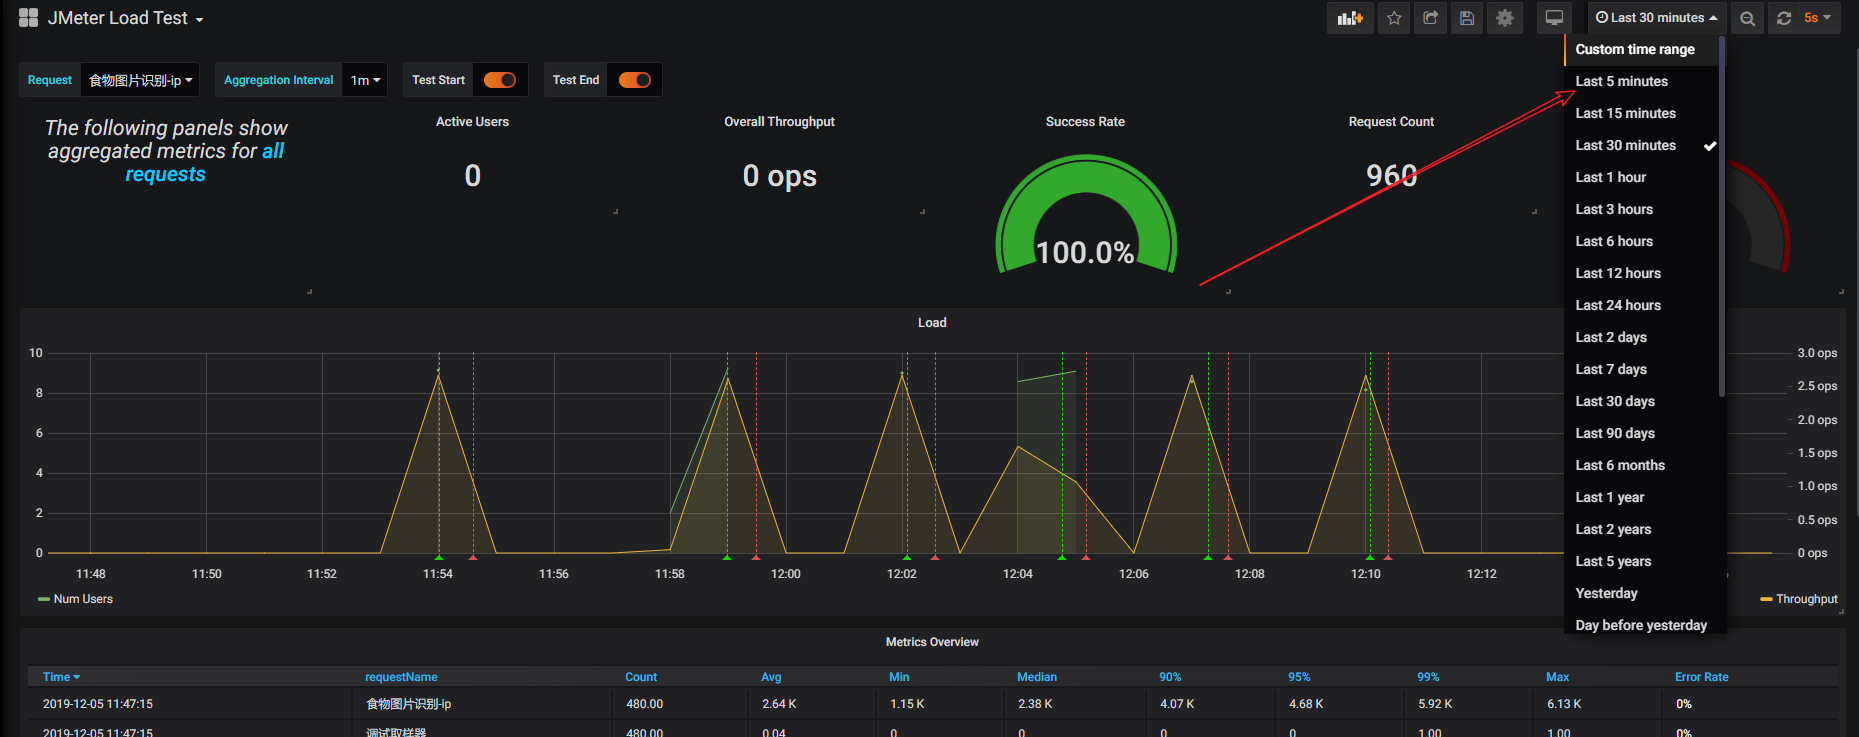
这里修改一下筛选条件即可~
Jmeter+ InfluxDB+Grafana安装配置的更多相关文章
- influxDB+grafana安装配置及邮件告警发送配置
1. InfluxDB安装 下载包并解压: $:wgethttps://dl.influxdata.com/influxdb/releases/influxdb-1.3.6_linux_amd64.t ...
- influxDB1.6版安装与配置(windows环境)、Jmeter+influxDB+Grafana性能监控
influxDB1.6版安装与配置(windows环境).Jmeter+influxDB+Grafana性能监控 来源:https://blog.csdn.net/SwTesting/article/ ...
- 性能工具之JMeter+InfluxDB+Grafana打造压测可视化实时监控【转】
概述 本文我们将介绍如何使用JMeter+InfluxDB+Grafana打造压测可视化实时监控. 引言 我们很多时候在使用JMeter做性能测试,我们很难及时察看压测过程中应用的性能状况,总是需要等 ...
- jmeter+influxdb+grafana性能测试监控
背景: 话说Jmeter原生的监控确实太丑了,听大佬们在讨论Jmeter+InfluxDb+Grafana的监控,于是,为了有一个漂亮的测试报告,就手动开始进行部署. 安装步骤: 1.influxdb ...
- 性能工具之JMeter+InfluxDB+Grafana打造压测可视化实时监控
一.安装配置InfluxDB InfluxDB是GO语言开发的一个开源分布式时序数据库,非常适合存储指标.事件.分析等数据.有人做过mysql和influxDB对比,存储1000万条数据mysql要7 ...
- 搭建jmeter+influxdb+grafana压测实时监控平台(超详细,小白适用)
1.前言 在使用jmeter做性能测试的时候,监控系统性能的时候,无论是使用插件还是报告生成,都没法实现实时监控.使用JMeter+Influxdb+Grafana可以实现实时监控. 本次环境搭建各软 ...
- grafana 安装配置
Grafana安装配置 1.下载安装包 wget https://s3-us-west-2.amazonaws.com/grafana-releases/release/grafana-5.1.3.l ...
- JMeter下载及安装配置完整版
特别需要注意的时,jdk版本和jmeter版本匹配问题. Jdk1.8对应apache-jmeter-3.3 Jmeter下载及安装配置 本文是在win7环境下安装使用jmeter,jmeter可以运 ...
- Prometheus(一):Prometheus+Grafana 安装配置
一.基础环境 系统 IP 监控主机 CentOS 7 192.168.56.200 被监控主机 CentOS 7 192.168.56.201 二.Prometheus服务端安装 以下操作皆在监控主机 ...
随机推荐
- Boosting Ensemble and GBDT Algorithm
Boosting Ensemble: 机器学习中,Ensemble model除了Bagging以外,更常用的是Boosting.与Bagging不同,Boosting中各个模型是串行的.其思想是,后 ...
- 【读书笔记】:MIT线性代数(1):Linear Combinations
1. Linear Combination Two linear operations of vectors: Linear combination: 2.Geometric Explaination ...
- Get column value of Flex Datagrid by QTP
' get the number of rows in the tablerowCount=Browser("Browser").FlexApplication("App ...
- Base64加密工具
正常来讲加密基本上永远都要伴随着解密,所谓的加密或者解密,往往都需要有一些规则,在JDK1.8开始,提供有新的加密处理操作类,Base64处理类--Base64类 在该类之中存在两个内部类:Base6 ...
- C++中的静态成员函数
1,问完成的需求: 1,统计在程序运行期间某个类的对象数目: 1,静态成员变量满足了这个需求: 2,保证程序的安全性(不能使用全局变量): 3,随时可以获取当前对象的数目: 1,有没有什么特别的地方或 ...
- 多线性方程组迭代算法——Gauss-Seidel迭代算法的Python实现
多线性方程组(张量)迭代算法的原理请看这里:原理部分请留言,不方便公开分享 Jacobi迭代算法里有详细注释:多线性方程组迭代算法——Jacobi迭代算法的Python实现 import numpy ...
- 搭建 webpack、react 开发环境(三)
配置 react-router-dom 我们开发一个 React 工程肯定不是一两个“页面”就可以满足需求的,所以我们需要一个在多个“页面”中跳转的功能,在使用 React 构建的单页面应用中,要 ...
- UVALive 4728 Squares(旋转卡壳)
Squares The famous Korean IT company plans to make a digital map of the Earth with help of wireless ...
- java虚拟机规范(se8)——class文件格式(七)
4.7.5 Exceptions 属性 Exceptions 属性是一个变长属性,它位于 method_info(§4.6)结构的属性表中. Exceptions 属性指出了一个方法需要检查的可能抛出 ...
- 【记录】Redis 基础
Redis可以存放五种类型 1:String(字符串) 2:List(列表) 3:Hash(字典) 4:Set(集合) 5:ZSet(有序集合) String (字符串) redis 127.0.0. ...