iOS 图表工具charts之BarChartView
关于charts的系列视图介绍传送门:
iOS 图表工具charts介绍
iOS 图表工具charts之LineChartView
iOS 图表工具charts之BarChartView
iOS 图表工具charts之PieChartView
iOS 图表工具charts之CandleStickChartView
iOS 图表工具charts之CombinedChartView
BarChartView在charts中可以用来绘制柱状图,由于charts是基于swift开发的,如果需要和objective-C混编(通过pod的方式不用管),可以参考我的上几篇文章《iOS OC中桥接swift第三方库》,这里主要讲的是LineChartView的一些常用属性和一些基本用法,实际情况以开发为准

chartView的更加细节的属性设置 请查看我的上篇文章《iOS 图表工具charts之LineChartView》,因为BarChartView大部分基础属性都差不多,这里就不详细写注释了
BarChartView的基础设置
-(void)setupUI{

    //BarChartView默认纵向展示柱状图, 如果需要横向展示 则创建HorizontalBarChartView即可

    BarChartView *chartView = [[BarChartView alloc] init];

    //设置偏移

    [chartView setExtraOffsetsWithLeft:10 top:10 right:10 bottom:10];

    //开启border

    chartView.drawBordersEnabled = YES;

    chartView.borderLineWidth = .5f;

    chartView.borderColor = UIColor.blackColor;

    //设置背景

    chartView.drawGridBackgroundEnabled = NO;

    chartView.gridBackgroundColor = [UIColor grayColor];

    //无内容显示

    chartView.noDataText = @"";

    //关闭描述

    chartView.chartDescription.enabled = NO;

    chartView.chartDescription.text = @"tiny`s barChart demo";

    //关闭图例

    chartView.legend.enabled = NO;

    //缩放

    chartView.scaleXEnabled = NO;

    chartView.scaleYEnabled = NO;

    chartView.autoScaleMinMaxEnabled = YES;

    chartView.highlightPerTapEnabled = NO;

    chartView.highlightPerDragEnabled = NO;

    chartView.pinchZoomEnabled = NO;  //手势捏合

    chartView.dragEnabled = YES;

    chartView.dragDecelerationFrictionCoef = 0.5;  //0 1 惯性

    //代理

    chartView.delegate = self;

    //leftAxis

    ChartYAxis *leftAxis = chartView.leftAxis;

    leftAxis.enabled = YES;

    leftAxis.labelPosition = YAxisLabelPositionOutsideChart;

    leftAxis.drawGridLinesEnabled = YES;

    leftAxis.gridLineDashLengths = @[@2,@4];

    leftAxis.labelTextColor = UIColor.blackColor;

    leftAxis.labelFont = [UIFont systemFontOfSize:10];

    leftAxis.decimals = 2;

    //设置样式

    LeftAxisFormatter *leftFormatter = [LeftAxisFormatter new];

    leftAxis.valueFormatter = leftFormatter;

    //rightAxis

    ChartYAxis *rightAxis = chartView.rightAxis;

    rightAxis.enabled = NO;

    //xAxis

    ChartXAxis *xAxis = chartView.xAxis;

    xAxis.enabled = YES;

    xAxis.labelPosition = XAxisLabelPositionBottom;

    //不画线

    xAxis.drawGridLinesEnabled = NO;

    BarxAxisFormatter *xFormatter = [BarxAxisFormatter new];

    xAxis.valueFormatter = xFormatter;

    xFormatter.titles = @[@"语文",@"数学",@"外语",@"物理"];

    self.charView = chartView;

    [self addSubview:self.charView];

    [self.charView mas_makeConstraints:^(MASConstraintMaker *make) {

        make.edges.mas_offset(0);

    }];

    //draw

    [self drawData];

    //执行动画

    [self.charView animateWithYAxisDuration:1.f];

}

-(void)drawData{

    NSArray *datas = @[@100,@90,@76,@55,@45,@77,@98,@62];

    NSMutableArray *array = [NSMutableArray array];

    for (int i = 0; i < datas.count; i++) {

        BarChartDataEntry *entry = [[BarChartDataEntry alloc] initWithX:i y:[datas[i] integerValue]];

        [array addObject:entry];

    }

    //set

    BarChartDataSet *set = [[BarChartDataSet alloc] initWithEntries:array label:@"Bar DataSet"];

    [set setColors:@[UIColor.redColor,UIColor.blueColor,UIColor.blueColor,UIColor.blackColor,UIColor.cyanColor,UIColor.grayColor,UIColor.greenColor,UIColor.cyanColor]];

    //显示柱图值并格式化

    NSNumberFormatter *numberFormatter = [[NSNumberFormatter alloc] init];

    numberFormatter.positiveSuffix = @"分";

    ChartDefaultValueFormatter *formatter = [[ChartDefaultValueFormatter alloc] initWithFormatter:numberFormatter];

    [set setValueFormatter:formatter];

    set.highlightEnabled = NO;

    BarChartData *data = [[BarChartData alloc] initWithDataSet:set];

    self.charView.data = data;

}

#pragma mark - ChartViewDelegate

#pragma mark 图表中数值被选中

-(void)chartValueSelected:(ChartViewBase *)chartView entry:(ChartDataEntry *)entry highlight:(ChartHighlight *)highlight{

//    NSLog(@"图表中数值被选中");

}

#pragma mark 图表中的空白区域被选中

-(void)chartValueNothingSelected:(ChartViewBase *)chartView{

//    NSLog(@"空白区域被选中");

}

#pragma mark 图表被缩放

-(void)chartScaled:(ChartViewBase *)chartView scaleX:(CGFloat)scaleX scaleY:(CGFloat)scaleY{

//    NSLog(@"图表被缩放");

}

#pragma mark 图表被移动

-(void)chartTranslated:(ChartViewBase *)chartView dX:(CGFloat)dX dY:(CGFloat)dY{

//    NSLog(@"图表被移动");

}
一些需要注意的点:
1.如果需要给每个bar显示的数字格式化比如 100分, 100t,100g等等添加前缀或者后缀,则可以设置BarChartDataSet属性
    NSNumberFormatter *numberFormatter = [[NSNumberFormatter alloc] init];

    numberFormatter.positiveSuffix = @"分";

    ChartDefaultValueFormatter *formatter = [[ChartDefaultValueFormatter alloc] initWithFormatter:numberFormatter];

    [set setValueFormatter:formatter];
2.柱状图动画效果
    //执行动画

    [self.charView animateWithYAxisDuration:1.f];
3.颜色可以没每个柱子设置颜色
[set setColors:@[UIColor.redColor,UIColor.blueColor,UIColor.blueColor,UIColor.blackColor,UIColor.cyanColor,UIColor.grayColor,UIColor.greenColor,UIColor.cyanColor]];
4.每个点的数值要显示出来
set.drawValuesEnabled = YES;
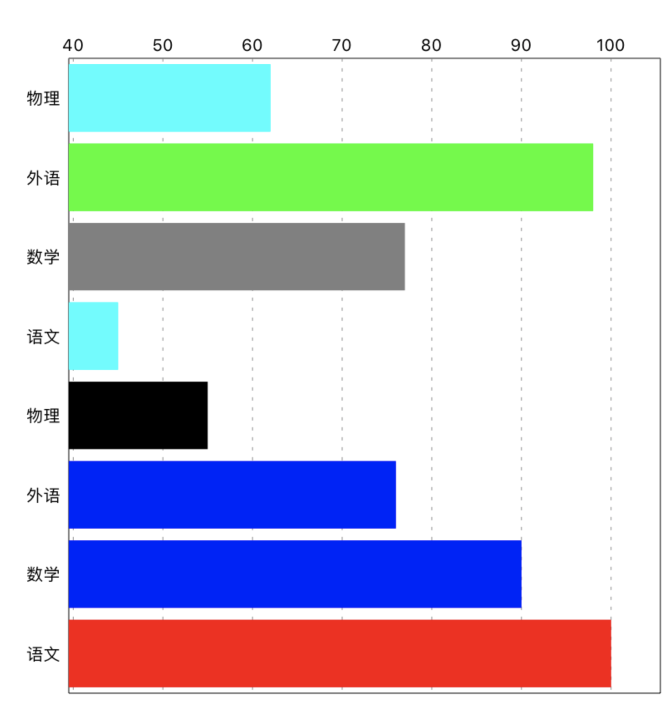
5.柱状图横向显示,只需要将BarChartView换成HorizontalBarChartView即可,其他不变 效果图如下:

6.BarChartData可以添加多个柱子
 BarChartData *data = [[BarChartData alloc] init]

 [data addDataSet:set]
转载请标注来源:https://www.cnblogs.com/qqcc1388/
iOS 图表工具charts之BarChartView的更多相关文章
- iOS 图表工具charts之CombinedChartView
关于charts的系列视图介绍传送门: iOS 图表工具charts介绍 iOS 图表工具charts之LineChartView iOS 图表工具charts之BarChartView iOS 图表 ...
- iOS 图表工具charts之CandleStickChartView(K线)
关于charts的系列视图介绍传送门: iOS 图表工具charts介绍 iOS 图表工具charts之LineChartView iOS 图表工具charts之BarChartView iOS 图表 ...
- iOS 图表工具charts之PieChartView
关于charts的系列视图介绍传送门: iOS 图表工具charts介绍 iOS 图表工具charts之LineChartView iOS 图表工具charts之BarChartView iOS 图表 ...
- iOS 图表工具charts之LineChartView
关于charts的系列视图介绍传送门: iOS 图表工具charts介绍 iOS 图表工具charts之LineChartView iOS 图表工具charts之BarChartView iOS 图表 ...
- iOS 图表工具charts介绍
charts是一个很好的绘图工具,功能非常强大,可以用来绘制折线,柱状图,饼状图,k线图,k线分时图,雷达图,气泡图等等,charts是一款仿照安卓 MPAndroidChart而来的一个基于swif ...
- JHChart 1.1.0 iOS图表工具库中文ReadMe
JHChart(最新版本1.1.0) 好吧,的确当前的github上已经存有不少的iOS图表工具库,然而,当公司的项目需要图表时,几乎没有哪个第三方能够完全满足我的项目需求.无奈之下,本人不得不花费一 ...
- JHChart iOS图表工具库1.0.3新版本详解
前言. 从2016年4月14日开始,本人着手开发了JHChart图表工具库.经过断断续续的开发,截止到现在,已经实现了折线图.柱状图.饼状图.环形图和表格样式的图表功能.为了方便使用,我已经将一个简单 ...
- iOS图表库Charts集成与使用
Charts是一个很优秀的图表库,它支持Android.iOS.tvOS和macOS,这样使用起来,可以节省学习成本,可以从GitHub上了解更多信息.本文记录在iOS项目上的集成与使用. Chart ...
- .net图表工具汇总
概述:图形图表的可视化数据表现形式已成为一种趋势,本文推荐了10款非常好用的.NET图表控件,希望对广大.NET图表开发者能有所帮助. 读图时代,图形图表的可视化数据表现形式已成为一种趋势.因为图表能 ...
随机推荐
- JVM内存区域划分总结
发现网上有两个版本的JVM内存划分,一个是按照<深入理解JVM虚拟机>上的版本,包含程序计数器等,按照是否线程共享划分. 另一个我觉得更好记一些,也更适合我自己,在这里记录一下. 首先上思 ...
- h5转pb的两个坑
1.需要加上如下设置,否则转换前后输出可能不一致,这个主要针对dropout.BN层训练测试不一致 from keras import backend as K K.set_learning_phas ...
- 【基础操作】博弈论 / SG 函数详解
博弈死我了……(话说哪个小学生会玩博弈论提到的这类弱智游戏,还取石子) 先推荐两个文章链接:浅谈算法——博弈论(从零开始的博弈论) 博弈论相关知识及其应用 This article was updat ...
- Django学习系列14:第一个数据库迁移
在Django中,ORM的任务是模型化数据库. 创建数据库其实是由另一个系统负责的叫做迁移. 迁移的任务是根据你对models.py文件的改动情况,添加或删除表和列. 可以把迁移想象成数据库使用的版本 ...
- CUDA升级后
打开工程文件.vcxproj,找到 <Import Project="$(VCTargetsPath)\BuildCustomizations\CUDA 10.0.props" ...
- JavaScript入门学习之一——初级语法
JavaScript是前端编辑的一种编程语言(不同于html,html是一种标记语言),所以和其他的编程语言一样,我们将会从下面几点学习 基础语法 数据类型 函数 面向对象 JavaScript的组成 ...
- JAVA GUI设
1.两种设置大小的方式: //Border border1=BorderFactory.createEmptyBorder(20,20,20,20); //设置大小 panel.setB ...
- 创建Windows任务计划定时调用网页执行任务(通过Windows PowerShell的Invoke-WebRequest实现)
前言:项目中使用RoadFlow工作流,设置超时自动提交功能,自动提交功能已有现成的网页可实现(http://127.0.0.1/WorkFlowRun/AutoSubmit),现需创建Windows ...
- mysqli在php7中的使用
mysqli这个库还是比较繁杂的,这其中又分mysqli ,mysqli_stmt,mysqli_result......一堆类,特别乱 这里奉上thinkphp5.1中使用mysqli扩展的查询用法 ...
- JavaScript基础——JavaScript数据类型(笔记)
数据类型(笔记) null和undefined 在JavaScript中有两个特殊的值: null和undefined.简单说明如下: null 是Null类型的值,Null类型的值只有一个值(nul ...
