promethus+grafana监控
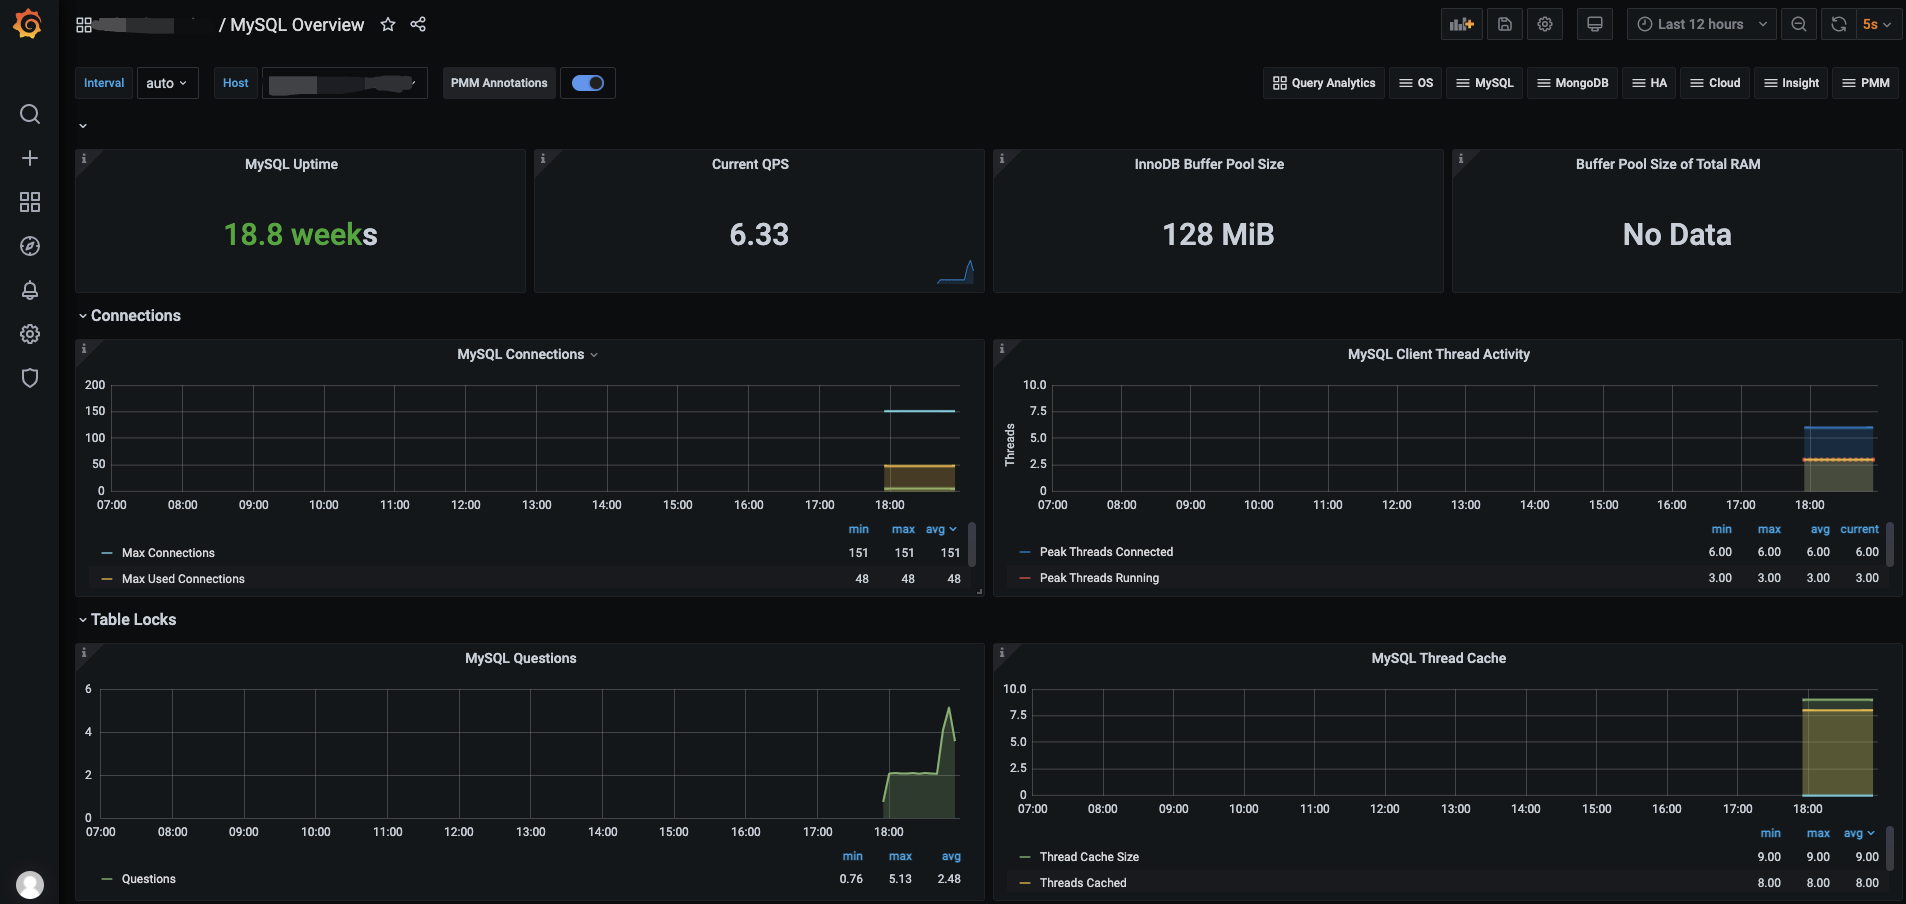
1、监控 MySQL
(终端可以安装在任意主机,不一定按在mysql节点上,注:mysql版本需在5.5以上)
I、首先在mysql中添加监控使用的用户:
create user 'exp'@'%' identified by 'exp';
grant process,replication client,select on *.* to 'exp'@'%';
II、安装监控终端 mysqld_exporter
cd /data/prometheus/ (此目录为服务器上任意目录,根据个人习惯而定)
下载地址:https://github.com/prometheus/mysqld_exporter/releases/download/v0.12.1/mysqld_exporter-0.12.1.linux-amd64.tar.gz
tar -xvf mysqld_exporter-0.12.1.linux-amd64.tar.gz
mv mysqld_exporter-0.12.1.linux-amd64 mysqld_exporter
cd mysqld_exporter
编辑终端使用的配置文件
vim mysqld_exporter.cnf
[client]
host=172.xxx.xxx.xxx
user=exp
password=exp
启动终端程序(次程序为后台启动程序)
nohup ./mysqld_exporter --config.my-cnf=mysqld_exporter.cnf > mysqld_exporter.log 2>&1 &
启动后此程序默认端口为9104
III、添加prometheus监控及倒入grafana模版
cd /prometheus/prometheus/
vim prometheus.yml
- job_name: 'mysql' (监控作业名称)
static_configs:(静态添加)
- targets: ['172.26.1.134:9104'](终端地址及端口)
重新引导prometheus
curl -X POST http://localhost:9090/-/reload (在prometheus主机上)
grafana添加模版

导入后效果
2、监控 Redis
I、安装监控终端
cd /data/prometheus/ (此目录为服务器上任意目录,根据个人习惯而定)
下载地址:https://github.com/oliver006/redis_exporter/releases/download/v0.30.0/redis_exporter-v0.30.0.linux-amd64.tar.gz
tar -xvf redis_exporter-v0.30.0.linux-amd64.tar.gz
mv redis_exporter-v0.30.0.linux-amd64 redis_exporter
cd redis_exporter
启动终端程序
## 无密码 nohup ./redis_exporter -redis.addr 172.26.1.120:6379 &
## 有密码 nohup ./redis_exporter -redis.addr 172.26.1.120:6379 -redis.password 123456
III、添加prometheus监控及倒入grafana模版
cd /prometheus/prometheus/
vim prometheus.yml
- job_name: 'redis' (监控作业名称)
static_configs:(静态添加)
- targets: ['172.26.1.134:9121'](终端地址及端口)
重新引导prometheus
curl -X POST http://localhost:9090/-/reload (在prometheus主机上)
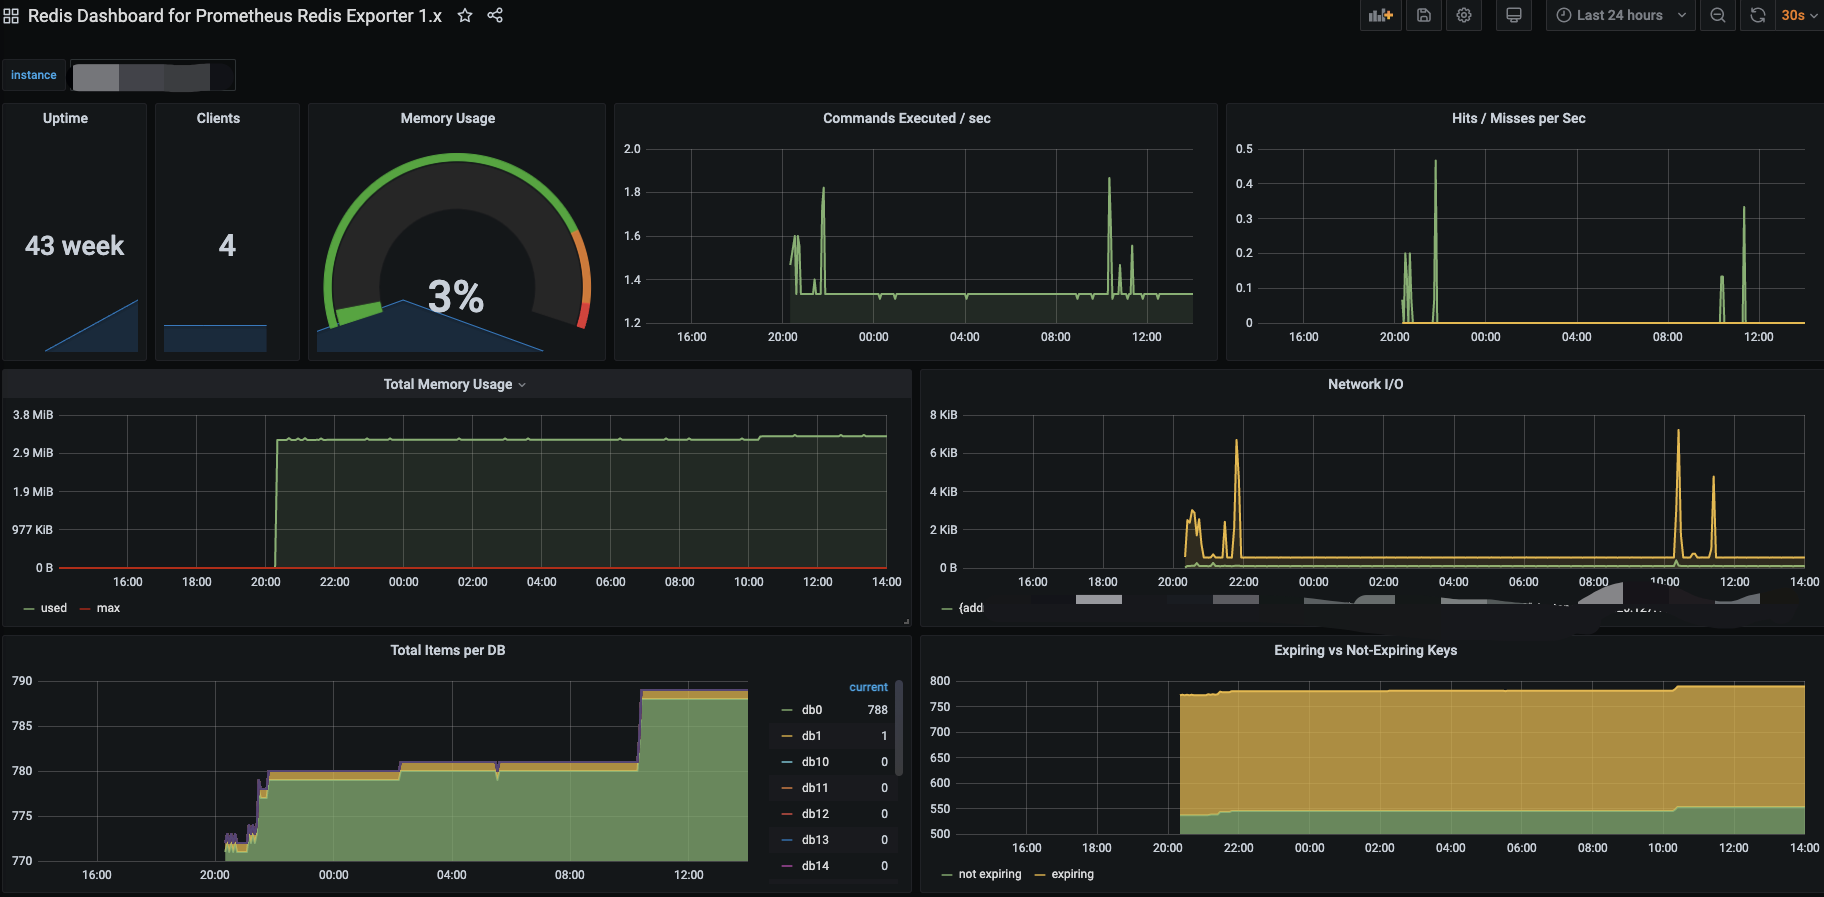
grafana 模版763
导入后效果
3、监控 Elasticsearch
I、安装监控终端
cd /data/prometheus/ (此目录为服务器上任意目录,根据个人习惯而定)
下载地址:wget https://github.com/justwatchcom/elasticsearch_exporter/releases/download/v1.1.0/elasticsearch_exporter-1.1.0.linux-amd64.tar.gz
tar -xvf elasticsearch_exporter-1.1.0.linux-amd64.tar.gz
mv elasticsearch_exporter-1.1.0.linux-amd64 elasticsearch_exporter
cd elasticsearch_exporter
启动终端程序
nohup ./elasticsearch_exporter --es.uri http://localhost:9200 &
## 参数说明:
--es.uri 默认http://localhost:9200,连接到的Elasticsearch节点的地址(主机和端口)。 这可以是本地节点(例如localhost:9200),也可以是远程Elasticsearch服务器的地址
--es.all 默认flase,如果为true,则查询群集中所有节点的统计信息,而不仅仅是查询我们连接到的节点。
--es.cluster_settings 默认flase,如果为true,请在统计信息中查询集群设置
--es.indices 默认flase,如果为true,则查询统计信息以获取集群中的所有索引。
--es.indices_settings 默认flase,如果为true,则查询集群中所有索引的设置统计信息。
--es.shards 默认flase,如果为true,则查询集群中所有索引的统计信息,包括分片级统计信息(意味着es.indices = true)。
--es.snapshots 默认flase,如果为true,则查询集群快照的统计信息。
III、添加prometheus监控及倒入grafana模版
cd /prometheus/prometheus/
vim prometheus.yml
- job_name: 'es' (监控作业名称)
static_configs:(静态添加)
- targets: ['172.26.1.134:9114'](终端地址及端口)
重新引导prometheus
curl -X POST http://localhost:9090/-/reload (在prometheus主机上)
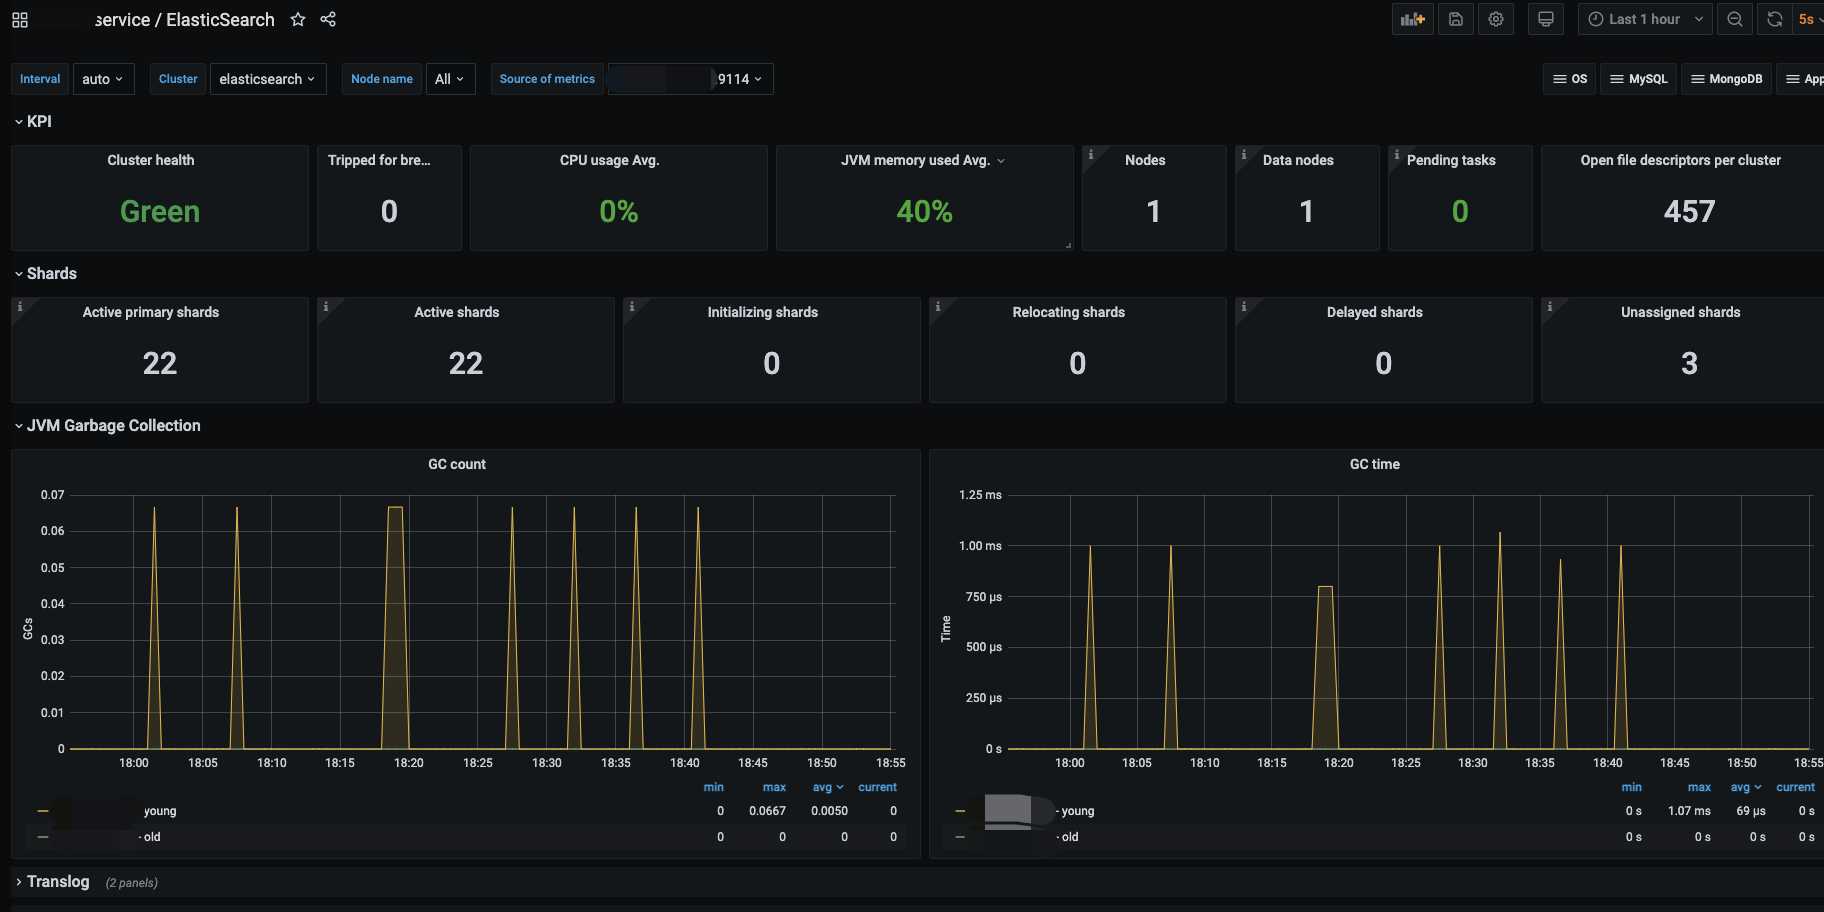
grafana 模版2322
导入后效果
4、监控 RabbitMQ
I、安装监控终端
cd /data/prometheus/ (此目录为服务器上任意目录,根据个人习惯而定)
下载地址:wget wget https://github.com/kbudde/rabbitmq_exporter/releases/download/v0.29.0/rabbitmq_exporter-0.29.0.linux-amd64.tar.gz
tar -xvf rabbitmq_exporter-0.29.0.linux-amd64.tar.gz
mv rabbitmq_exporter-0.29.0.linux-amd64.tar.gz rabbitmq_exporter
cd rabbitmq_exporter
启动终端程序
RABBIT_USER=geust RABBIT_PASSWORD=geust OUTPUT_FORMAT=JSON PUBLISH_PORT=9099 RABBIT_URL=http://ip:15672 nohup ./rabbitmq_exporter &
RABBIT_USER 用户名
RABBIT_PASSWORD 密码
PUBLISH_PORT 监控端口
RABBIT_URL 监控地址
II、添加prometheus监控及倒入grafana模版
cd /prometheus/prometheus/
vim prometheus.yml
- job_name: 'es' (监控作业名称)
static_configs:(静态添加)
- targets: ['172.26.1.134:9099'](终端地址及端口)
重新引导prometheus
curl -X POST http://localhost:9090/-/reload (在prometheus主机上)
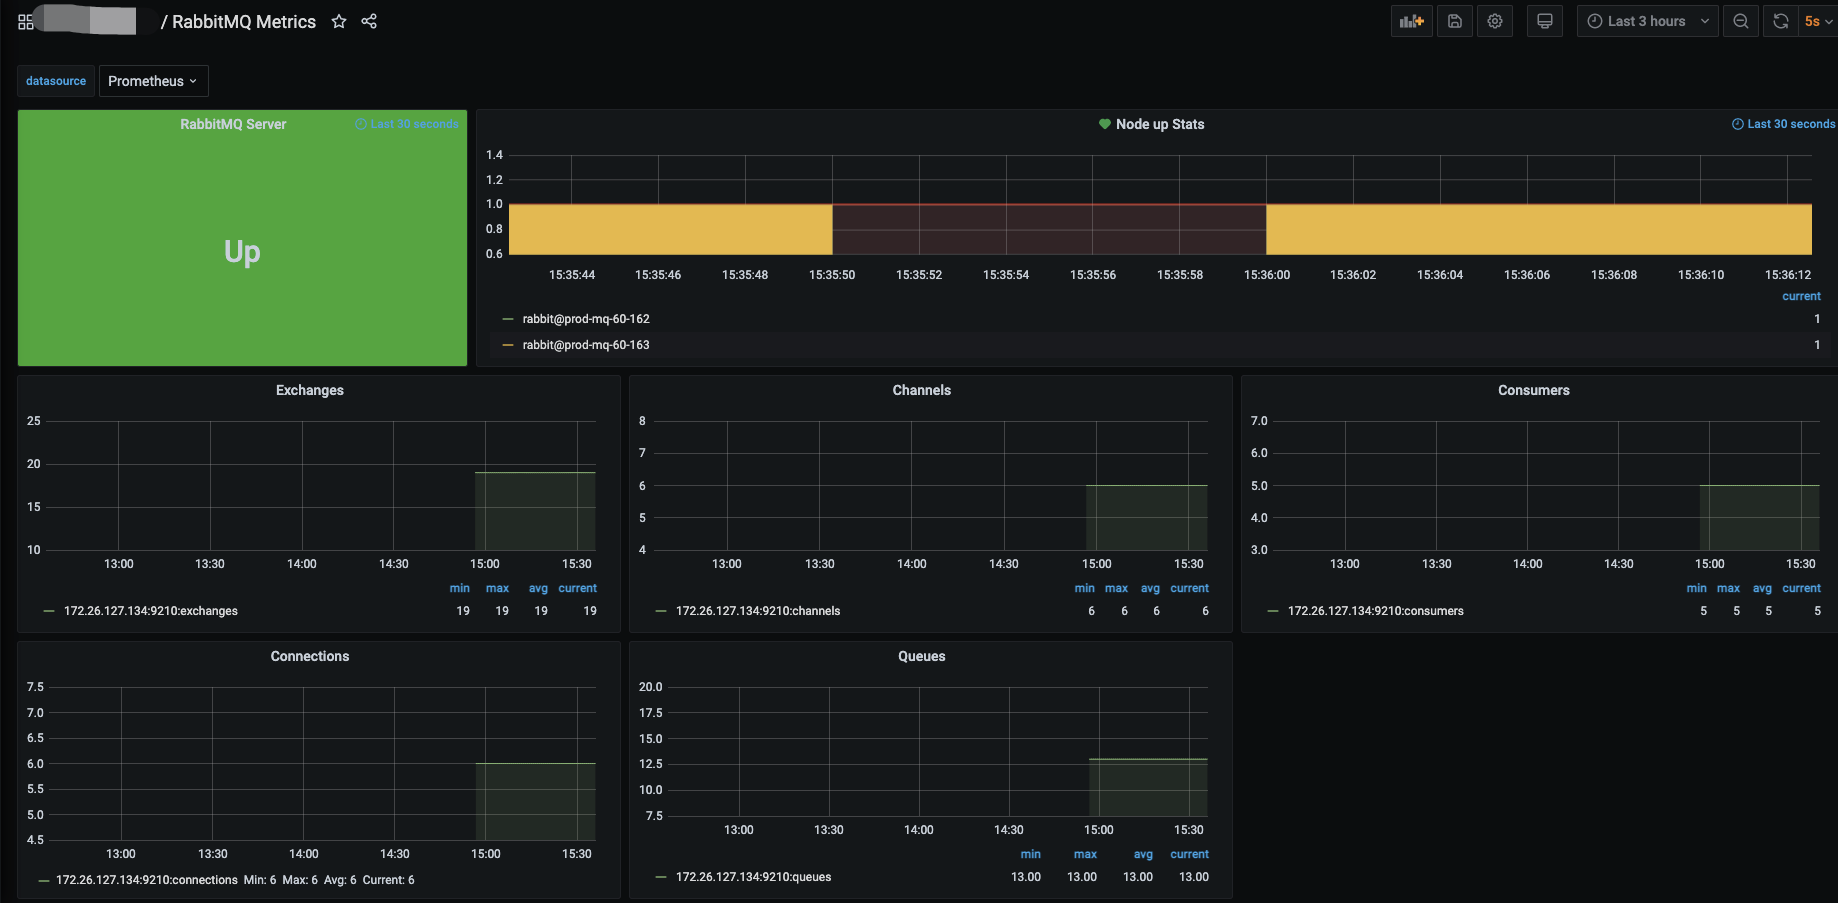
grafana 模版2121
导入后效果
promethus+grafana监控的更多相关文章
- Promethus+Grafana监控解决方案
[MySQL]企业级监控解决方案Promethus+Grafana Promethus用作监控数据采集与处理,而Grafana只是用作数据展示 一.Promethus简介 Prometheus(普罗米 ...
- 使用Promethus+Grafana监控Mongodb
note:本人周五开始接触promethuse,周一上班就开始搭环境和配置监控,其实本人对这三个东西根本就是略知一二,但是,我预测感觉过程还是简单的,结果... 首先把过程和遇到的问题一一说明. 1. ...
- Docker部署Zabbix+Grafana监控
Docker部署Zabbix+Grafana监控 环境 centos 7 ; Docker 17.12.0-ce ; docker-compose version 1.20.1 2018-4-1 当前 ...
- cAdvisor+Prometheus+Grafana监控docker
cAdvisor+Prometheus+Grafana监控docker 一.cAdvisor(需要监控的主机都要安装) 官方地址:https://github.com/google/cadvisor ...
- [转帖]Prometheus+Grafana监控Kubernetes
原博客的位置: https://blog.csdn.net/shenhonglei1234/article/details/80503353 感谢原作者 这里记录一下自己试验过程中遇到的问题: . 自 ...
- 使用Telegraf + Influxdb + Grafana 监控SQLserver服务器的运行状况
使用Telegraf + Influxdb + Grafana 监控SQLserver服务器的运行状况 前言 本文在Debian9下采用Docker的方式安装Telegraf + Influxdb + ...
- 快速接入业务监控体系,grafana监控的艺术
做一个系统,如果不做监控,是不完善的. 如果为做一个快速系统,花力气去做监控,是不值得的. 因为,我们有必要具备一个能够快速建立监控体系的能力.即使你只是一个普通开发人员! 个人觉得,做监控有三个核心 ...
- prometheus+grafana监控redis
prometheus+grafana监控redis redis安装配置 https://www.cnblogs.com/autohome7390/p/6433956.html redis_export ...
- prometheus+grafana监控mysql
prometheus+grafana监控mysql 1.安装配置MySQL官方的 Yum Repository(有mysql只需设置监控账号即可) [root@localhost ~]# wget - ...
- [转帖]安装prometheus+grafana监控mysql redis kubernetes等
安装prometheus+grafana监控mysql redis kubernetes等 https://www.cnblogs.com/sfnz/p/6566951.html plug 的模式进行 ...
随机推荐
- laravel 服务容器,容器概念
Laravel 服务容器 发现一篇讲服务容器的文章,讲的很好,转载过来laravel 服务容器 实质是工厂模式的升级,类的传递动态加载 ####以下内容转载 容器,字面上理解就是装东西的东西.常见的变 ...
- HIVE- 删除功能
删除分区: ALTER TABLE table_name DROP PARTITION (partition_name='20220101');
- CCF 201812-1 小明上学
#include <iostream> #include <bits/stdc++.h> #include <string> using namespace std ...
- npm不是内部或外部命令,也不是可运行的程序的解决办法
通常是nodejs没有安装导致 转载https://segmentfault.com/a/1190000023390756 1.Node.js简介 Node.js 是一个基于 Chrome V8 引擎 ...
- windows server 2012以上版本离线安装 net framework3.5 方法
方法1. 通过服务管理器安装操作系统原镜像文件 准备windows系统镜像文件,解压windows server.iso文件到 D:\WindowsOS 在服务器管理器上添加.NET Framewor ...
- solve--NAT模式下配置静态IP地址
第一步 打开虚拟机的虚拟网络编辑器:
- Windows10下SecureCRT、SecureFX安装与破解(超级详细)
整理了Windows10下最新版本SecureCRT9.1.SecureFX9.1安装 1.资源地址: 链接:https://pan.baidu.com/s/1XoQqpRlpBm6Tvc0fHni6 ...
- XMind8破解,详细版(亲测)
废话不多说,直接上料: 一.资源 百度网盘XMind8: 链接:https://pan.baidu.com/s/1h2DXkni4-POEpHyBqLxjwA 提取码:kqgy 破解补丁: 链接:ht ...
- DBeaver导入SQL脚本数据
DBeaver导入SQL脚本数据 起因 Navicat Premium还原备份的导致数据库中文乱码 看Navicat Premium中看中文数据,是正常显示了,但是在IEDA查询和Web页面上显示,均 ...
- Ginan-PEA例程下载
输入以下命令可在Ubuntu系统中进行下载,但受到网络限制并不能有效下载或者下载很慢 python3 scripts/download_examples.py 通过阅读python脚本,可将下载网址拷 ...