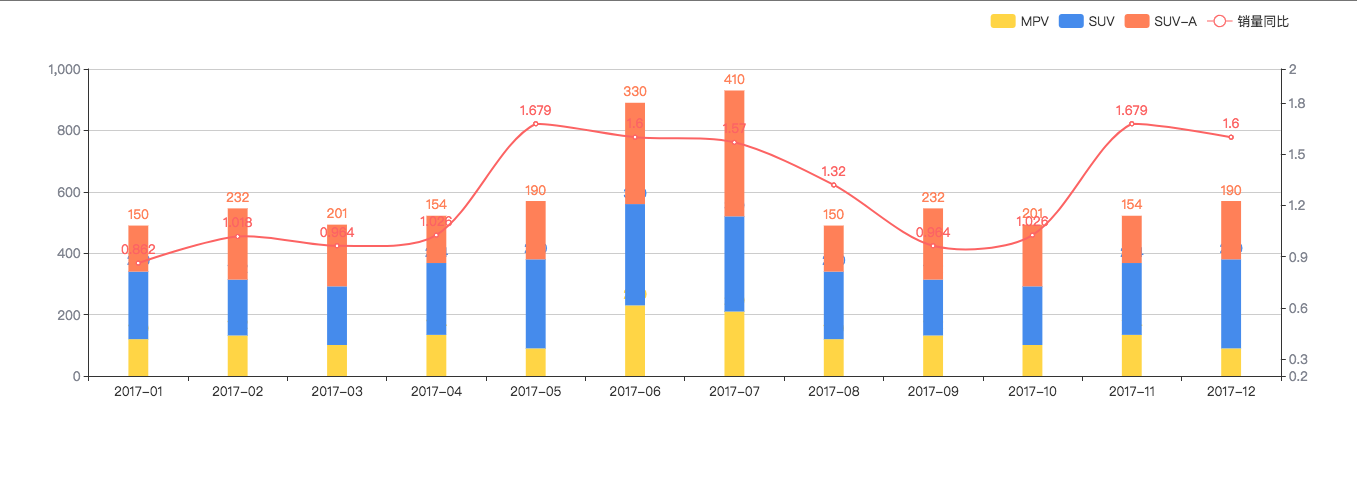
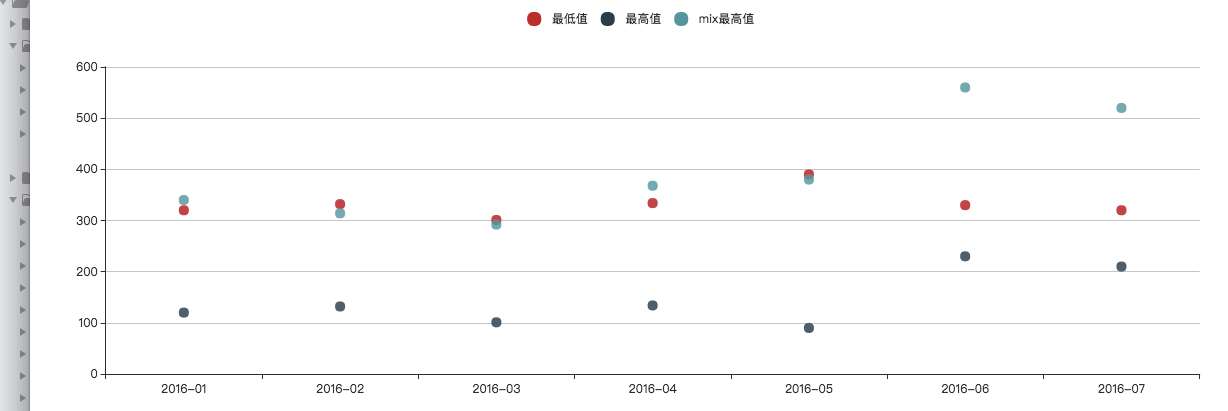
redflag的echarts结构
总体的市场情况

这里我需要4个data数组。
var list = {
currentData:[],//这里表示当月数据量,数组长度8
totalData:[],//这里表示的累计数据量,数组长度8
currentBasis:[],//这里表示的当月数据量同比,数组长度8
totalBasis:[]//这里表示的累计数据量同比,数组长度8
}
<!doctype html>

<html lang="en">

<head>

  <meta charset="UTF-8" />

  <title>Document</title>

  <script src="https://cdn.bootcss.com/echarts/3.7.1/echarts.js"></script>

</head>

<body>

  <div id="app" style="height:400px">

  </div>

  <script>

    window.myChart = echarts.init(document.querySelector('#app'));

    var option = {

      tooltip : {

        trigger: 'axis',

        axisPointer : {            // 坐标轴指示器,坐标轴触发有效

            type : 'shadow'        // 默认为直线,可选为:'line' | 'shadow'

        }

    },

    legend: {

        data:['当月销量','累计销量','当月销量同比','累计销量同比'],

        right:'5%'

    },

    grid: {

        left: '3%',

        right: '4%',

        bottom: '3%',

        containLabel: true

    },

    xAxis : [

        {

            type : 'category',

            data : ['乘用车','轿车','SUV','MPV','豪华车','豪华轿车','豪华SUV','豪华MPV'],

            axisLabel:{

                //formatter: '{value}%',

                /*formatter:function(e){

                    return window.tools.toThousands(parseInt(e))+"%"

                },*/

                textStyle:{

                    color: '#80848f'

                }

            },

        }

    ],

    yAxis : [

        {

            type : 'value',

            position: 'left',

            axisLabel:{

                //formatter: '{value}%',

                /*formatter:function(e){

                    return window.tools.toThousands(parseInt(e))+"%"

                },*/

                textStyle:{

                    color: '#80848f'

                }

            },

        },

        {

            axisLabel:{

                //formatter: '{value}%',

                /*formatter:function(e){

                    return window.tools.toThousands(parseInt(e))+"%"

                },*/

                textStyle:{

                    color: '#80848f'

                }

            },

            splitLine : {

                show: false

            },

            type: 'value',

            position: 'right',

            min:0.2,

            max:2

        }

    ],

    series : [

        {

            name:'当月销量',

            type:'bar',

            data:[320, 332, 301, 334, 390, 330, 320,310],

            barWidth: '20%',

            itemStyle:{

                normal:{

                    color:'#3cd8c0'

                }

            },

            label: {

                normal: {

                    show: true,

                    position: 'top',

                    textStyle:{

                        color:'#3cd8c0'

                    },

                    /*formatter:function(e){

                        e.data = window.tools.toThousands(parseInt(e.data));

                        e.data = e.data+"%";

                        return e.data;

                    }*/

                }

            }

        },

        {

            name:'累计销量',

            type:'bar',

            data:[862, 1018, 964, 1026, 1679, 1600, 1570, 1400],

            barGap: '20%',//两个柱之间的距离 或者距离前面的距离

            barWidth: '20%',

            itemStyle:{

                normal:{

                    color:'#3790f8'

                }

            },

            label: {

                normal: {

                    show: true,

                    position: 'top',

                    textStyle:{

                        color:'#3790f8'

                    },

                    /*formatter:function(e){

                        e.data = window.tools.toThousands(parseInt(e.data));

                        e.data = e.data+"%";

                        return e.data;

                    }*/

                }

            }

        },

        {

            name:'当月销量同比',

            type:'line',

            animationDuration: 2200,

            yAxisIndex:1,

            itemStyle:{

                normal:{

                    color:'#fc6363',

                }

            },

            label: {

                normal: {

                    show: true,

                    position: 'top',

                    textStyle:{

                        color:'#fc6363'

                    },

                    /*formatter:function(e){

                        e.data = window.tools.toThousands(parseInt(e.data));

                        e.data = e.data+"%";

                        return e.data;

                    }*/

                }

            },

            smooth: true,

            data: [0.862, 1.018, 0.964, 1.026, 1.679, 1.600, 1.570, 1.32]

        },

        {

            name:'累计销量同比',

            type:'line',

            animationDuration: 2200,

            yAxisIndex:1,

            itemStyle:{

                normal:{

                    color:'#a37ffa',

                }

            },

            label: {

                normal: {

                    show: true,

                    position: 'top',

                    textStyle:{

                        color:'#a37ffa'

                    },

                    /*formatter:function(e){

                        e.data = window.tools.toThousands(parseInt(e.data));

                        e.data = e.data+"%";

                        return e.data;

                    }*/

                }

            },

            smooth: true,

            data: [1.862, 0.318, 1.964, 0.226, 0.679, 0.600, 0.570, 1.5]

        }

    ]

    }

    window.myChart.setOption(option, true);

  </script>

</body>

</html>
市场的详细情况

这里需要的数据结构
var option = {
legend:{
data:[]
},
xAxis:{
data:[]
},
series:[
{data:[],name:""},
{data:[],name:""},
{data:[],name:""},
{data:[],name:""} //前边的长度不定,最后一个为 当月销量同比
]
}
<!DOCTYPE html>
<html lang="en">
<head>
<meta charset="UTF-8">
<title>Document</title>
<script src="https://cdn.bootcss.com/echarts/3.7.1/echarts.js"></script>
</head>
<body>
<div id="app" style="height: 400px">
</div>
<script>
window.myChart = echarts.init(document.querySelector('#app'));
var colors = ['#ffd545','#458bec','#ff8058','#fe63cd','#8b62ff'];
var option = {
tooltip : {
trigger: 'axis',
axisPointer : { // 坐标轴指示器,坐标轴触发有效
type : 'shadow' // 默认为直线,可选为:'line' | 'shadow'
}
},
legend: {
data:['MPV','SUV','SUV-A','销量同比'],
right:'5%'
},
grid: {
left: '3%',
right: '4%',
bottom: '3%',
containLabel: true
},
xAxis : [
{
type : 'category',
data : ['2017-01','2017-02','2017-03','2017-04','2017-05','2017-06','2017-07','2017-08','2017-09','2017-10','2017-11','2017-12']
}
],
yAxis : [
{
type : 'value',
position: 'left',
axisLabel:{
//formatter: '{value}%',
/*formatter:function(e){
return window.tools.toThousands(parseInt(e))+"%"
},*/
textStyle:{
color: '#80848f'
}
},
},
{
axisLabel:{
//formatter: '{value}%',
/*formatter:function(e){
return window.tools.toThousands(parseInt(e))+"%"
},*/
textStyle:{
color: '#80848f'
}
},
splitLine : {
show: false
},
type: 'value',
position: 'right',
min:0.2,
max:2
}
],
series : [
{
name:'MPV',
type:'bar',
stack: '广告',
data:[120, 132, 101, 134, 90, 230, 210,120, 132, 101, 134, 90],
barWidth: '20%',
itemStyle:{
normal:{
color: colors[0]
}
},
label: {
normal: {
show: true,
position: 'top',
textStyle:{
color:colors[0]
},
/*formatter:function(e){
e.data = window.tools.toThousands(parseInt(e.data));
e.data = e.data+"%";
return e.data;
}*/
}
}
},
{
name:'SUV',
type:'bar',
stack: '广告',
data:[220, 182, 191, 234, 290, 330, 310,220, 182, 191, 234, 290],
barWidth: '20%',
itemStyle:{
normal:{
color:colors[1]
}
},
label: {
normal: {
show: true,
position: 'top',
textStyle:{
color:colors[1]
},
/*formatter:function(e){
e.data = window.tools.toThousands(parseInt(e.data));
e.data = e.data+"%";
return e.data;
}*/
}
}
},
{
name:'SUV-A',
type:'bar',
stack: '广告',
data:[150, 232, 201, 154, 190, 330, 410,150, 232, 201, 154, 190],
barWidth: '20%',
itemStyle:{
normal:{
color:colors[2]
}
},
label: {
normal: {
show: true,
position: 'top',
textStyle:{
color:colors[2]
},
/*formatter:function(e){
e.data = window.tools.toThousands(parseInt(e.data));
e.data = e.data+"%";
return e.data;
}*/
}
}
},
{
name:'销量同比',
type:'line',
animationDuration: 2200,
yAxisIndex:1,
itemStyle:{
normal:{
color:'#fc6363',
}
},
label: {
normal: {
show: true,
position: 'top',
textStyle:{
color:'#fc6363'
},
/*formatter:function(e){
e.data = window.tools.toThousands(parseInt(e.data));
e.data = e.data+"%";
return e.data;
}*/
}
},
smooth: true,
data: [0.862, 1.018, 0.964, 1.026, 1.679, 1.600, 1.570, 1.32, 0.964, 1.026, 1.679, 1.600]
}
]
};
window.myChart.setOption(option, true);
</script>
</body>
</html>
3.箱线图

需要的数据结构:
var data = {
//指导价格
"directPrice":[[655,850,940,980,1175],[672.5,800,845,885,1012.5],[780,840,855,880,940],[621.25,767.5,815,865,1011.25],[713.75,807.5,810,870,963.75]],
//市场价格
"marketPrice":[[655,850,940,980,1175],[672.5,800,845,885,1012.5],[780,840,855,880,940],[621.25,767.5,815,865,1011.25],[713.75,807.5,810,870,963.75]],
//主销车价 目前为空
"outliers":[[255,268],[456,399]],
"outliersName":[["name1","name2"],["name3","name4"]],
"axisData":["2017-01","2017-02","2017-03","2017-04","2017-05"]
};
<!DOCTYPE html>

<html lang="en">

<head>

	<meta charset="UTF-8">

	<title>Document</title>

	<script src="https://cdn.bootcss.com/jquery/1.11.1-beta1/jquery.js"></script>

	<script src="https://unpkg.com/echarts@3.7.2/dist/echarts-en.min.js"></script>

</head>

<body>

	<div id="app" style="height: 400px;"></div>

	<script>

		var myEcharts = echarts.init(document.querySelector("#app"));

var data = {

	//指导价格

	"directPrice":[[655,850,940,980,1175],[672.5,800,845,885,1012.5],[780,840,855,880,940],[621.25,767.5,815,865,1011.25],[713.75,807.5,810,870,963.75]],

	//市场价格

	"marketPrice":[[655,850,940,980,1175],[672.5,800,845,885,1012.5],[780,840,855,880,940],[621.25,767.5,815,865,1011.25],[713.75,807.5,810,870,963.75]],

	//主销车价 目前为空

	"outliers":[],

	"axisData":["2017-01","2017-02","2017-03","2017-04","2017-05"]

};

		var option = {

		    tooltip: {

		        trigger: 'item',

		        axisPointer: {

		            type: 'shadow'

		        }

		    },

		    legend: {

		        data:['指导价','市场价','主销车价'],

		        right:'5%'

		    },

		    grid: {

		        left: '10%',

		        right: '10%',

		        bottom: '15%'

		    },

		    xAxis: {

		        type: 'category',

		        data: data.axisData,

		        boundaryGap: true,

		        nameGap: 30,

		        splitArea: {

		            show: false

		        },

		        splitLine: {

		            show: false

		        }

		    },

		    yAxis: {

		        type: 'value',

		        splitArea: {

		            show: true

		        }

		    },

		    series: [

		        {

		            name: '指导价',

		            type: 'boxplot',

		            data: data.boxData1,

		            tooltip: {

		                formatter: function (param) {

		                    return [

		                        'Experiment ' + param.name + ': ',

		                        'upper: ' + param.data[4],

		                        'Q3: ' + param.data[3],

		                        'median: ' + param.data[2],

		                        'Q1: ' + param.data[1],

		                        'lower: ' + param.data[0]

		                    ].join('<br/>')

		                }

		            }

		        },

		        {

		            name: '市场价',

		            type: 'boxplot',

		            data: data.boxData2,

		            tooltip: {

		                formatter: function (param) {

		                    return [

		                        'Experiment ' + param.name + ': ',

		                        'upper: ' + param.data[4],

		                        'Q3: ' + param.data[3],

		                        'median: ' + param.data[2],

		                        'Q1: ' + param.data[1],

		                        'lower: ' + param.data[0]

		                    ].join('<br/>')

		                }

		            }

		        },

		        {

		            name: '主销车价',

		            type: 'scatter',

		            data: data.outliers

		        }

		    ]

		};

		myEcharts.setOption(option);

	</script>

</body>

</html>

<!DOCTYPE html>

<html lang="en">

<head>

    <meta charset="UTF-8">

    <title>Document</title>

    <script src="https://cdn.bootcss.com/jquery/1.11.1-beta1/jquery.js"></script>

    <script src="https://cdn.bootcss.com/echarts/3.7.2/echarts.min.js"></script>

</head>

<body>

    <div id="app" style="height: 400px;">

    </div>

    <script>

        var app = {};

        app.title = '堆叠柱状图';

        var option = {

            tooltip : {

                trigger: 'axis',

                axisPointer : {            // 坐标轴指示器,坐标轴触发有效

                    type : 'shadow'        // 默认为直线,可选为:'line' | 'shadow'

                }

            },

            legend: {

                data:['最低值','最高值','mix最高值']

            },

            grid: {

                left: '3%',

                right: '4%',

                bottom: '3%',

                containLabel: true

            },

            xAxis : [

                {

                    type : 'category',

                    data : ['2016-01','2016-02','2016-03','2016-04','2016-05','2016-06','2016-07']

                }

            ],

            yAxis : [

                {

                    type : 'value'

                }

            ],

            series : [

                {

                    name:'最低值',

                    type:'scatter',

                    data:[, , , , , , ]

                },

                {

                    name:'最高值',

                    type:'scatter',

                    stack: '广告',

                    data:[, , , , , , ]

                },

                {

                    name:'mix最高值',

                    type:'scatter',

                    stack: '广告',

                    data:[, , , , , , ]

                }

            ]

        };

        var myEcharts = echarts.init(document.querySelector("#app"));

        myEcharts.setOption(option);

    </script>

</body>

</html>
a
redflag的echarts结构的更多相关文章
- 26、首先通过javascript包的异步加载来学习echarts包的结构
1.在这里先写一写前言,今天在公司搞定了一个对于滚动条进行定位的case,明天开始做TestManagement. 首先大家先来一起看一看流行的javascript文件的加载方式,这里采用别人博客上的 ...
- knockout+echarts实现图表展示
一.需要学习的知识 knockout, require, director, echarts, jquery.简单的入一下门,网上的资料很多,最直接就是进官网校习. 二.效果展示 三.require的 ...
- Echarts 之二——地市联动数据统计
一.简介 通过地图可以更直观地展示各个地区的统计数据,能够更清楚地进行数据分析.有些场景下,我们不仅仅需要对每个地市进行统计分析.更需要对地市一下的区县进行数据统计,并进行联动.此事我们可以通过Ech ...
- ECharts学习(1)--简单图表的绘制
1.获取ECharts 官网 下载:http://echarts.baidu.com/download.html 2.在html页面中引入ECharts文件 <!DOCTYPE html> ...
- echarts基础 handleIcon 设置
1.自己引入echarts库 2.找到代码中dataZoom中的handleIcon ,看见对应的是"M0,0 v9.7h5 v-9.7h-5 Z",这是由svg画出来的图形,其中 ...
- 图表插件使用汇总(echarts,highchairts)
1.echarts之饼图显示数字 option={ title: { text: '某站点用户访问来源', subtext: '纯属虚构', x: 'center' }, tooltip: { tri ...
- echarts .NET类库开源
前言: 2012年从长沙跑到深圳,2016年又从深圳回到长沙,兜兜转转一圈,又回到了原点.4年在深圳就呆了一家公司,回长沙也是因为深圳公司无力为继,长沙股东老板挽留,想想自己年纪也不小了.就回来了,在 ...
- 初识echarts
show一个demo而已
- echarts入门基础,画柱型图
注意:一定要自己引入echarts库 <!DOCTYPE html> <html> <head> <meta charset="UTF-8" ...
随机推荐
- 【题解】Luogu P3217 [HNOI2011]数矩形
原题链接:P3217 [HNOI2011]数矩形 什么??!怎么又是计算几何,您钛毒瘤了-- 这道题真的是毒瘤 凸包?旋转卡壳? 看一下数据,N<=1500? 暴力 没错,就是暴力,N^2没毛病 ...
- 理解 neutron
之前大师发个结构图. understanding_neutron.pdf 自己走读了代码: 1. get_extensions_path() # 在/opt/stack/neutron/neutro ...
- DDos攻击的常见方法及防御方法
什么是DDoS? DDoS是英文Distributed Denial of Service的缩写,意即“分布式拒绝服务”,那么什么又是拒绝服务(Denial of Service)呢?可以这么理解,凡 ...
- Iterator和Iterable的区别以及使用
Iterator和Iterable的区别以及使用 1.什么是迭代器 迭代器(iterator)是一种对象,它能够用来遍历标准模板库容器中的部分或全部元素,每个迭代器对象代表容器中的确定的地址.迭代 ...
- 前缀和与差分之IncDec sequence
参考链接:https://blog.csdn.net/hzk_cpp/article/details/80407014 题目链接:https://www.acwing.com/problem/cont ...
- c和c++main函数的参数
1.代码 int main(int argc,char **argv[]) { ; } 2.分析 argc:代码参数个数 argv:二级指针,很多个字符串,这里代表参数列表 3.分析 这个代码最终被编 ...
- 并发 --- 2 进程的方法,进程锁 守护进程 数据共享 进程队列, joinablequeue模型
一.进程的其他方法 1. .name 进程名 (可指定) 2. .pid 进程号 3. os.getpid 在什么位置就是什么的进程号 4. .is ...
- Java 使用命令对堆线程分析
一.dump基本概念 在故障定位(尤其是out of memory)和性能分析的时候,经常会用到一些文件来帮助我们排除代码问题.这些文件记录了JVM运行期间的内存占用.线程执行等情况,这就是我们常说的 ...
- (转)Jenkins持续集成
(二期)14.持续集成工具jenkins [课程14]持续集...概念.xmind0.6MB [课程14]持续集成...kins.xmind43.3KB [课程14预习]持续...kins.xmind ...
- JQ插入节点方法
1.append() appendTo() prepend() prependTo() 2. before() insertBefore() after() insertAfter()
