Python3绘图库Matplotlib(01)
1 First plots with Matplotlib
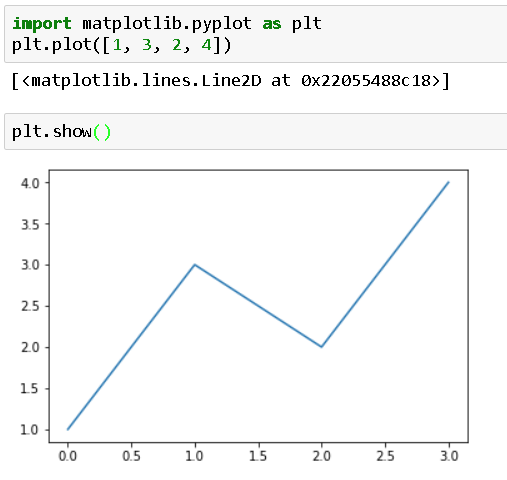
简单的绘图1
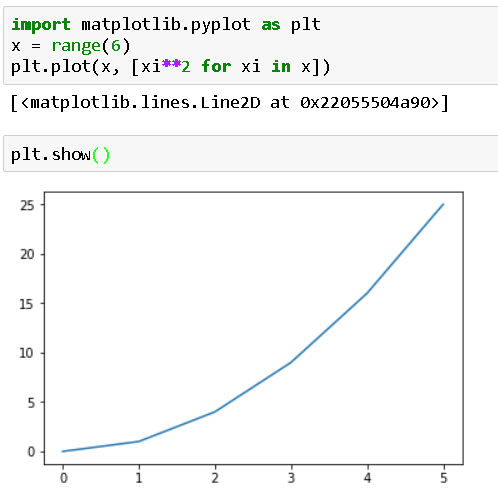
简单的绘图2
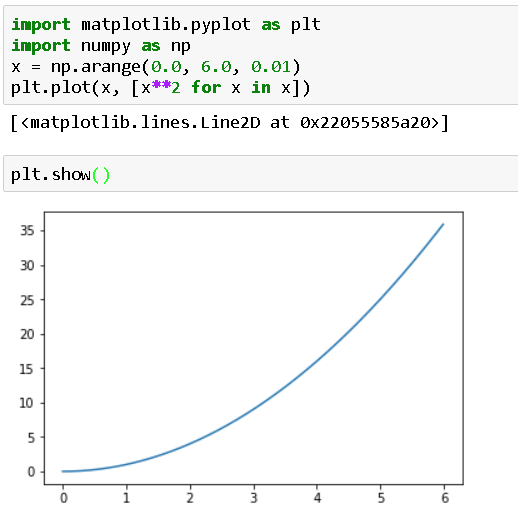
简单的绘图3
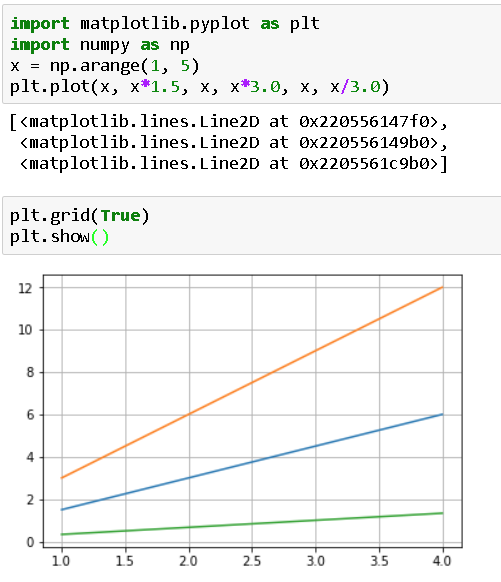
2 网格 = grid
3 设置坐标轴的取值范围 = axis xlim ylim
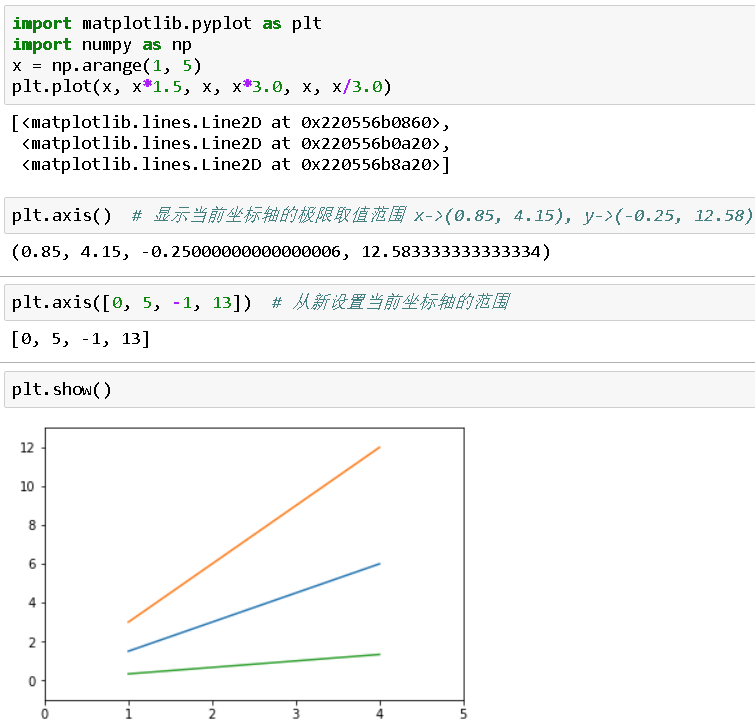
方法1:整体设置
方法2:分别设置
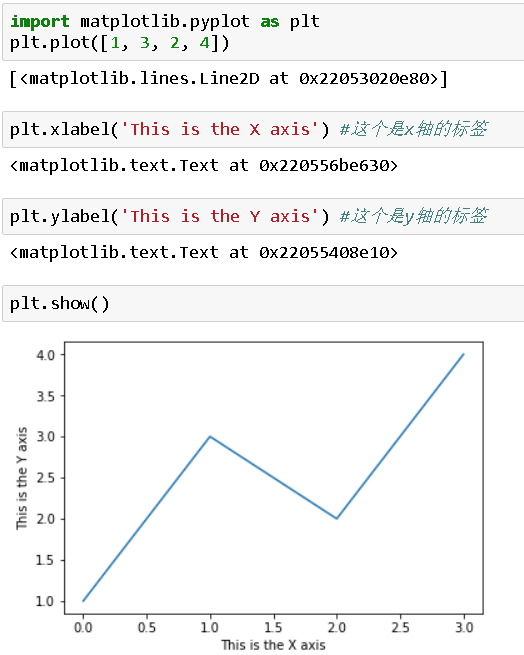
4 设置坐标含义标签 = label
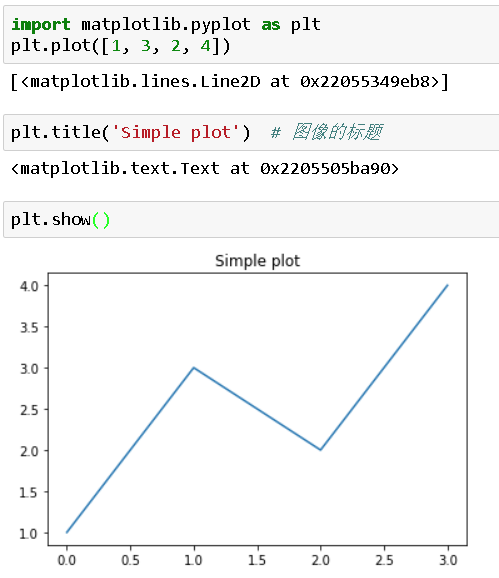
5 设置图片的整体标题 = title
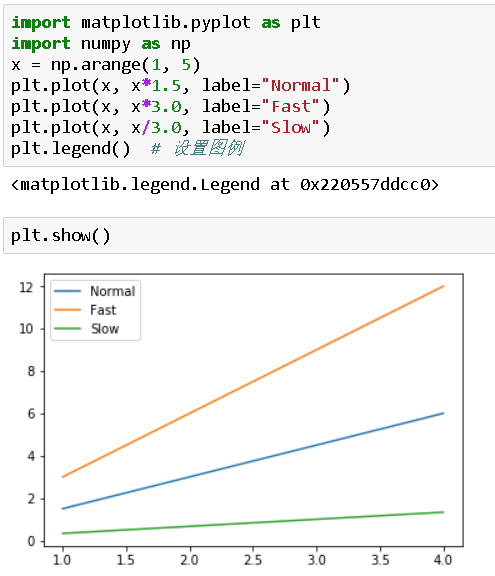
6 设置图例 = legend
方法2:
图例的位置参数:loc = Code
| String | Code |
| best | 0 |
| upper right | 1 |
| upper left | 2 |
| lower left | 3 |
| lower right | 4 |
| right | 5 |
| center left | 6 |
| center right | 7 |
| lower center | 8 |
| upper center | 9 |
| center | 10 |
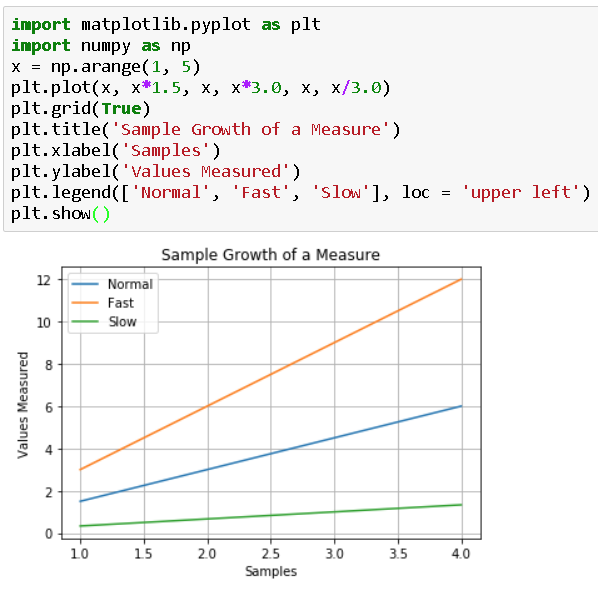
7 一副完整的图像
8 保存图片 = savefig
import matplotlib.pyplot as plt

plt.plot([1, 2, 3])

plt.savefig("plot123.png")

plt.savefig('plot123_2.png', dpi=200)

#

import matplotlib as mpl

mpl.rcParams['figure.figsize']

mpl.rcParams['savefig.dpi']

mpl.reParams['Agg']
9 本小结所有代码示例
import matplotlib.pyplot as plt

plt.plot([1, 3, 2, 4])

plt.show()

import matplotlib.pyplot as plt

x = range(6)

plt.plot(x, [xi**2 for xi in x])

plt.show()

import matplotlib.pyplot as plt

import numpy as np

x = np.arange(0.0, 6.0, 0.01)

plt.plot(x, [x**2 for x in x])

plt.show()

import matplotlib.pyplot as plt

import numpy as np

x = np.arange(1, 5)

plt.plot(x, x*1.5, x, x*3.0, x, x/3.0)

plt.grid(True)

plt.show()

import matplotlib.pyplot as plt

import numpy as np

x = np.arange(1, 5)

plt.plot(x, x*1.5, x, x*3.0, x, x/3.0)

plt.axis() # 显示当前坐标轴的极限取值范围 x->(0.85, 4.15), y->(-0.25, 12.58)

plt.axis([0, 5, -1, 13]) # 从新设置当前坐标轴的范围

plt.show()

import matplotlib.pyplot as plt

plt.plot([1, 3, 2, 4])

plt.xlabel('This is the X axis') #这个是x轴的标签

plt.ylabel('This is the Y axis') #这个是y轴的标签

plt.show()

import matplotlib.pyplot as plt

plt.plot([1, 3, 2, 4])

plt.title('Simple plot') # 图像的标题

plt.show()

import matplotlib.pyplot as plt

import numpy as np

x = np.arange(1, 5)

plt.plot(x, x*1.5, label="Normal")

plt.plot(x, x*3.0, label="Fast")

plt.plot(x, x/3.0, label="Slow")

plt.legend() # 设置图例

plt.show()

import matplotlib.pyplot as plt

import numpy as np

x = np.arange(1, 5)

plt.plot(x, x*1.5, x, x*3.0, x, x/3.0)

plt.grid(True)

plt.title('Sample Growth of a Measure')

plt.xlabel('Samples')

plt.ylabel('Values Measured')

plt.legend(['Normal', 'Fast', 'Slow'], loc = 'upper left')

plt.show()

import matplotlib.pyplot as plt

plt.plot([1, 2, 3])

plt.savefig("plot123.png")

import matplotlib as mpl

mpl.rcParams['figure.figsize']

mpl.rcParams['savefig.dpi']

plt.savefig('plot123_2.png', dpi=200)
知识在于点点滴滴的积累,我会在这个路上Go ahead,
后记:打油诗一首
适度锻炼,量化指标
考量天气,设定目标
科学锻炼,成就体标
高效科研,实现学标
Python3绘图库Matplotlib(01)的更多相关文章
- Python3绘图库Matplotlib(02)
控制颜色 Color Color Name b blue c cyan g green k black m magenta r red w white y yellow plt.plot(x1, y1 ...
- Python 绘图库Matplotlib入门教程
0 简单介绍 Matplotlib是一个Python语言的2D绘图库,它支持各种平台,并且功能强大,能够轻易绘制出各种专业的图像. 1 安装 pip install matplotlib 2 入门代码 ...
- python 绘图库 Matplotlib
matplotlib官方文档 使用Matplotlib,能够轻易生成各种图像,例如:直方图.波谱图.条形图.散点图等. 入门代码实例 import matplotlib.pyplot as plt i ...
- 数据可视化:绘图库-Matplotlib
为什么要绘图? 一个图表数据的直观分析,下面先看一组北京和上海上午十一点到十二点的气温变化数据: 数据: 这里我用一段代码生成北京和上海的一个小时内每分钟的温度如下: import random co ...
- windows环境下,用python绘图库matplotlib绘图时中文乱码问题
1.下载中文字体(看自己爱好就行)下面这个举例: SimHei - Free Font Downloadwww.fontpalace.co 2.下载之后,打开即可安装,将字体安装进windows系统 ...
- 【Matplotlib-01】Python 绘图库 Matplotlib 入门教程
环境: Windows10 python3.6.4 numpy1.14.1 matplotlib2.1.2 工具:Cmder 目录: 1.线性图 2.散点图 3.饼状图 4.条形图 5.直方图 例1: ...
- 『科学计算』科学绘图库matplotlib学习之绘制动画
基础 1.matplotlib绘图函数接收两个等长list,第一个作为集合x坐标,第二个作为集合y坐标 2.基本函数: animation.FuncAnimation(fig, update_poin ...
- Ubuntu下安装Python绘图库Matplotlib的方法
在安装好Python的基础上, sudo apt-get install python-numpy sudo apt-get install python-scipy sudo apt-get ins ...
- 『科学计算』科学绘图库matplotlib练习
思想:万物皆对象 作业 第一题: import numpy as np import matplotlib.pyplot as plt x = [1, 2, 3, 1] y = [1, 3, 0, 1 ...
随机推荐
- machine_desc结构体【转】
转自:http://blog.csdn.net/myarrow/article/details/8609564 1. 简介 内核提供了一个重要的结构体struct machine_desc ,这个结构 ...
- Tengine HTTPS原理解析、实践与调试【转】
本文邀请阿里云CDN HTTPS技术专家金九,分享Tengine的一些HTTPS实践经验.内容主要有四个方面:HTTPS趋势.HTTPS基础.HTTPS实践.HTTPS调试. 一.HTTPS趋势 这一 ...
- springmvc和mybatis整合关键配置
springmvc+mybaits的系统架构: 第一步:整合dao层 mybatis和spring整合,通过spring管理mapper接口. 使用mapper的扫描器自动扫描mapper接口在spr ...
- centos6.5环境自动化运维之puppet实现nginx反向代理功能及puppet安装配置详解
puppet是一种Linux.Unix.windows平台的集中配置管理系统,使用自有的puppet描述语言,可管理配置文件.用户.cron任务.软件包.系统服务等.puppet把这些系统实体称之为资 ...
- eclipse:刪除空行
ctrl+F:選擇正則,輸入:^\s*\n ,點擊 replace all.
- Linux中断处理(一)
最近在研究异步消息处理, 突然想起linux内核的中断处理, 里面由始至终都贯穿着"重要的事马上做, 不重要的事推后做"的异步处理思想. 于是整理一下~~第一阶段--获取中断号每个 ...
- labelImg:no module named pyqt4
最新版的labelImg安装会出错,改变环境变量,在python3.5中就可以了 参考 shaform :https://github.com/tzutalin/labelImg/issues/106
- Redis五大数据类型以及操作
目录: 一.redis的两种链接方式 二.redis的字符串操作(string) 三.redis的列表操作(list) 四.redis的散列表操作(类似于字典里面嵌套字典) 五.redis的集合操作( ...
- LeetCode(43):字符串相乘
Medium! 题目描述: 给定两个以字符串形式表示的非负整数 num1 和 num2,返回 num1 和 num2 的乘积,它们的乘积也表示为字符串形式. 示例 1: 输入: num1 = &quo ...
- JQuery中的工具类(五)
一:1.serialize()序列表表格内容为字符串.返回值jQuery示例序列表表格内容为字符串,用于 Ajax 请求. HTML 代码:<p id="results"&g ...