《DSP using MATLAB》Problem 2.2

1、代码:
%% ------------------------------------------------------------------------

%%            Output Info about this m-file

fprintf('\n***********************************************************\n');

fprintf('        <DSP using MATLAB> Problem 2.2.1 \n\n');

time_stamp = datestr(now, 31);

[wkd1, wkd2] = weekday(today, 'long');

fprintf('      Now is %20s, and it is %7s  \n\n', time_stamp, wkd2);

%% ------------------------------------------------------------------------

num = 100000;

x1 = 0 + (2-0)*rand(num,1);

x_axis = min(x1):0.02:max(x1);

figure('NumberTitle', 'off', 'Name', 'Problem 2.2.1 hist');

set(gcf,'Color','white');

%hist(x1,x_axis);

hist(x1,100);

title('Uniformly Distributed Random Numbers (using hist)');

xlabel('n'); ylabel('x1(n)'); grid on;

figure('NumberTitle', 'off', 'Name', 'Problem 2.2.1 bar');

set(gcf,'Color','white');

%[counts,binlocal] = hist(x1, x_axis);

[counts,binlocal] = hist(x1, 100);

counts = counts/num;

bar(binlocal, counts, 1); title('Uniformly Distributed Random Numbers (using bar)');

xlabel('n'); ylabel('x1(n)'); grid on;
运行结果:


2、代码:
%% ------------------------------------------------------------------------
%% Output Info about this m-file
fprintf('\n***********************************************************\n');
fprintf(' <DSP using MATLAB> Problem 2.2.2 \n\n'); time_stamp = datestr(now, 31);
[wkd1, wkd2] = weekday(today, 'long');
fprintf(' Now is %20s, and it is %7s \n\n', time_stamp, wkd2);
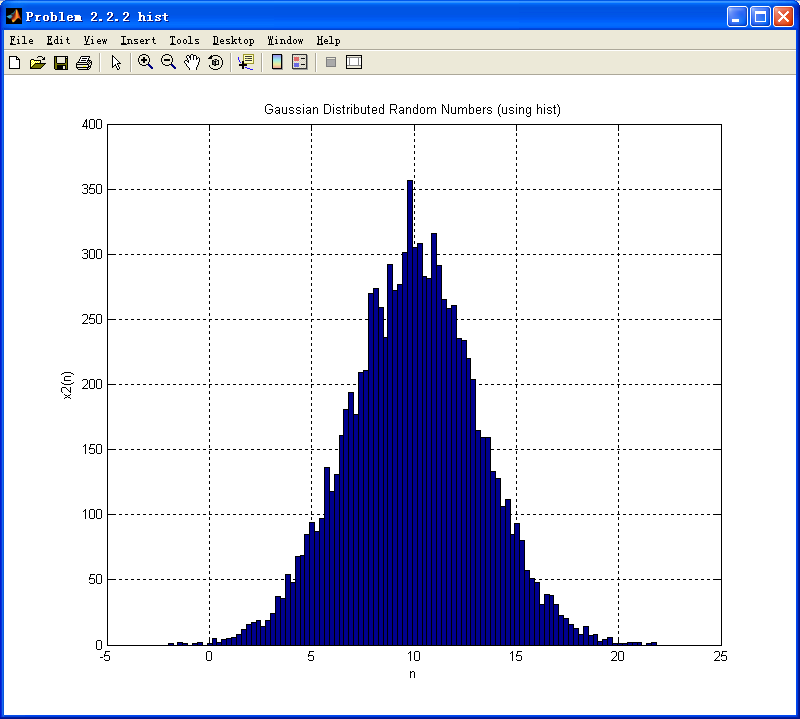
%% ------------------------------------------------------------------------ num = 10000; mean_val=10; variance=10;
x2 = mean_val + sqrt(variance)*randn(num,1);
x_axis = min(x2):0.02:max(x2); figure('NumberTitle', 'off', 'Name', 'Problem 2.2.2 hist');
set(gcf,'Color','white');
%hist(x1,x_axis);
hist(x2,100);
title('Gaussian Distributed Random Numbers (using hist)');
xlabel('n'); ylabel('x2(n)'); grid on; figure('NumberTitle', 'off', 'Name', 'Problem 2.2.2 bar');
set(gcf,'Color','white');
%[counts,binlocal] = hist(x1, x_axis);
[counts,binlocal] = hist(x2, 100);
counts = counts/num;
bar(binlocal, counts, 1); title('Gaussian Distributed Random Numbers (using bar)');
xlabel('n'); ylabel('x2(n)'); grid on;
运行结果:

3、代码:
%% ------------------------------------------------------------------------

%%            Output Info about this m-file

fprintf('\n***********************************************************\n');

fprintf('        <DSP using MATLAB> Problem 2.2.3 \n\n');

time_stamp = datestr(now, 31);

[wkd1, wkd2] = weekday(today, 'long');

fprintf('      Now is %20s, and it is %7s  \n\n', time_stamp, wkd2);

%% ------------------------------------------------------------------------

num = 100000;  n_x1 = 0:num-1;

x1 = 0 + (2-0)*rand(num,1);

%x_axis = min(x2):0.02:max(x2);

[x11,n_x11] = sigshift(x1,n_x1,1)

[x3,n_x3] = sigadd (x1, n_x1, x11, n_x11)

%% -------------------------------- START --------------------------------------------

%  x1(n)'s hist and bar function

figure('NumberTitle', 'off', 'Name', 'Problem 2.2.3');

set(gcf,'Color','white');

hist(x1,100);

title('Uniformly Distributed Random Numbers (using hist)');

xlabel('n'); ylabel('x1(n)'); grid on;

figure('NumberTitle', 'off', 'Name', 'Problem 2.2.3');

set(gcf,'Color','white');

[counts,binlocal] = hist(x1, 100);

counts = counts/num;

bar(binlocal, counts, 1); title('Uniformly Distributed Random Numbers (using bar)');

xlabel('n'); ylabel('x1(n)'); grid on;

%% ---------------------------------- END ------------------------------------------------

%% -------------------------------- START --------------------------------------------

%   x3(n) = x1(n) + x1(n-1)   hist and bar function

figure('NumberTitle', 'off', 'Name', 'Problem 2.2.3');

set(gcf,'Color','white');

hist(x3,100);

title('Uniformly Distributed Random Numbers (using hist)');

xlabel('n'); ylabel('x3(n)'); grid on;

figure('NumberTitle', 'off', 'Name', 'Problem 2.2.3');

set(gcf,'Color','white');

[counts,binlocal] = hist(x3, 100);

counts = counts/num;

bar(binlocal, counts, 1); title('Uniformly Distributed Random Numbers (using bar)');

xlabel('n'); ylabel('x3(n)'); grid on;

%% ---------------------------------- END ------------------------------------------------
运行结果:


两个均匀分布的序列相加,结果呈现三角形分布了。
4、代码:
%% ------------------------------------------------------------------------

%%            Output Info about this m-file

fprintf('\n***********************************************************\n');

fprintf('        <DSP using MATLAB> Problem 2.2.4 \n\n');

time_stamp = datestr(now, 31);

[wkd1, wkd2] = weekday(today, 'long');

fprintf('      Now is %20s, and it is %7s  \n\n', time_stamp, wkd2);

%% ------------------------------------------------------------------------

num = 100000;  n_y = 0:num-1;

y1 = -0.5 + (0.5+0.5)*rand(num,1);

y2 = -0.5 + (0.5+0.5)*rand(num,1);

y3 = -0.5 + (0.5+0.5)*rand(num,1);

y4 = -0.5 + (0.5+0.5)*rand(num,1);

%x_axis = min(x2):0.02:max(x2);

[x41,n_y11] = sigadd (y1, n_y, y2, n_y);

[x42,n_y12] = sigadd (y3, n_y, y4, n_y);

[x4,n_x4] = sigadd (x41, n_y11, x42, n_y12);

%% -------------------------------- START --------------------------------------------

%  x1(n)'s hist and bar function

figure('NumberTitle', 'off', 'Name', 'Problem 2.2.4');

set(gcf,'Color','white');

hist(y1,100);

title('Uniformly Distributed Random Numbers (using hist)');

xlabel('n'); ylabel('y1(n)'); grid on;

figure('NumberTitle', 'off', 'Name', 'Problem 2.2.4');

set(gcf,'Color','white');

[counts,binlocal] = hist(y1, 100);

counts = counts/num;

bar(binlocal, counts, 1); title('Uniformly Distributed Random Numbers (using bar)');

xlabel('n'); ylabel('y1(n)'); grid on;

%% ---------------------------------- END ------------------------------------------------

%% -------------------------------- START --------------------------------------------

%   x3(n) = x1(n) + x1(n-1)   hist and bar function

figure('NumberTitle', 'off', 'Name', 'Problem 2.2.4');

set(gcf,'Color','white');

hist(x4,100);

title('Uniformly Distributed Random Numbers (using hist)');

xlabel('n'); ylabel('x4(n)'); grid on;

figure('NumberTitle', 'off', 'Name', 'Problem 2.2.4');

set(gcf,'Color','white');

[counts,binlocal] = hist(x4, 100);

counts = counts/num;

bar(binlocal, counts, 1); title('Uniformly Distributed Random Numbers (using bar)');

xlabel('n'); ylabel('x4(n)'); grid on;

%% ---------------------------------- END ------------------------------------------------
运行结果:


4个均匀分布的随机序列相加,呈现正态分布的特征了。
《DSP using MATLAB》Problem 2.2的更多相关文章
- 《DSP using MATLAB》Problem 7.27
代码: %% ++++++++++++++++++++++++++++++++++++++++++++++++++++++++++++++++++++++++++++++++ %% Output In ...
- 《DSP using MATLAB》Problem 7.26
注意:高通的线性相位FIR滤波器,不能是第2类,所以其长度必须为奇数.这里取M=31,过渡带里采样值抄书上的. 代码: %% +++++++++++++++++++++++++++++++++++++ ...
- 《DSP using MATLAB》Problem 7.25
代码: %% ++++++++++++++++++++++++++++++++++++++++++++++++++++++++++++++++++++++++++++++++ %% Output In ...
- 《DSP using MATLAB》Problem 7.24
又到清明时节,…… 注意:带阻滤波器不能用第2类线性相位滤波器实现,我们采用第1类,长度为基数,选M=61 代码: %% +++++++++++++++++++++++++++++++++++++++ ...
- 《DSP using MATLAB》Problem 7.23
%% ++++++++++++++++++++++++++++++++++++++++++++++++++++++++++++++++++++++++++++++++ %% Output Info a ...
- 《DSP using MATLAB》Problem 7.16
使用一种固定窗函数法设计带通滤波器. 代码: %% ++++++++++++++++++++++++++++++++++++++++++++++++++++++++++++++++++++++++++ ...
- 《DSP using MATLAB》Problem 7.15
用Kaiser窗方法设计一个台阶状滤波器. 代码: %% +++++++++++++++++++++++++++++++++++++++++++++++++++++++++++++++++++++++ ...
- 《DSP using MATLAB》Problem 7.14
代码: %% ++++++++++++++++++++++++++++++++++++++++++++++++++++++++++++++++++++++++++++++++ %% Output In ...
- 《DSP using MATLAB》Problem 7.13
代码: %% ++++++++++++++++++++++++++++++++++++++++++++++++++++++++++++++++++++++++++++++++ %% Output In ...
- 《DSP using MATLAB》Problem 7.12
阻带衰减50dB,我们选Hamming窗 代码: %% ++++++++++++++++++++++++++++++++++++++++++++++++++++++++++++++++++++++++ ...
随机推荐
- 《Clean Code》一书回顾
<Clean Code>一书从翻开至今,已经差不多两个月的时间了,尽管刨去其中的假期,算下来实在是读得有点慢.阅读期间,断断续续的做了不少笔记.之前,每每在读完了一本技术书籍之后,其中的诸 ...
- 数据结构顺序表Java实现
Java实现顺序表算法:1:首先我们需要定义我们的接口,关于顺序表的一些基本的操作:顺序表中的操作都有增删改查. //List接口 public interface IList { //返回线性表的大 ...
- 如何使用代码备份SQL Server数据库
1.添加引用 using Microsoft.SqlServer.Management.Smo; using Microsoft.SqlServer.Management.Common; 2. Bac ...
- BZOJ:3832: [Poi2014]Rally
题意: 给出$DAG$,询问删掉哪个点之后最长路径最短 思路: 我们令$f[x]$表示从最远的点到达它的距离,$g[x]$表示它能够到达最远的点的距离 那么对于$(x -> y)$一条边来说,它 ...
- Python 字符串转换为日期
应用程序接受字符串格式的输入,但是你想将它们转换为datetime 对象以便在上面执行非字符串操作. 使用Python 的标准模块datetime 可以很容易的解决这个问题.比如: >>& ...
- inline用法详解
(一)inline函数(摘自C++ Primer的第三版) 在函数声明或定义中函数返回类型前加上关键字inline即把min()指定为内联. inline int min(int first, int ...
- [one day one question] GIF动画为什么只动一次不能循环
问题描述: GIF动画为什么只动一次不能循环,这怎么破? 解决方案: Photoshop打开Gif文件,Ctrl+Shift+Alt+S,弹出保存页面选项,选择右下角动画:循环选项:一次=>永远 ...
- java第八天
p41~p45: 1.区别前缀式与后缀式. public class Test { public static void main(String[] args) { int i = 1; System ...
- Java集合转有类型的数组之toArray(T[] a)
在java变成中慎用强制类型转换,尽量使用类自带的转换函数或泛型.先看一行代码 错误方法: String[] array= (String[]) list.toArray(); 如果list中存放的是 ...
- 导入tensorflow:ImportError: libcublas.so.9.0: cannot open shared object file: No such file or director【转】
本文转载自:https://blog.csdn.net/ksws0292756/article/details/80034086 版权声明:本文为博主原创文章,转载请一定附上博主原文链接,并署名转自Z ...