gnuplot examples
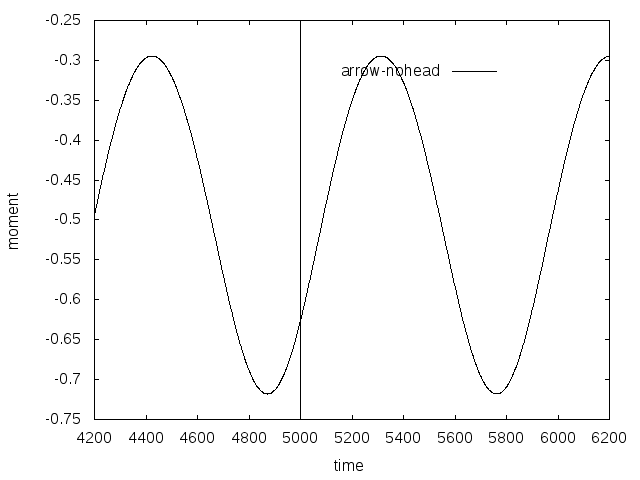
add dashed vertical line
#set terminal pdf

#set output 'c_p_tsr5.5_sine_udf_e387.pdf'

set terminal postscript eps enhanced color font 20 size 8in, 6in

set out 'vertical_line.eps'

#set terminal X11

set autoscale

unset log

unset label

unset pm3d

set key at graph .8, .9

set key spacing 1.2

set xtic auto

set ytic auto

set xlabel  "time"

set xrange [*:*]

# r0 initial pulse

set yrange [*:*]

set ylabel "moment"

set style line 1 lt 1 lc rgb "black" lw 1

set style line 2 lt 2 lc rgb "red" lw 4

set style line 3 lt 3 lc rgb "purple" lw 3

set style line 4 lt 4 lc rgb "blue" lw 3

set style line 5 lt 5 lc rgb "black" lw 2

set style line 6 lt 6 lc rgb "brown" lw 3

# vertical line

set arrow 1 from 5000,-0.75 to 5000,-0.25 nohead dt "."

plot "cm-sine-udf.out"  using 1:3 t "arrow-nohead" ls 1 with lines
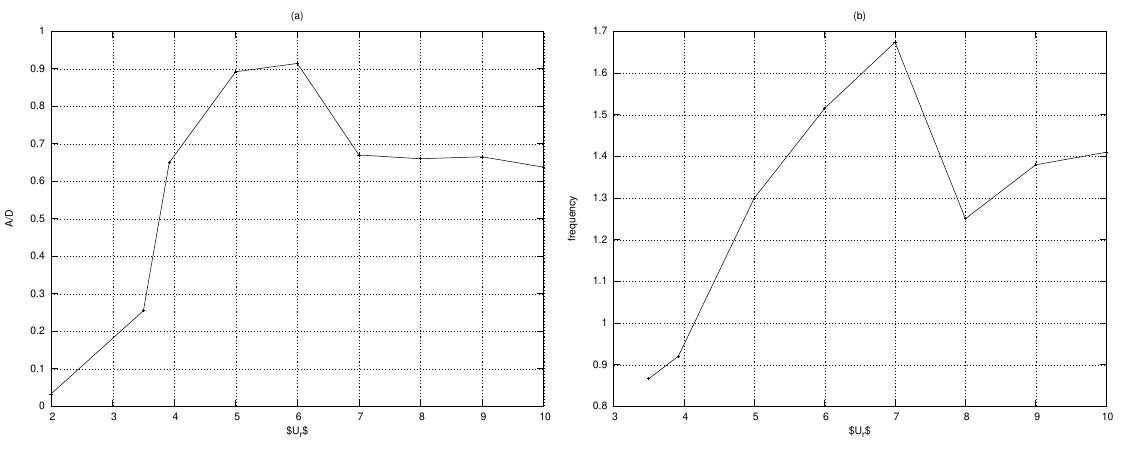
two figures side by side
# multiplot
#set terminal svg  font "Arial"enhanced size 700, 600

#set output "multiplt1.svg"

# eps

set terminal postscript eps font 10 size 7.5in, 6in

set out 'multiplt1.eps'

set style line 1  linecolor rgb "black"  linewidth 1.000 lt 1 pointtype 1 ps 0.5

set style line 2  linecolor rgb "black"  linewidth 2.000 lt 2 pointtype 3 ps 0.

set size 1.0, 0.5

set origin 0.0, 0.0

set multiplot

set grid

unset key

set angles radians

set samples 250

#####################  -- figure 1

set xtic auto

set ytic auto

set size 0.5, 0.5

set origin 0.0, 0.0

set title "(a)"

set xlabel "$U_r$"

set ylabel "A/D"

set label 1 "Damping =.1,.2,.3,.4,.5,.707,1.0,2.0" at .14,17

set xrange [*:*]

set yrange [*:*]

plot  "amp.txt"  using 1:8 t "0.0"  ls 1 with linespoints

#######################  -- figure 2

set xtic auto

set ytic auto

set size 0.5,0.5

set origin 0.5,0.0

set title "(b)"

set label 1 ""

set xlabel "$U_r$"

set ylabel "frequency"

set xrange [*:*]

set yrange [*:*]

plot  "fre.txt"  using 1:2 title "0.005"  ls 1 with linespoints

unset multiplot
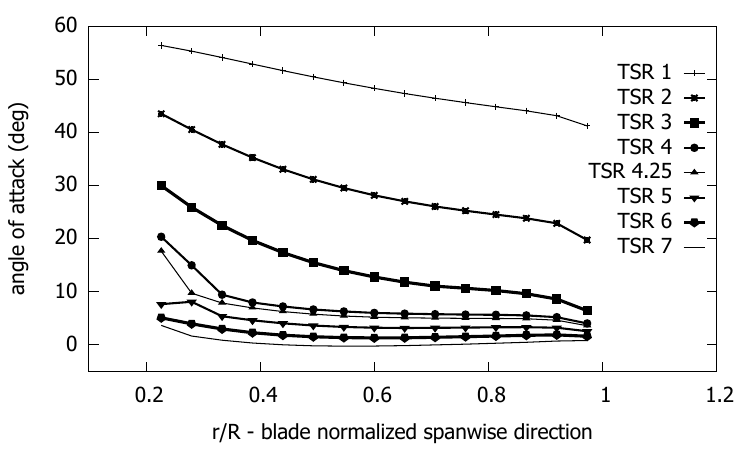
single plot
Code:
# set terminal jpeg

# set output 'alfa_epp_a7.jpg'

# set terminal postscript eps font 20

# set out 'alfa_tsr_e387.eps'

set terminal pdf

set output 'alfa_tsr_e387.pdf'

# set terminal X11

set autoscale

unset log

unset label

unset pm3d

set key ins vert

set key samplen 1

set key at graph 1, 0.9

set key spacing 1

set xtic auto

set ytic auto

set xlabel  "r/R - blade normalized spanwise direction"

set xrange [0.1:1.2]

# r0 initial pulse

set yrange [-5:*]

set ylabel "angle of attack (deg)"

set style line 1  linecolor rgb "black"  linewidth 1.000 lt 1 pointtype 1 ps 0.5

set style line 2  linecolor rgb "black"  linewidth 2.000 lt 2 pointtype 3 ps 0.5

set style line 3  linecolor rgb "black"  linewidth 3.000 lt 3 pointtype 5 ps 0.5

set style line 4  linecolor rgb "black"  linewidth 2.000 lt 4 pointtype 7 ps 0.5

set style line 5  linecolor rgb "black"  linewidth 1.000 lt 5 pointtype 9 ps 0.5

set style line 6  linecolor rgb "black"  linewidth 2.000 lt 6 pointtype 11 ps 0.5

set style line 7  linecolor rgb "black"  linewidth 3.000 lt 7  pointtype 13 ps 0.5

set style line 7  linecolor rgb "black"  linewidth 3.000 lt 7  pointtype 15 ps 0.5

plot "e387_bem/fort.101"  using 1:2 t "TSR 1" ls 1 with linespoints,\

"e387_bem/fort.105"  using 1:2 t "TSR 2" ls 2 with linespoints ,\

"e387_bem/fort.110" using 1:2 t "TSR 3" ls 3 with linespoints ,\

"e387_bem/fort.114" using 1:2 t "TSR 4" ls 4 with linespoints ,\

"e387_bem/fort.115" using 1:2 t "TSR 4.25" ls 5 with linespoints ,\

"e387_bem/fort.118" using 1:2 t "TSR 5" ls 6 with linespoints ,\

"e387_bem/fort.122" using 1:2 t "TSR 6" ls 7 with linespoints ,\

"e387_bem/fort.127" using 1:2 t "TSR 7" ls 8 with lines
output:
Code
#set terminal jpeg
#set output 'alfa.jpg'
set terminal postscript eps font 24
set out 'U_vs_X_tsr5.eps'
#set terminal X11
set autoscale
unset log
unset label
unset pm3d
set key at graph .99, .58
set key spacing 1
set xtic auto
set ytic auto
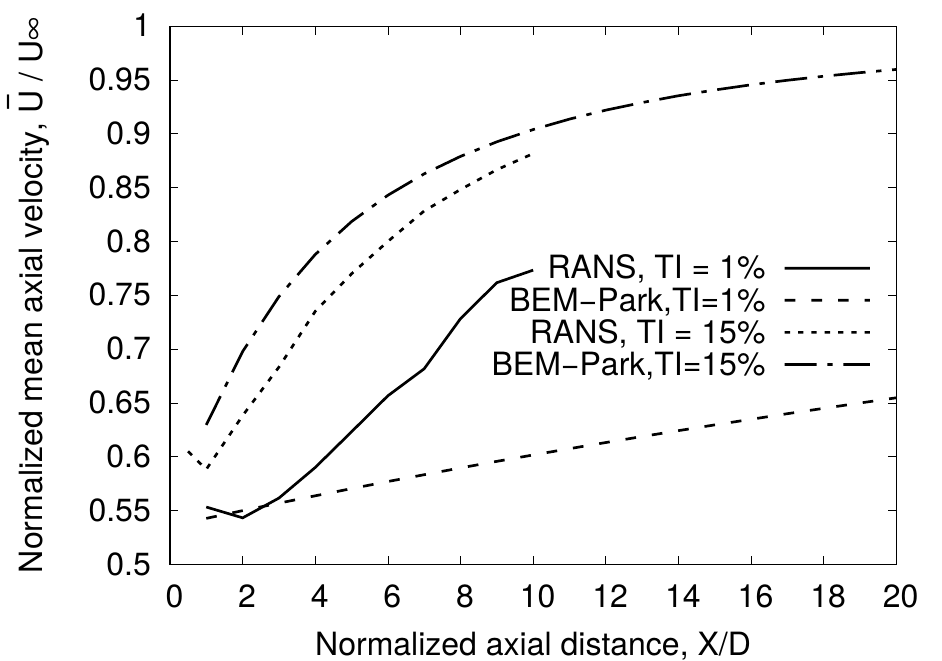
set xlabel "Normalized axial distance, X/D"
set xrange [*:*]
# r0 initial pulse
set yrange [*:*]
set ylabel "Normalized mean axial velocity, ~U{0.8-} / U{/Symbol \245}"
set style line 1 lt 1 lc rgb "black" lw 4 pt 1 ps 2
set style line 2 lt 2 lc rgb "black" lw 4 pt 3 ps 2
set style line 3 lt 3 lc rgb "black" lw 4 pt 5 ps 2
set style line 4 lt 4 lc rgb "black" lw 4 pt 7 ps 2
set style line 5 lt 5 lc rgb "black" lw 4
set style line 6 lt 6 lc rgb "brown" lw 4
#set label 1 "TSR 5" at graph .8, .9
plot "cfd/area_averaged_axial_mean_velocity_TI_1.txt" using 1:6 t "RANS, TI = 1%" ls 1 with lines,\
"park_model/wave_axial_velocity_tsr5_park_TI_1.txt" using 1:2 t "BEM-Park,TI=1%" ls 2 with lines,\
"cfd/area_averaged_axial_mean_velocity_TI_15.txt" using 1:6 t "RANS, TI = 15%" ls 3 with lines,\
"park_model/wave_axial_velocity_tsr5_park_TI_15.txt" using 1:2 t "BEM-Park,TI=15%" ls 4 with lines
example 2
important code
set key out horiz center top
#set terminal jpeg
#set output 'coeff_epp.jpg'
#set terminal png
#set output 'coeff_epp.png'
set terminal postscript eps font 24
set out 'coeff_naca0012.eps'
#set terminal X11
set autoscale
unset log
unset label
unset pm3d
set key out horiz center top
set xtic auto
set ytic auto
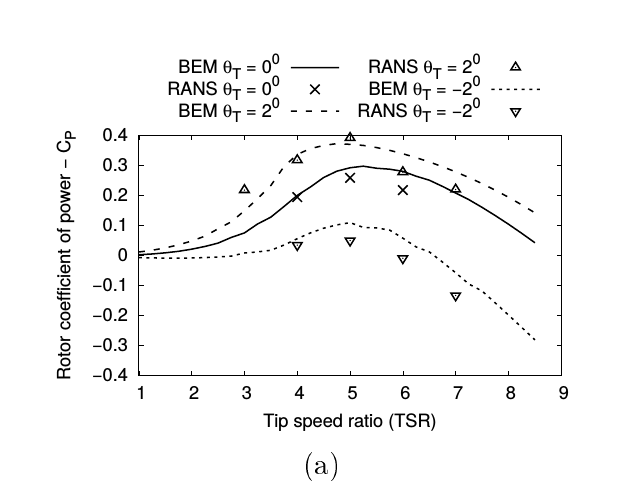
set xlabel "Tip speed ratio (TSR)"
set xrange [1:*]
# r0 initial pulse
set yrange [-0.4:0.4]
set ylabel "Rotor coefficient of power - C_P"
set style line 1 lt 1 lc rgb "black" lw 4 pointtype 2 pointsize 2
set style line 2 lt 2 lc rgb "black" lw 4 pointtype 7 pointsize 2
set style line 3 lt 3 lc rgb "black" lw 4 pointtype 6 pointsize 2
set style line 4 lt 4 lc rgb "black" lw 4 pointtype 8 pointsize 2
set style line 5 lt 5 lc rgb "black" lw 4 pointtype 10 pointsize 2
set style line 6 lt 6 lc rgb "brown" lw 4 pointtype 12 pointsize 2
set pointsize 2
set bars 3
plot "naca0012/re_135k/zero/coeff.plt" using 1:4 t "BEM {/Symbol q}_T = 0^{0}" ls 1 with lines ,\
"RANS/Cp_Ct_tsr_one_untwist.dat" using 1:2 t "RANS {/Symbol q}_T = 0^{0}" ls 1 with points ,\
"naca0012/re_135k/fwd_2/coeff.plt" using 1:4 t "BEM {/Symbol q}_T = 2^{0}" ls 2 with lines,\
"RANS/Cp_one_front_eldad_blade.dat" using 1:2 t "RANS {/Symbol q}_T = 2^{0}" ls 4 with points,\
"naca0012/re_135k/rear_2/coeff.plt" using 1:4 t "BEM {/Symbol q}_T = -2^{0}" ls 3 with lines,\
"RANS/Cp_Ct_tsr_one_rear.dat" using 1:2 t "RANS {/Symbol q}_T = -2^{0}" ls 5 with points
gnuplot examples的更多相关文章
- NS3 利用Gnuplot生成拥塞窗口例子fifth.cc的png图像
参考链接:一个ns-3的Gnuplot例子 命令: (1)首先将fifth.cc拷贝到scratch目录下(由于环境变量的因素,./waf编译只对scratch目录下的文件有效,也可以忽略此步,直接. ...
- Js: Extensible Calendar Examples
http://ext.ensible.comhttps://github.com/bmoeskau/Extensiblehttps://github.com/TeamupCom/extensibleh ...
- Selenium Xpath Tutorials - Identifying xpath for element with examples to use in selenium
Xpath in selenium is close to must required. XPath is element locator and you need to provide xpath ...
- https://github.com/chenghuige/tensorflow-exp/blob/master/examples/sparse-tensor-classification/
https://github.com/chenghuige/tensorflow-exp/blob/master/examples/sparse-tensor-classification/ ...
- gnuplot: 一种更为简洁的曲线,柱状图绘图软件
gnuplot: 一种更为简洁的曲线,柱状图绘图软件 gnuplot: 一种更为简洁的曲线,柱状图绘图软件 Zhong Xiewei Wed Jun 25 gnuplot简单介绍 关于gnuplot的 ...
- (转载)SQL Reporting Services (Expression Examples)
https://msdn.microsoft.com/en-us/library/ms157328(v=SQL.100).aspx Expressions are used frequently in ...
- Examples of MIB Variables - SNMP Tutorial
30.5 Examples of MIB Variables Versions 1 and 2 of SNMP each collected variables together in a singl ...
- DataBinding examples
Databinding in Windows Forms demo (CSWinFormDataBinding) /************************************* Modu ...
- https://developers.google.com/maps/documentation/javascript/examples/places-autocomplete-addressform
https://developers.google.com/maps/documentation/javascript/examples/places-autocomplete-addressform
随机推荐
- 洛谷P1155 双栈排序——思路题
题目:https://www.luogu.org/problemnew/show/P1155 思路... 看博客:https://www.cnblogs.com/Narh/p/9213825.html ...
- Google Closure Compiler 高级模式及更多思考(转)
前言 Google Closure Compiler 是 Google Closure Tools 的一员,在 2009 年底被 Google 释出,早先,有 玉伯 的 Closure Compile ...
- Android下载资源
下面提供了源码下载地址,供有兴趣的朋友下载, android音乐播放器源码 由于本人才疏学浅,有很多地方不够完善,希望大家指证. 免费下载地址在 http://linux.linuxidc.com ...
- bzoj 1623: [Usaco2008 Open]Cow Cars 奶牛飞车【排序+贪心】
从小到大排个序,然后能选就选 #include<iostream> #include<cstdio> #include<algorithm> using names ...
- 矩阵取数游戏 2007年NOIP全国联赛提高组(dp+高精)
矩阵取数游戏 2007年NOIP全国联赛提高组 时间限制: 1 s 空间限制: 128000 KB 题目等级 : 黄金 Gold 题目描述 Description [问题描述]帅帅经常跟 ...
- 浅谈算法——splay
BST(二叉查找树)是个有意思的东西,种类巨TM多,然后我们今天不讲其他的,我们今天就讲splay 首先,如果你不知道Splay是啥,你也得知道BST是啥 如上图就是一棵优美的BST,它对于每个点保证 ...
- 模拟 URAL 1149 Sinus Dances
题目传送门 /* 模拟:找到规律分别输出就可以了,简单但是蛮有意思的 */ #include <cstdio> #include <algorithm> #include &l ...
- UML中类之间的关系
UML中类之间的关系分为以下几种:依赖.关联.泛化.聚合.组合. 依赖是指一个类使用了另一个类,它是一种使用关系,描述了一个事物的规格说明的变化可能会影响到使用它的另一个事物(反之不一定).最常见的依 ...
- json常识
转载网址:http://developer.51cto.com/art/201704/536386.htm 我们先来看一个JS中常见的JS对象序列化成JSON字符串的问题. 请问:以下JS对象通过 ...
- LN : leetcode 538 Convert BST to Greater Tree
lc 538 Convert BST to Greater Tree 538 Convert BST to Greater Tree Given a Binary Search Tree (BST), ...