【集群监控】JMX exporter+Prometheus+Grafana监控Hadoop集群
下载jmx_exporter的jar包
创建配置文件namenode.yaml(datanode.yaml)放在任意位置,内容为你想要的metrics
参考配置:
- ---
- startDelaySeconds:
- hostPort: master:1234 #master为本机IP(一般可设置为localhost);1234为想设置的jmx端口(可设置为未被占用的端口)
- #jmxUrl: service:jmx:rmi:///jndi/rmi://127.0.0.1:1234/jmxrmi
- ssl: false
- lowercaseOutputName: false
- lowercaseOutputLabelNames: false
其他参数参考:
| Name | Description |
|---|---|
| startDelaySeconds | start delay before serving requests. Any requests within the delay period will result in an empty metrics set. |
| hostPort | The host and port to connect to via remote JMX. If neither this nor jmxUrl is specified, will talk to the local JVM. |
| username | The username to be used in remote JMX password authentication. |
| password | The password to be used in remote JMX password authentication. |
| jmxUrl | A full JMX URL to connect to. Should not be specified if hostPort is. |
| ssl | Whether JMX connection should be done over SSL. To configure certificates you have to set following system properties:-Djavax.net.ssl.keyStore=/home/user/.keystore-Djavax.net.ssl.keyStorePassword=changeit-Djavax.net.ssl.trustStore=/home/user/.truststore-Djavax.net.ssl.trustStorePassword=changeit |
| lowercaseOutputName | Lowercase the output metric name. Applies to default format and name. Defaults to false. |
| lowercaseOutputLabelNames | Lowercase the output metric label names. Applies to default format and labels. Defaults to false. |
| whitelistObjectNames | A list of ObjectNames to query. Defaults to all mBeans. |
| blacklistObjectNames | A list of ObjectNames to not query. Takes precedence over whitelistObjectNames. Defaults to none. |
| rules | A list of rules to apply in order, processing stops at the first matching rule. Attributes that aren't matched aren't collected. If not specified, defaults to collecting everything in the default format. |
| pattern | Regex pattern to match against each bean attribute. The pattern is not anchored. Capture groups can be used in other options. Defaults to matching everything. |
| attrNameSnakeCase | Converts the attribute name to snake case. This is seen in the names matched by the pattern and the default format. For example, anAttrName to an_attr_name. Defaults to false. |
| name | The metric name to set. Capture groups from the pattern can be used. If not specified, the default format will be used. If it evaluates to empty, processing of this attribute stops with no output. |
| value | Value for the metric. Static values and capture groups from the pattern can be used. If not specified the scraped mBean value will be used. |
| valueFactor | Optional number that value (or the scraped mBean value if value is not specified) is multiplied by, mainly used to convert mBean values from milliseconds to seconds. |
| labels | A map of label name to label value pairs. Capture groups from pattern can be used in each. name must be set to use this. Empty names and values are ignored. If not specified and the default format is not being used, no labels are set. |
| help | Help text for the metric. Capture groups from pattern can be used. name must be set to use this. Defaults to the mBean attribute decription and the full name of the attribute. |
| type | The type of the metric, can be GAUGE, COUNTER or UNTYPED. name must be set to use this. Defaults to UNTYPED. |
修改$HADOOP_HOME/etc/hadoop/hadoop-env.sh
NameNode节点添加:
- export HADOOP_NAMENODE_OPTS="-Dcom.sun.management.jmxremote.authenticate=false -Dcom.sun.management.jmxremote.ssl=false -Dcom.sun.management.jmxremote.local.only=false -Dcom.sun.management.jmxremote.port=1234 $HADOOP_NAMENODE_OPTS "
DataNode节点添加:
- export HADOOP_DATANODE_OPTS="-Dcom.sun.management.jmxremote.authenticate=false -Dcom.sun.management.jmxremote.ssl=false -Dcom.sun.management.jmxremote.local.only=false -Dcom.sun.management.jmxremote.port=1235 $HADOOP_DATANODE_OPTS "
提示:
端口1234(1235)要与之前设置的jmx端口保持一致
修改
$HADOOP_HOME/bin/hdfs
- export HADOOP_NAMENODE_OPTS="$HADOOP_NAMENODE_OPTS -javaagent:/home/hadoop/jmx_prometheus_javaagent-0.3.1.jar=9200:/home/hadoop/namenode.yaml"
- export HADOOP_DATANODE_OPTS="$HADOOP_DATANODE_OPTS -javaagent:/home/hadoop/jmx_prometheus_javaagent-0.3.1.jar=9300:/home/hadoop/datanode.yaml"
提示:9200(9300)为jmx_exporter提供metrics数据端口,后续Prometheus从此端口获取数据
访问http://master:9200/metrics就能获得需要的metrics数据:
- # HELP jvm_buffer_pool_used_bytes Used bytes of a given JVM buffer pool.
- # TYPE jvm_buffer_pool_used_bytes gauge
- jvm_buffer_pool_used_bytes{pool="direct",} 1181032.0
- jvm_buffer_pool_used_bytes{pool="mapped",} 0.0
- # HELP jvm_buffer_pool_capacity_bytes Bytes capacity of a given JVM buffer pool.
- # TYPE jvm_buffer_pool_capacity_bytes gauge
- jvm_buffer_pool_capacity_bytes{pool="direct",} 1181032.0
- jvm_buffer_pool_capacity_bytes{pool="mapped",} 0.0
- # HELP jvm_buffer_pool_used_buffers Used buffers of a given JVM buffer pool.
...
下载Prometheus
https://prometheus.io/download/
解压
修改配置文件 prometheus.yml
添加
- - job_name: hadoop-master
- static_configs:
- - targets: ['localhost:9200']
- - job_name: hadoop-slave1
- static_configs:
- - targets: ['slave1:9300']
运行
- ./prometheus
http://master:9090/targets查看是否添加成功
成功则增加master,slave1
如下图
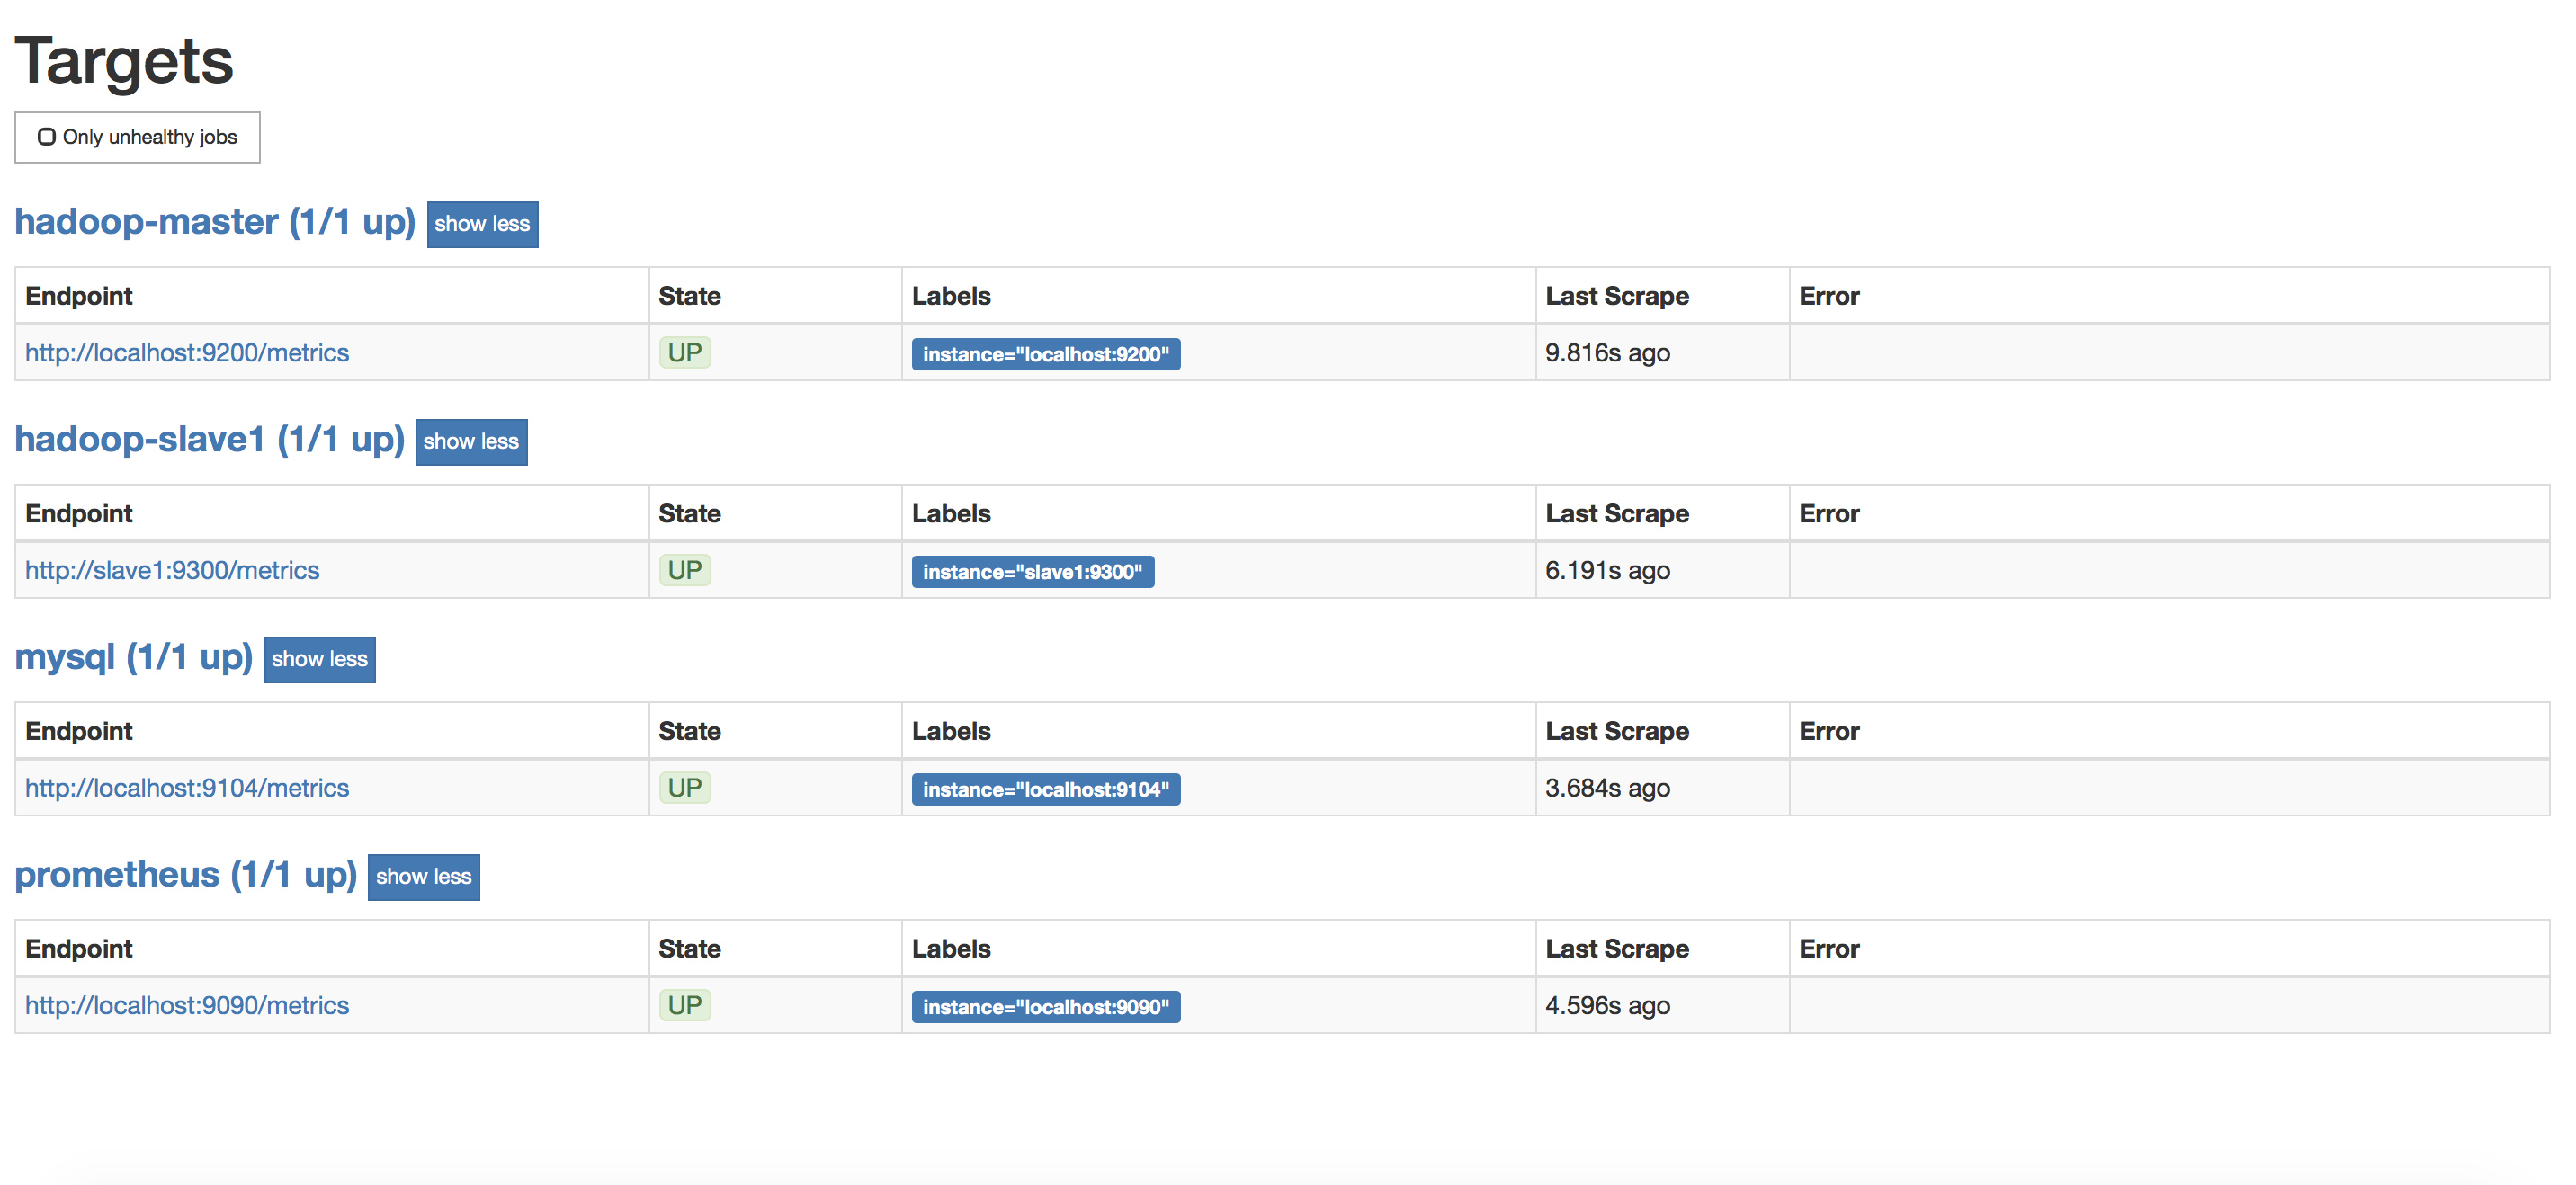
通过点击http://localhost:9200/metrics可以看到metrics数据
下载Grafana
https://grafana.com/grafana/download?platform=linux
安装相应版本grafana
启动grafana
- systemctl start grafana-server
启动后,即可通过http://master:3000/来访问了(默认账号密码是admin/admin)
如下图

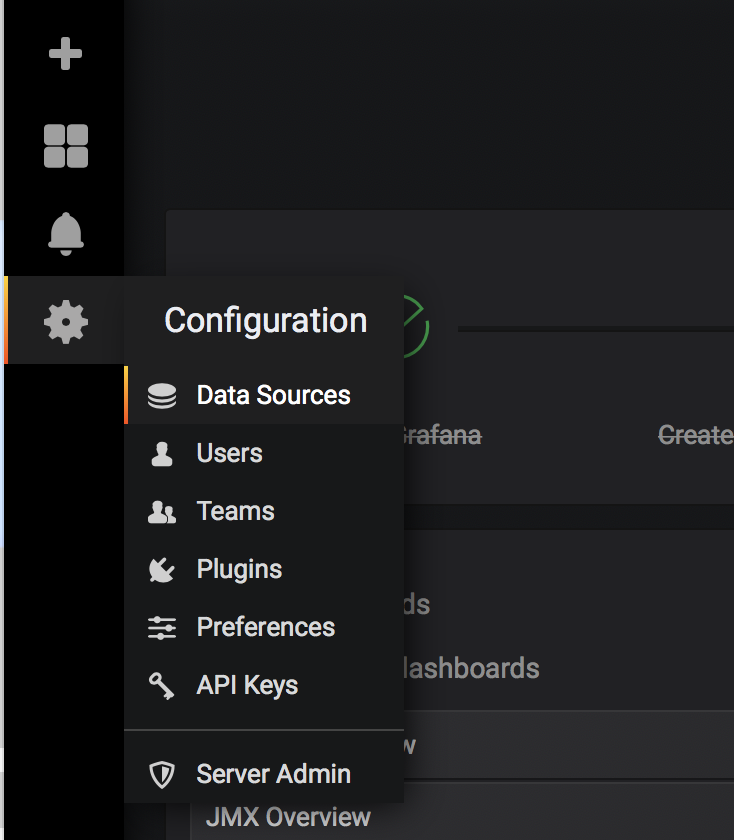
关联Grafana和Prometheus
点击Data Sources
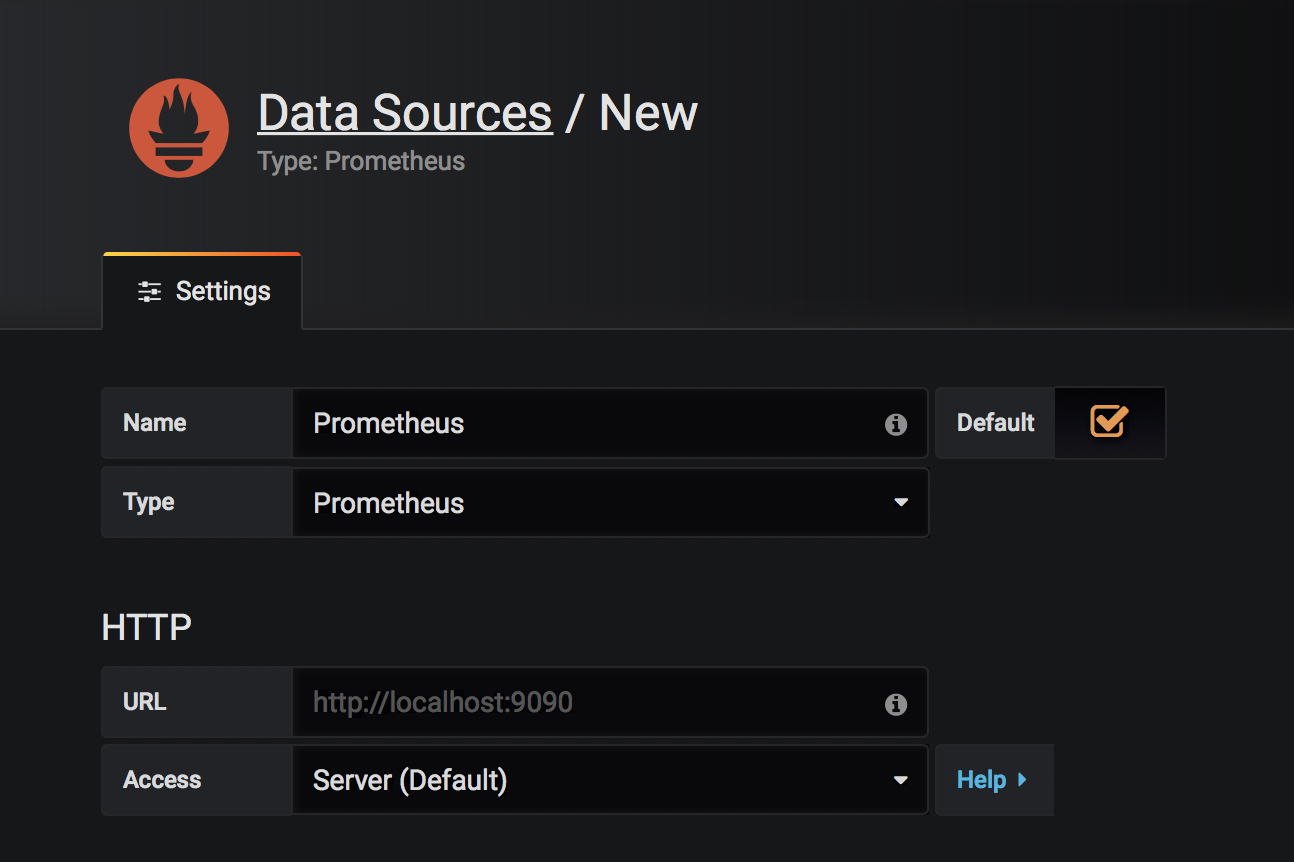
点击Add data source,填写数据保存
添加一个dashboard,如下图进入dashboard导入页面
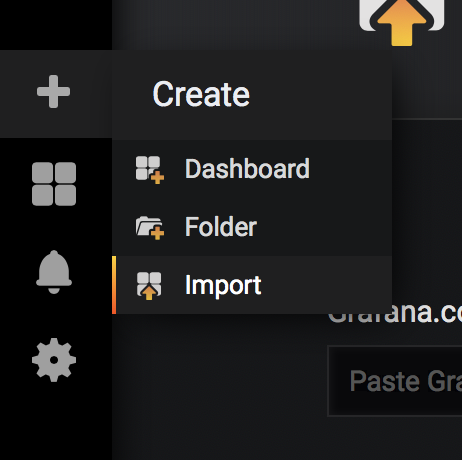
点击Upload .json File,导入模版(可从https://grafana.com/dashboards下载)

导入成功后可以看到类似如下效果,完成!

【集群监控】JMX exporter+Prometheus+Grafana监控Hadoop集群的更多相关文章
- k8s集群监控 cadvisor/exporter+prometheus+grafana
### k8s监控处理 ### 1.cadvisor/exporter+prometheus+grafana 安装#### 1.1 配置nfs安装```shellubuntu: nfs 服务器 apt ...
- cAdvisor+Prometheus+Grafana监控docker
cAdvisor+Prometheus+Grafana监控docker 一.cAdvisor(需要监控的主机都要安装) 官方地址:https://github.com/google/cadvisor ...
- [转帖]Prometheus+Grafana监控Kubernetes
原博客的位置: https://blog.csdn.net/shenhonglei1234/article/details/80503353 感谢原作者 这里记录一下自己试验过程中遇到的问题: . 自 ...
- Prometheus + Grafana 监控系统搭
本文主要介绍基于Prometheus + Grafana 监控Linux服务器. 一.Prometheus 概述(略) 与其他监控系统对比 1 Prometheus vs. Zabbix Zabbix ...
- Prometheus+Grafana监控SpringBoot
Prometheus+Grafana监控SpringBoot 一.Prometheus监控SpringBoot 1.1 pom.xml添加依赖 1.2 修改application.yml配置文件 1. ...
- Prometheus+Grafana监控Kubernetes
涉及文件下载地址:链接:https://pan.baidu.com/s/18XHK7ex_J0rzTtfW-QA2eA 密码:0qn6 文件中需要下载的镜像需要自己提前下载好,eg:prom/node ...
- prometheus+grafana监控mysql
prometheus+grafana监控mysql 1.安装配置MySQL官方的 Yum Repository(有mysql只需设置监控账号即可) [root@localhost ~]# wget - ...
- [转帖]安装prometheus+grafana监控mysql redis kubernetes等
安装prometheus+grafana监控mysql redis kubernetes等 https://www.cnblogs.com/sfnz/p/6566951.html plug 的模式进行 ...
- prometheus+grafana监控redis
prometheus+grafana监控redis redis安装配置 https://www.cnblogs.com/autohome7390/p/6433956.html redis_export ...
随机推荐
- ios5与ios7数字输入样式一致
<input name="activeCode" id="activeCode" ontouchstart="this.type='numbe ...
- HTML(五)列表,区块,布局,表单和输入
HTML 列表 无序列表 Coffee Tea Milk 默认是圆点,也可以 圆圈 正方形 有序列表 Coffee Tea Milk Coffee Tea Milk 默认是用数字排序 大写字母 小写字 ...
- atcode E - guruguru(思维+前缀)
题目链接:http://arc077.contest.atcoder.jp/tasks/arc077_c 题解:一道思维题.不容易想到类似区间求和具体看一下代码. #include <iostr ...
- 使用Elastic APM监控你的.NET Core应用
作者:Jax 前言 在应用实际的运维过程中,我们需要更多的日志和监控来让我们对自己的应用程序的运行状况有一个全方位的了解.然而对于大部分开发者而言,平时大家所关注的更多的是如何更优雅的实现业务,或者是 ...
- VS Code 前端开发常用快捷键插件
一.vs code 的常用快捷键 1.注释:a) 单行注释:[ctrl+k,ctrl+c] 或 ctrl+/ b) 取消单行注释:[ctrl+k,ctrl+u] (按下ctrl不放,再按k + u) ...
- C#开发BIMFACE系列27 服务端API之获取模型数据12:获取构件分类树
系列目录 [已更新最新开发文章,点击查看详细] BIMFACE官方示例中,加载三维模型后,模型浏览器中左上角默认提供了“目录树”的功能,清晰地展示了模型的完整构成及上下级关系. 本篇介绍如何获 ...
- SpringBoot应用启动过程分析
真的好奇害死猫!之前写过几个SpringBoot应用,但是一直没搞明白应用到底是怎么启动的,心里一直有点膈应.好吧,趁有空去看了下源码,写下这篇博客作为学习记录吧! 个人拙见,若哪里有理解不对的地方, ...
- lambda表达式与匿名内部类与双冒号(::)
lambda表达式在只有一条代码时还可以引用其他方法或构造器并自动调用,可以省略参数传递,代码更加简洁,引用方法的语法需要使用::符号.lambda表达式提供了四种引用方法和构造器的方式: 引用对象的 ...
- SpringDataJpa——JpaRepository查询功能(转)
1.JpaRepository支持接口规范方法名查询.意思是如果在接口中定义的查询方法符合它的命名规则,就可以不用写实现,目前支持的关键字如下. Keyword Sample JPQL snippet ...
- linux 常用压缩、解压命令
.tar.gz 解压为 tar -zxvf xx.tar.gz 压缩为 tar -zcvf target.tar.gz ./src_dir zip 解压为 ...