docker-compose 快速部署Prometheus之服务端并监控ceph cluster 使用钉钉webhook 报警
现在环境是这样:
ceph 4台:
192.168.100.21 ceph-node1
192.168.100.22 ceph-node2
192.168.100.23 ceph-node3
192.168.100.25 ceph-node5
#已经部署好一个ceph cluster 集群 四个 osd 三个mon 没有使用块存储所有没有mod
监控服务端一台
192.168.100.26 Grafana 上面都是以容器部署了
Prometheus:
Grafana:
alertmanager:
prometheus-webhook-alert:
cAdvisor:
docker-compose 编排如下:
version: ""

networks:

    monitor:

        driver: bridge

services:

  prometheus:

    image: prom/prometheus

    container_name: prometheu

    hostname: prometheu

    restart: always

    volumes:

    - /Prometheus/config/prometheus.yml:/etc/prometheus/prometheus.yml

    - ./config/alertmanager-rule.yml:/etc/prometheus/alertmanager-rule.yml

    - /etc/localtime:/etc/localtime

    ports:

    - "9090:9090"

    networks:

    - monitor

  prometheus-webhook-alert:

    image: timonwong/prometheus-webhook-dingtalk:v0.3.0

    container_name: prometheus-webhook-alertmanagers

    hostname: webhook-alertmanagers

    restart: always

    volumes:

    - /etc/localtime:/etc/localtime

    ports:

    - "8060:8060"

    entrypoint: /bin/prometheus-webhook-dingtalk --ding.profile="webhook1=https://****#钉钉webhook自己去申请一个"

    networks:

    - monitor

  alertmanager:

    image: prom/alertmanager

    container_name: alertmanager

    hostname: alertmanager

    restart: always

    volumes:

      - ./config/alertmanager.yml:/etc/alertmanager/alertmanager.yml

      - /etc/localtime:/etc/localtime

    ports:

      - "9093:9093"

    networks:

      - monitor

  grafana:

    image: grafana/grafana

    container_name: grafana

    hostname: grafana

    restart: always

    volumes:

    - /etc/localtime:/etc/localtime

    - ./grafana-piechart:/var/lib/grafana/plugins/grafana-piechart-panel

    ports:

    - "3000:3000"

    networks:

    - monitor

  cadvisor:

    image: google/cadvisor:latest

    container_name: cadvisor

    hostname: cadvisor

    restart: always

    volumes:

    - /:/rootfs:ro

    - /var/run:/var/run:rw

    - /sys:/sys:ro

    - /var/lib/docker/:/var/lib/docker:ro

    - /etc/localtime:/etc/localtime

    ports:

    - "8080:8080"

    networks:

    - monitor
几处关键配置文件如下:
#普罗米修斯配置文件
cat ./config/prometheus.yml
# my global config

global:

  scrape_interval:     15s # Set the scrape interval to every  seconds. Default is every  minute.

  evaluation_interval: 15s # Evaluate rules every  seconds. The default is every  minute.

# Alertmanager configuration

alerting:

  alertmanagers:

  - static_configs:

    - targets: ["192.168.100.26:9093"]

# Load rules once and periodically evaluate them according to the global 'evaluation_interval'.

rule_files:

  - "alertmanager-rule.yml"

scrape_configs:

  # The job name is added as a label `job=<job_name>` to any timeseries scraped from this config.

  - job_name: 'prometheus'

    static_configs:

    - targets: ['192.168.100.26:9090']

  - job_name: 'cadvisor-1'

    static_configs:

    - targets: ['192.168.100.26:8080']

  - job_name: 'node-1'

    scrape_interval: 4s

    static_configs:

    - targets: ['192.168.100.26:9100']

  - job_name: 'cadvisor-2'

    static_configs:

    - targets: ['192.168.100.25:8080']

  - job_name: 'node-2'

    scrape_interval: 4s

    static_configs:

    - targets: ['192.168.100.25:9100']

  - job_name: 'ceph'

    scrape_interval: 4s

    static_configs:

    - targets: ['192.168.100.21:9128']
#监控报警组件 压制 合并 过滤配置文件 并配置webhook地址
cat ./config/alertmanager.yml
global:

  resolve_timeout: 5m

route:

  group_by: ['alertname']

  group_wait: 10s

  group_interval: 10s

  repeat_interval: 1h

  receiver: 'web.hook'

receivers:

- name: 'web.hook'

  webhook_configs:

  - url: 'http://192.168.100.26:8060/dingtalk/webhook1/send'

    send_resolved: true

inhibit_rules:

  - source_match:

      severity: 'critical'

    target_match:

      severity: 'warning'

    equal: ['alertname', 'dev', 'instance']
#监控报警规则配置文件
cat ./alertmanager-rule.yml
groups:
- name: ceph-rule
rules:
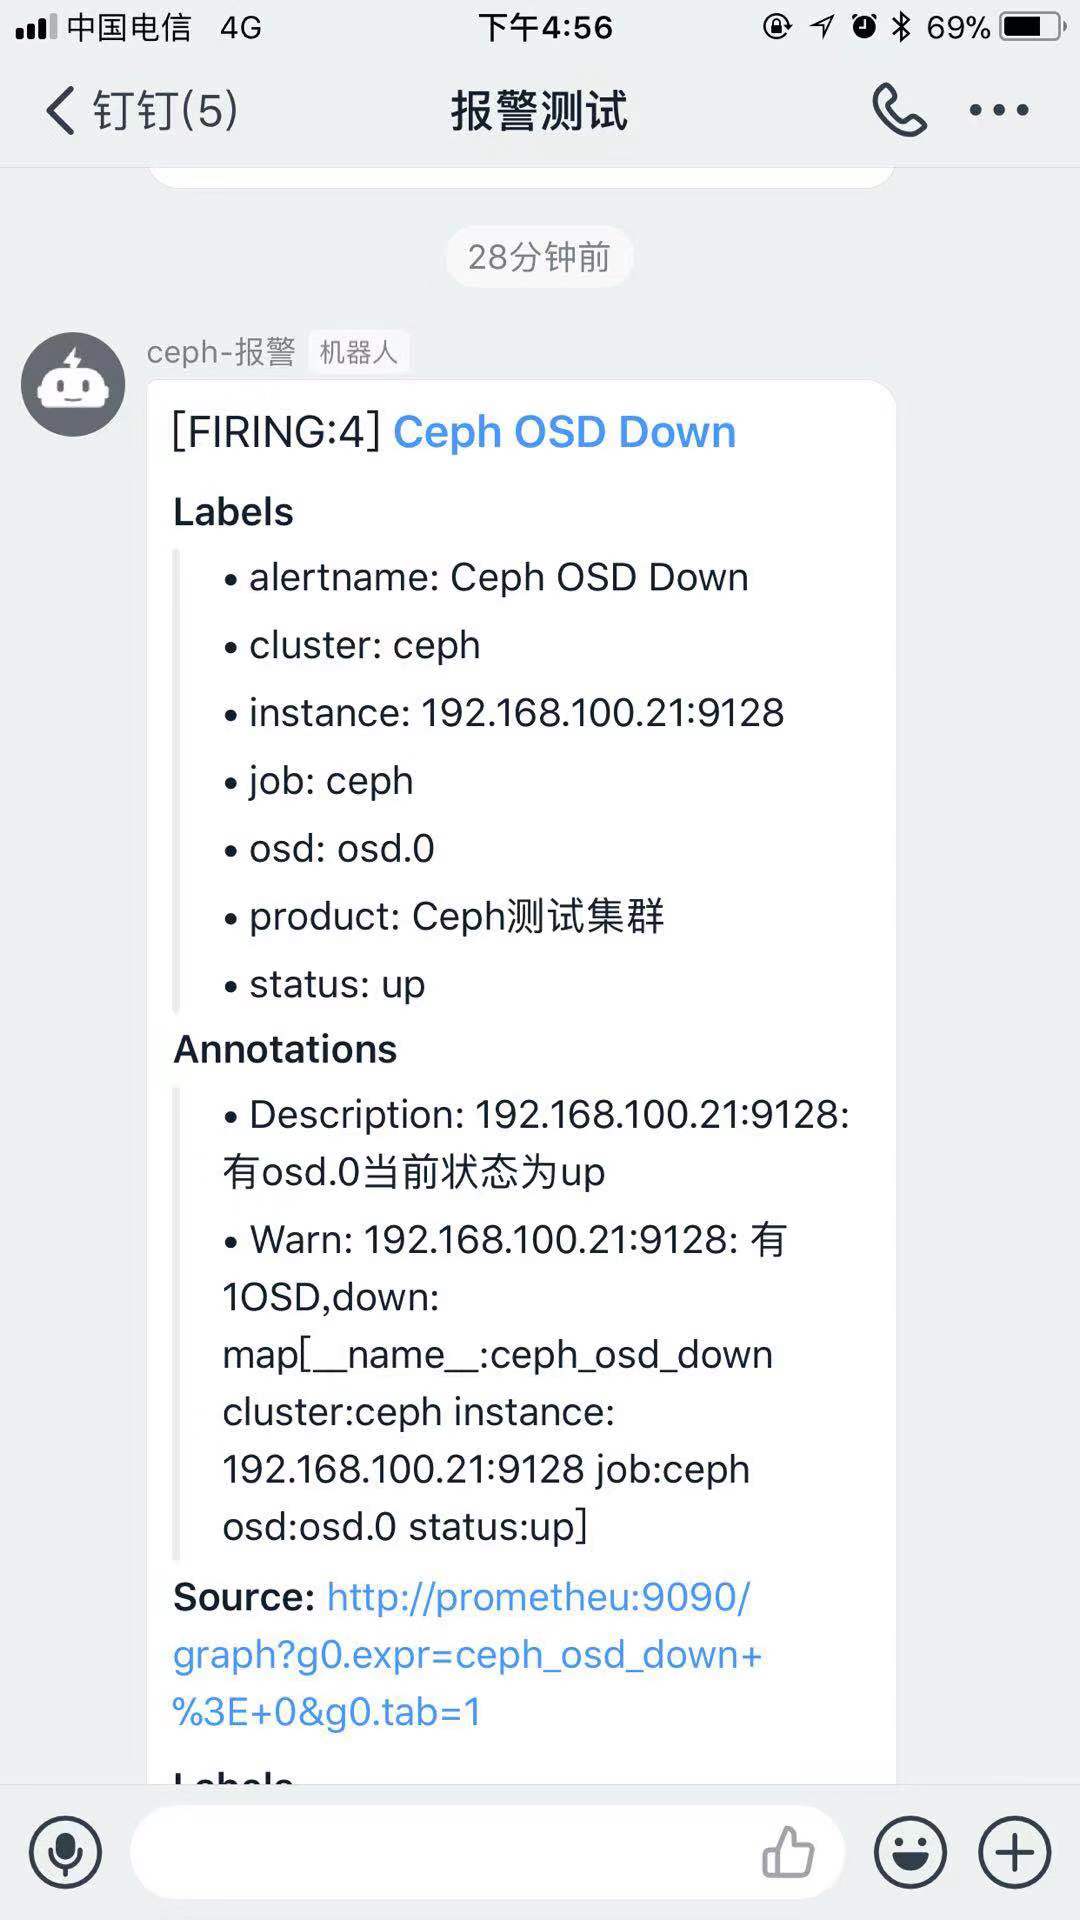
- alert: Ceph OSD Down
expr: ceph_osd_down >
for: 2m
labels:
product: Ceph测试集群
annotations:
Warn: "{{$labels.instance}}: 有{{ $value }}OSD,down: {{$labels}}"
Description: "{{$labels.instance}}:有{{ $labels.osd }}当前状态为{{ $labels.status }}" - alert: 集群空间使用率
expr: ceph_cluster_used_bytes / ceph_cluster_capacity_bytes * >
for: 2m
labels:
product: Ceph测试集群
annotations:
Warn: "{{$labels.instance}}:集群空间不足"
Description: "{{$labels.instance}}:当前空间使用率为{{ $value }}"
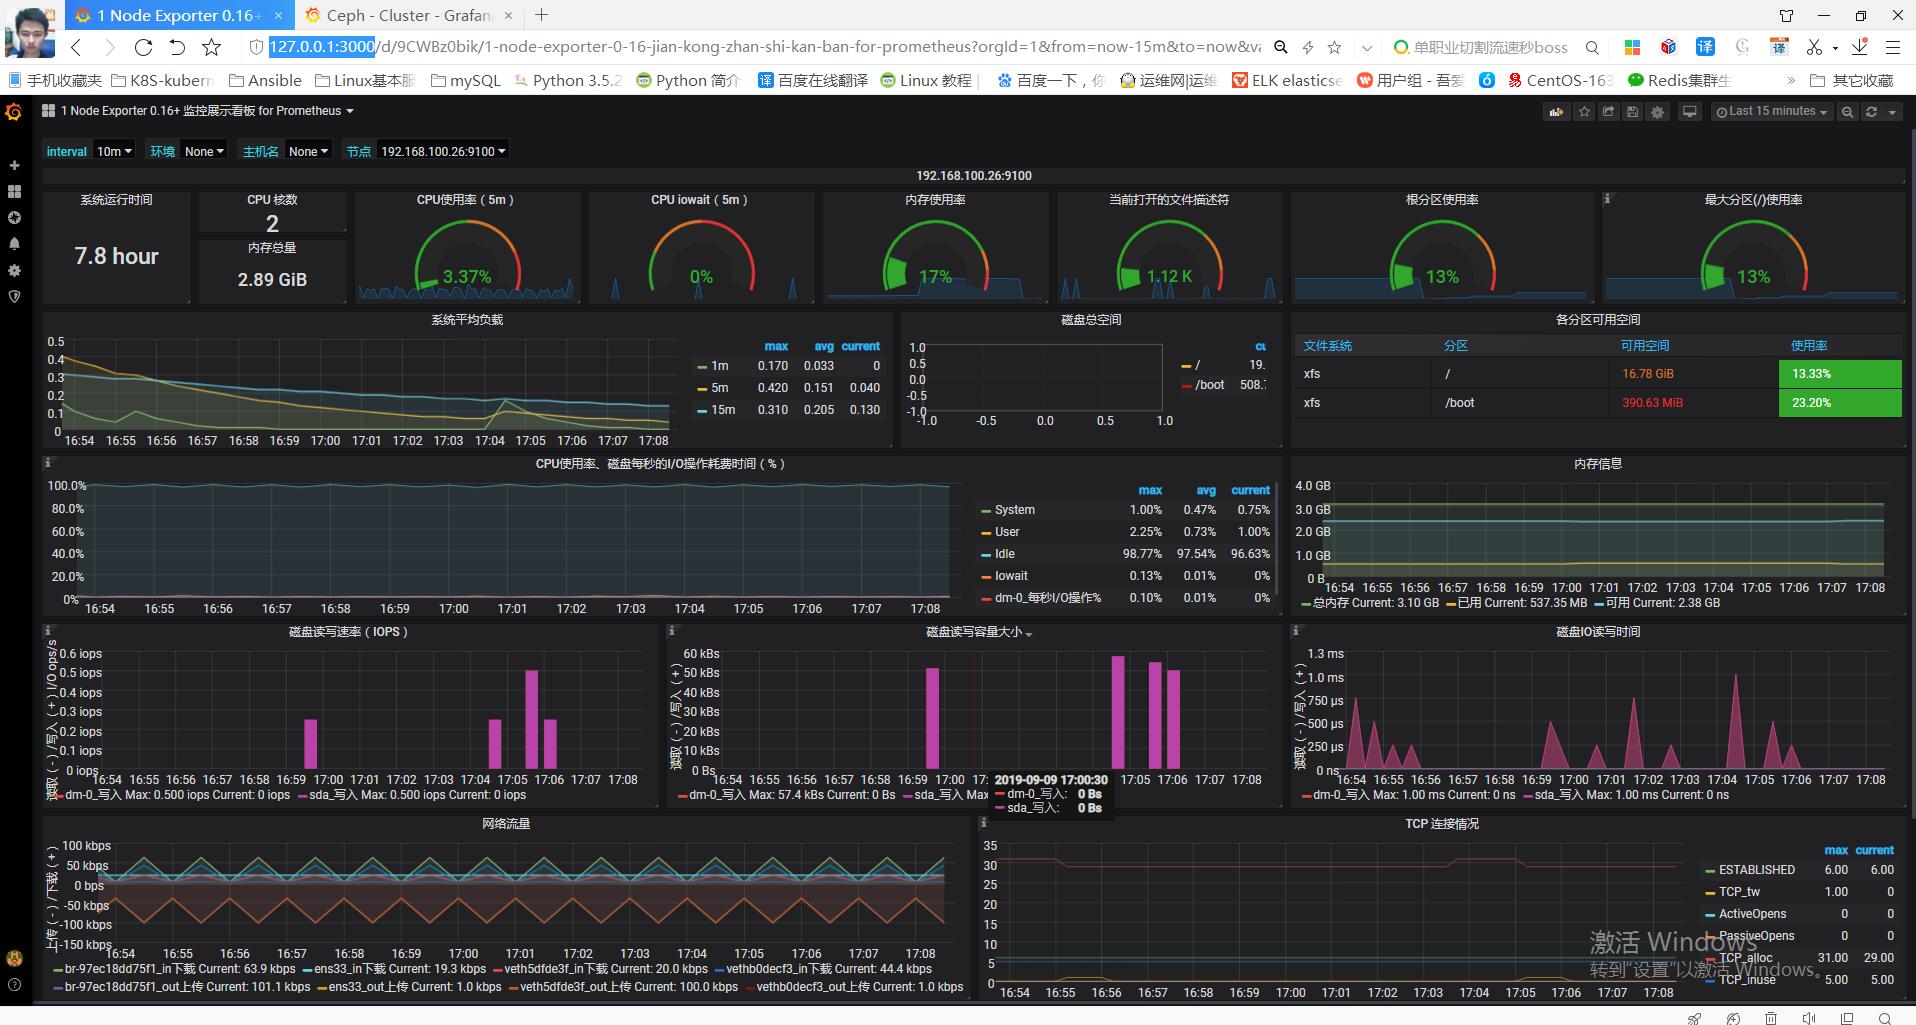
node-exporter: json模板下载 https://grafana.com/grafana/dashboards/10645
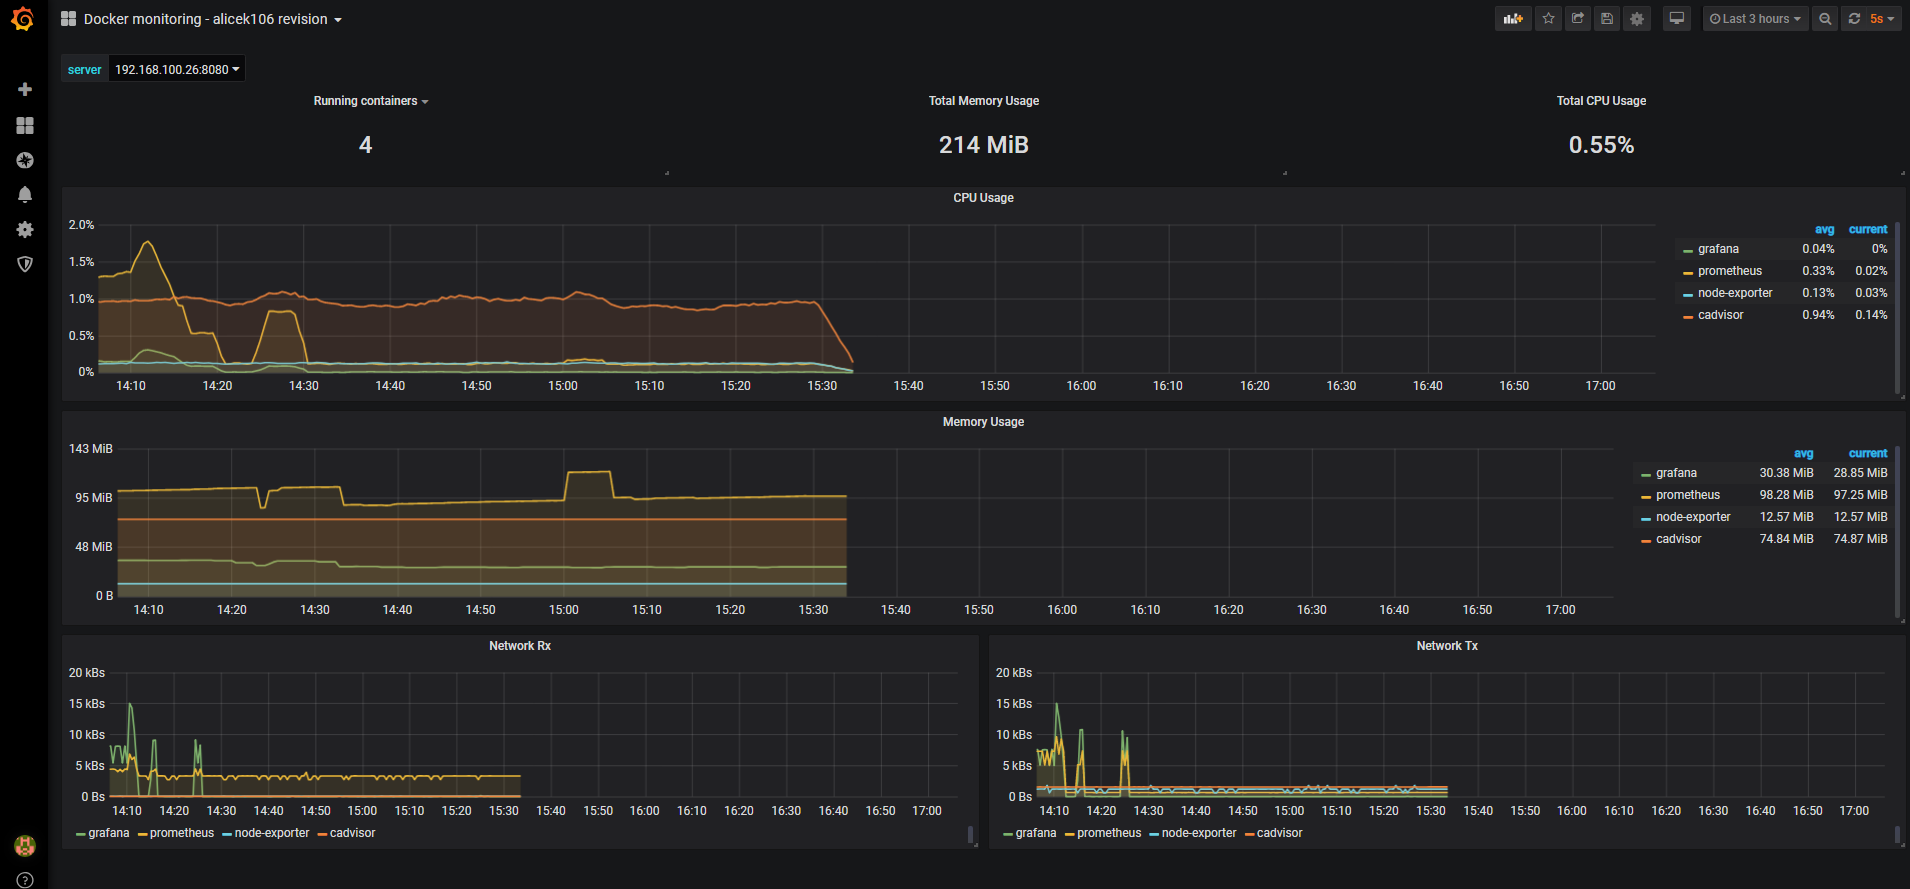
cadvisor: json模板下载: https://grafana.com/grafana/dashboards/3125
ceph cluster: json模板下载: https://grafana.com/grafana/dashboards/917%5D
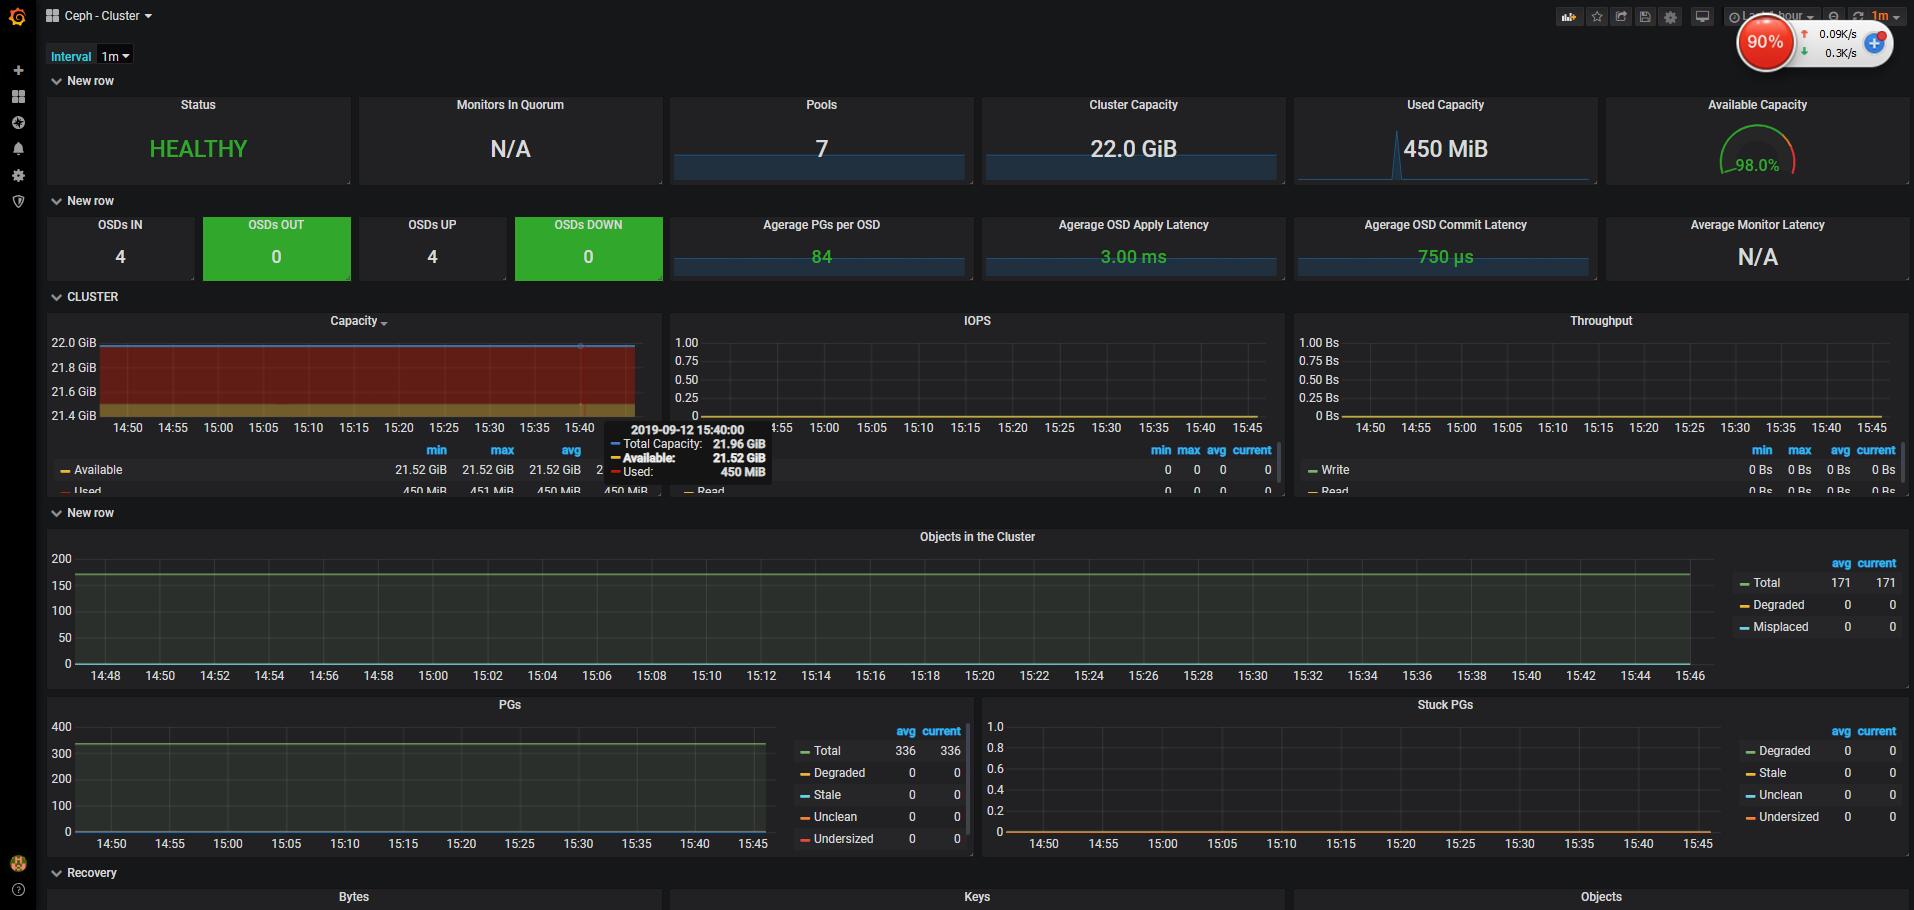
最后来一张完成 成果图
docker-compose 快速部署Prometheus之服务端并监控ceph cluster 使用钉钉webhook 报警的更多相关文章
- 使用 Docker Compose 快速构建 TiDB 集群
本文档介绍如何在单机上通过 Docker Compose 快速一键部署一套 TiDB 测试集群.Docker Compose 可以通过一个 YAML 文件定义多个容器的应用服务,然后一键启动或停止. ...
- 快速理解高性能HTTP服务端的负载均衡技术原理(转)
1.前言 在一个典型的高并发.大用户量的Web互联网系统的架构设计中,对HTTP集群的负载均衡设计是作为高性能系统优化环节中必不可少的方案.HTTP负载均衡的本质上是将Web用户流量进行均衡减压,因此 ...
- Docker Compose 一键部署LNMP
Docker Compose 一键部署LNMP 目录结构 [root@localhost ~]# tree compose_lnmp/ compose_lnmp/ ├── docker-compose ...
- Docker Compose 一键部署Nginx代理Tomcat集群
Docker Compose 一键部署Nginx代理Tomcat集群 目录结构 [root@localhost ~]# tree compose_nginx_tomcat/ compose_nginx ...
- Docker Compose 一键部署多节点爬虫程序
Docker Compose 一键部署多节点爬虫程序 目录结构 [root@localhost ~]# tree compose_crawler/ compose_crawler/ ├── cento ...
- 用Docker swarm快速部署Nebula Graph集群
用Docker swarm快速部署Nebula Graph集群 一.前言 本文介绍如何使用 Docker Swarm 来部署 Nebula Graph 集群. 二.nebula集群搭建 2.1 环境准 ...
- 通过 DynamicLinq 简单实现 N-Tier 部署下的服务端数据库通用分页
通过 DynamicLinq 简单实现 N-Tier 部署下的服务端数据库通用分页 YbSoftwareFactory 的 YbRapidSolution for WinForm 插件使用CSLA.N ...
- docker-compose 快速部署Prometheus,监控docker 容器, 宿主机,ceph -- cluster集群
话不多说上菜: 现在环境是这样: ceph 4台: 192.168.100.21 ceph-node1 192.168.100.22 ceph-node2 192.168.100.23 ceph ...
- 如何快速部署 Prometheus?- 每天5分钟玩转 Docker 容器技术(85)
上一节介绍了 Prometheus 的核心,多维数据模型.本节演示如何快速搭建 Prometheus 监控系统. 环境说明 我们将通过 Prometheus 监控两台 Docker Host:192. ...
随机推荐
- 大数据篇:MapReduce
MapReduce MapReduce是什么? MapReduce源自于Google发表于2004年12月的MapReduce论文,是面向大数据并行处理的计算模型.框架和平台,而Hadoop MapR ...
- ThinkPHP6源码分析之应用初始化
ThinkPHP6 源码分析之应用初始化 官方群点击此处. App Construct 先来看看在 __construct 中做了什么,基本任何框架都会在这里做一些基本的操作,也就是从这里开始延伸出去 ...
- C++的const成员函数
我们知道,在C++中,若一个变量声明为const类型,则试图修改该变量的值的操作都被视编译错误.例如, const char blank = ‘’; blank = ‘\n’; // 错误 面向对象 ...
- Weka算法算法翻译(部分)
目录 Weka算法翻译(部分) 1. 属性选择算法(select attributes) 1.1 属性评估方法 1.2 搜索方法 2. 分类算法 2.1 贝叶斯算法 2.2 Functions 2.3 ...
- Redis的人门以及使用
1.Redis的安装 1.1centos下安装Redis 1.1.1 安装gcc 1.1.2 安装过程 图一 图三 2.Redis的启动 2.1 前端模式启动(不推荐) 截图 2.2 后端模式(推荐 ...
- android的ListAdapter简单用法
ListAdapter是一个整个Activity有且仅有一个ListView控件的Activity 使用步骤:1. 创建MyListViewAdapter(类名可以自定义) extends ListA ...
- Send key模块发送按键
filename:send_key.py 1 # Author:Bing # Date:07/19/2017 import SendKeys import win32gui import pywin ...
- CentOS使用日常
安装Teamview TeamViewer官网 下载rpm包 yum install -y teamviewer.x86_64.rpm 搞定 systemctl status firewalld #查 ...
- centos将uwsgi添加为系统服务
如果退出ssh 链接, 都会导致uwsgi进程关闭 这时, 我们需要进行管理软件管理uwsgi进行的运行, centos系统中我们采用 systemd, 让我们的项目变为系统服务 第一步: 首先 vi ...
- JavaScript 数字
数字(Number)也称为数值或数. 数值直接量 当数字直接出现在程序中时,被称为数值直接量.在 JavaScript 程序中,直接输入的任何数字都被视为数值直接量. 示例1 数值直接量可以细分为整型 ...