1.prometheus源码安装
一、prometheus安装前准备
prometheus官网:https://prometheus.io/
grafana官网:https://grafana.com/
资源下载:
# 1.资源下载

wget https://github.com/prometheus/prometheus/releases/download/v2.45.4/prometheus-2.45.4.linux-amd64.tar.gz

wget https://github.com/prometheus/alertmanager/releases/download/v0.27.0/alertmanager-0.27.0.linux-amd64.tar.gz

wget https://github.com/prometheus/node_exporter/releases/download/v1.7.0/node_exporter-1.7.0.linux-amd64.tar.gz

wget https://dl.grafana.com/enterprise/release/grafana-enterprise-10.4.2.linux-amd64.tar.gz

# 2.解压到对应目录

mkdir -p /opt/prometheus

root@os:/opt/prometheus# pwd

/opt/prometheus

root@os:/opt/prometheus# ls

alertmanager  grafana  node_exporter  prometheus

# 3.创建一个专门的prometheus用户

useradd -M -s /usr/sbin/nologin prometheus

# 4.修改目录权限

chown prometheus:prometheus -R /opt/prometheus
二、配置文件修改
2.1 创建system服务
# 1.prometheus服务启动文件
cat > /etc/systemd/system/prometheus.service << "EOF"

[Unit]

Description=Prometheus Server

Documentation=https://prometheus.io/docs/introduction/overview/

After=network-online.target

[Service]

Type=simple

User=prometheus

Group=prometheus

Restart=on-failure

ExecStart=/opt/prometheus/prometheus/prometheus \

  --config.file=/opt/prometheus/prometheus/prometheus.yml \

  --storage.tsdb.path=/opt/prometheus/prometheus/data \

  --storage.tsdb.retention.time=60d \

  --web.enable-lifecycle

[Install]

WantedBy=multi-user.target

EOF

# 详情

--config.file=/opt/prometheus/prometheus/prometheus.yml                 #主配置文件

--storage.tsdb.path=/opt/prometheus/prometheus/data                     #数据库存储目录

--web.console.libraries=/opt/prometheus/prometheus/console_libraries    #指定控制台库目录路径

--web.console.templates=/opt/prometheus/prometheus/consoles             #指定控制台模版目录路径

--storage.tsdb.retention=60d                                            #指明数据保留天数,默认15天

--web.enable-lifecycle                                                  #热加载
# 2.创建altermanager启动服务

cat >/etc/systemd/system/alertmanager.service << "EOF"

[Unit]

Description=Alert Manager

Wants=network-online.target

After=network-online.target

[Service]

Type=simple

User=prometheus

Group=prometheus

ExecStart=/opt/prometheus/alertmanager/alertmanager \

  --config.file=/opt/prometheus/alertmanager/alertmanager.yml \

  --storage.path=/opt/prometheus/alertmanager/data

Restart=always

[Install]

WantedBy=multi-user.target

EOF
# 3.创建grafana启动服务

cat >/etc/systemd/system/grafana-server.service<<"EOF"

[Unit]

Description=Grafana server

Documentation=http://docs.grafana.org

[Service]

Type=simple

User=prometheus

Group=prometheus

Restart=on-failure

ExecStart=/opt/prometheus/grafana/bin/grafana-server \

  --config=/opt/prometheus/grafana/conf/defaults.ini \

  --homepath=/opt/prometheus/grafana

[Install]

WantedBy=multi-user.target

EOF
# 4.创建node_exporter启动服务

cat > /etc/systemd/system/node_exporter.service <<"EOF"

[Unit]

Description=node_exporter

Documentation=https://prometheus.io/

After=network.target

[Service]

User=prometheus

Group=prometheus

ExecStart=/opt/prometheus/node_exporter/node_exporter

Restart=on-failure

[Install]

WantedBy=multi-user.target

EOF
2.2 修改配置文件
# altermanager启动前修改prometheus配置

vim /opt/prometheus/prometheus/prometheus.yml

alerting:

  alertmanagers:

  - static_configs:

    - targets:

      #根据实际填写alertmanager的地址

      - localhost:9093

rule_files:

  #根据实际名修改文件名

  - "alert.yml"

# 搜刮配置

scrape_configs:

  - job_name: 'alertmanager'

    scrape_interval: 15s

    static_configs:

    - targets: ['localhost:9093']

# 触发器配置文件alert.yml

cat > /opt/prometheus/prometheus/alert.yml <<"EOF"

groups:

- name: Prometheus alert

  rules:

  # 对任何实例超过30秒无法联系的情况发出警报

  - alert: 服务告警

    expr: up == 0

    for: 30s

    labels:

      severity: critical

    annotations:

      summary: "服务异常,实例:{{ $labels.instance }}"

      description: "{{ $labels.job }} 服务已关闭"

EOF
# node_exporter服务

cat >> /opt/prometheus/prometheus/prometheus.yml <<"EOF"

# 再scrape_configs这行下面添加如下配置:

  #node-exporter配置

  - job_name: 'node-exporter'

    scrape_interval: 15s

    static_configs:

    - targets: ['localhost:9100']

      labels:

        instance: Prometheus服务器

EOF
2.3 启动服务
# 启动服务
systemctl daemon-reload
systemctl start prometheus.service
systemctl enable prometheus.service
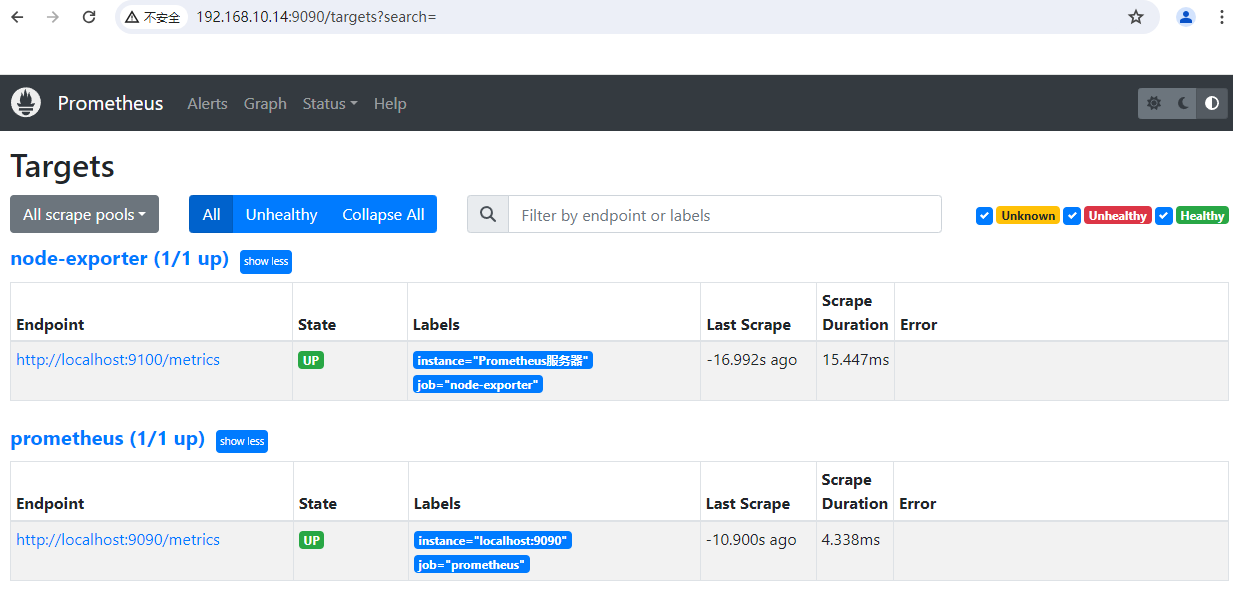
访问测试地址:
http://192.168.10.14:9090/
监控指标:http://192.168.10.14:9090/metrics
systemctl start alertmanager.service
systemctl enable alertmanager.service
访问测试地址:http://192.168.10.14:9093/
systemctl start grafana-server.service
systemctl enable grafana-server.service
web访问地址:http://192.168.10.14:3000/
systemctl start node_exporter.service
systemctl enable node_exporter.service
web访问地址:http://192.168.10.14:9100/metrics # 查看命令
systemctl status 服务名
# prometheus配置文件如果有修改,请用重载或重启服务命令
重载:curl -X POST http://localhost:9090/-/reload
三、使用grafana展示prometheus
3.1 登录grafana
http://192.168.10.14:3000/login
默认用户名密码:admin/admin
3.2 创建prometheus数据源
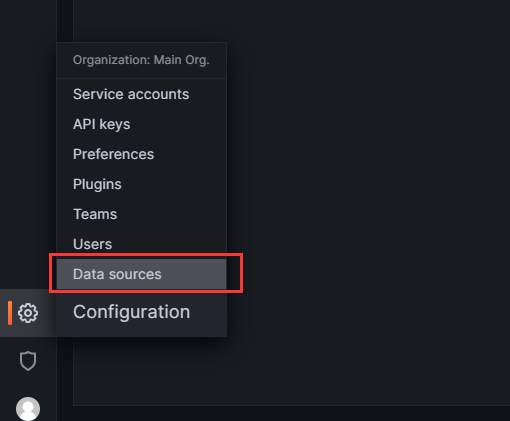
在 Grafana 中创建 Prometheus 数据源:
- 单击边栏中的“齿轮”,打开“配置”菜单。
- 单击“数据源”。
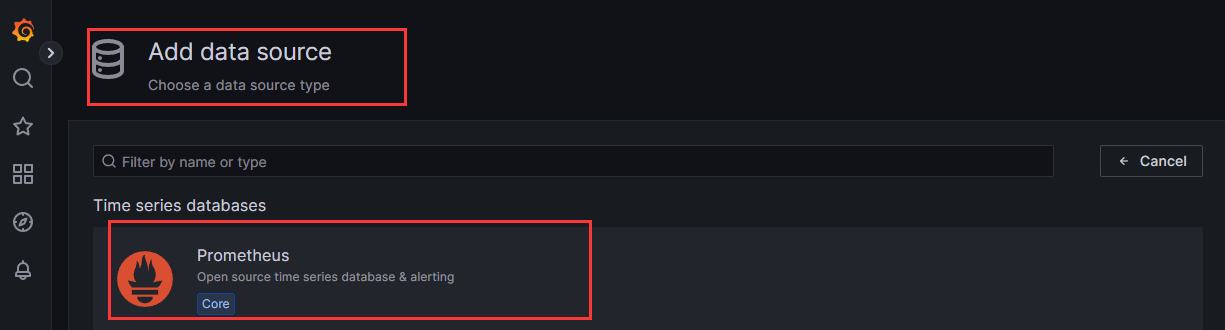
- 单击“添加数据源”。
- 选择“Prometheus”作为类型。
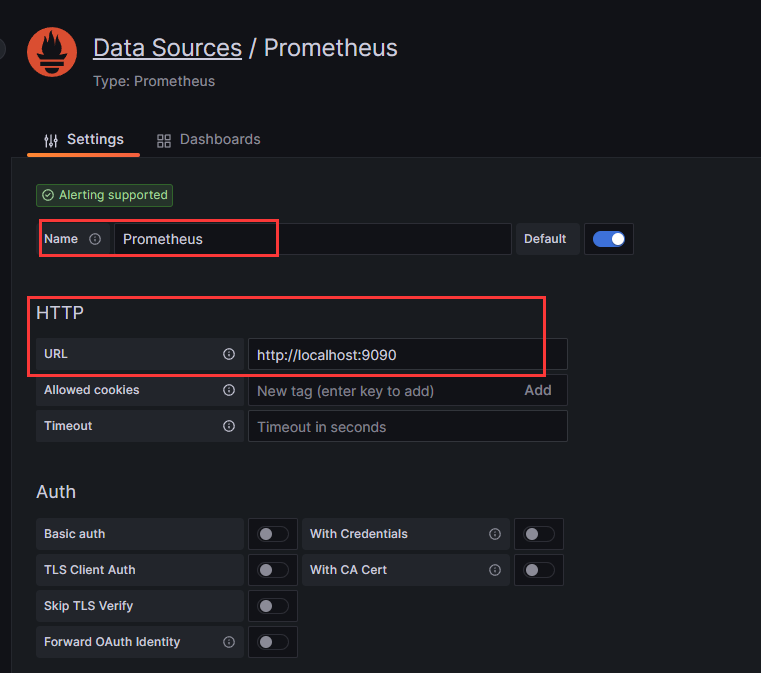
- 设置适当的 Prometheus 服务器 URL(例如,
http://localhost:9090)
- 单击“保存并测试”以保存新的数据源。
url填入:http://localhost:9090 注:localhost表示本机,然后保存save&test
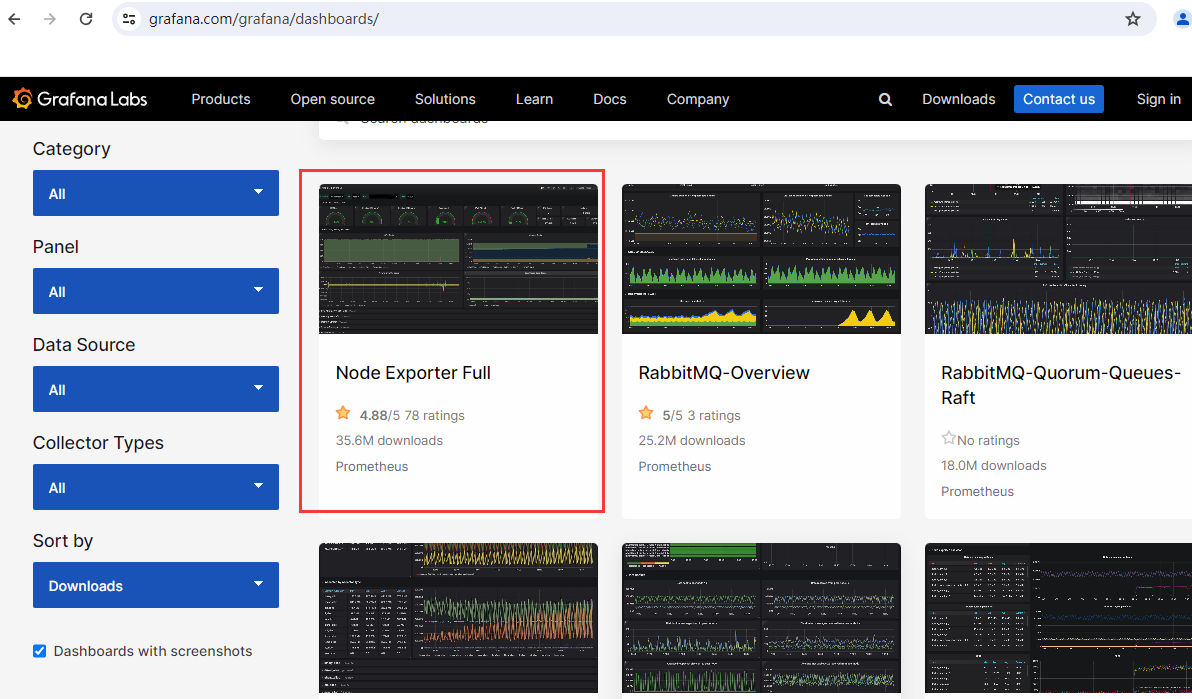
3.3 创建仪表盘:从grafana导入仪表盘
https://grafana.com/grafana/dashboards/
打开grafana的dashboards官网,在搜索栏输入node exporter回车,点击下载量大的dashboards如下图:
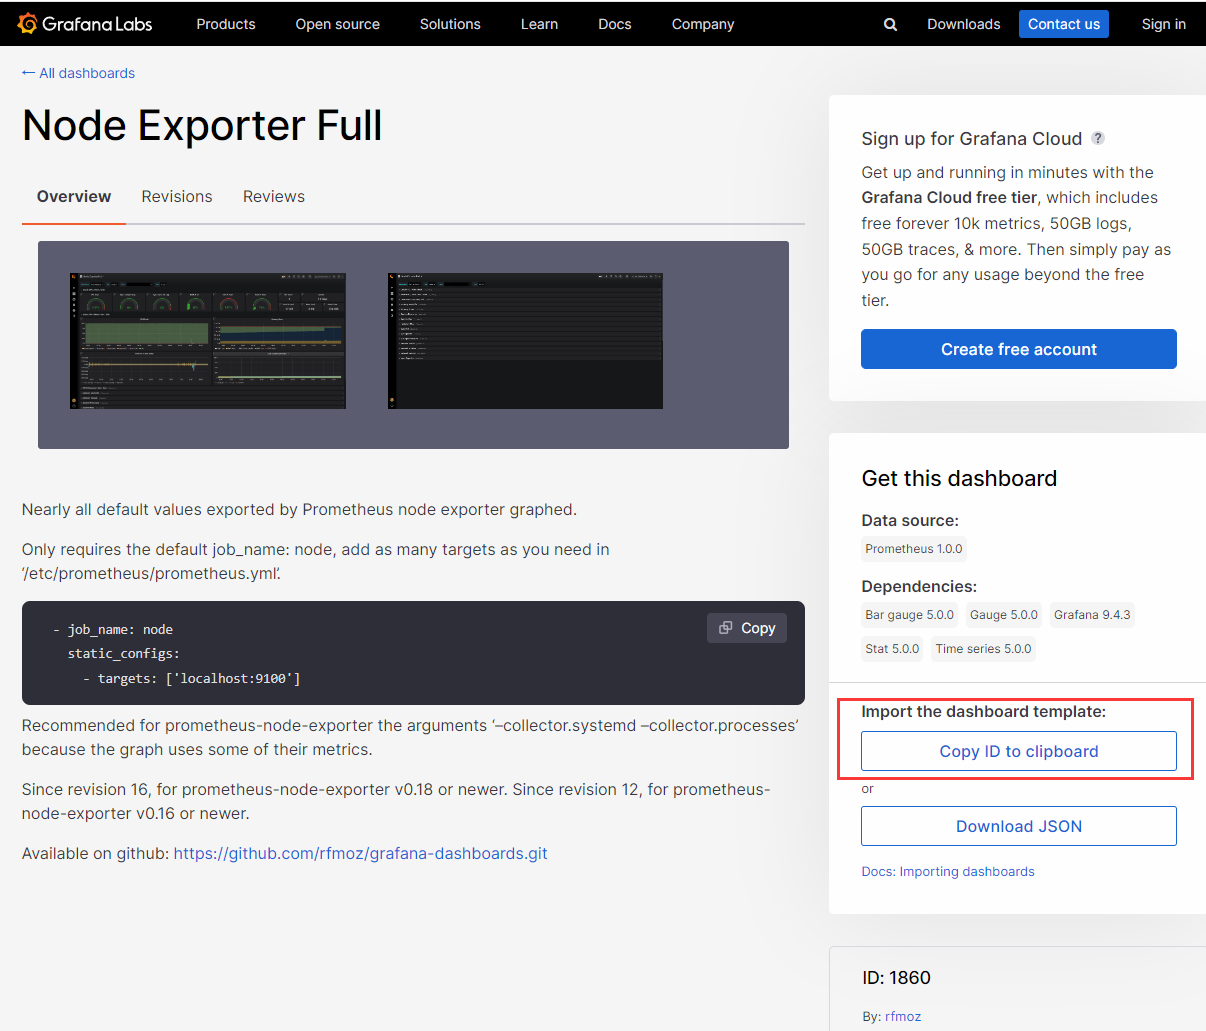
拷贝id
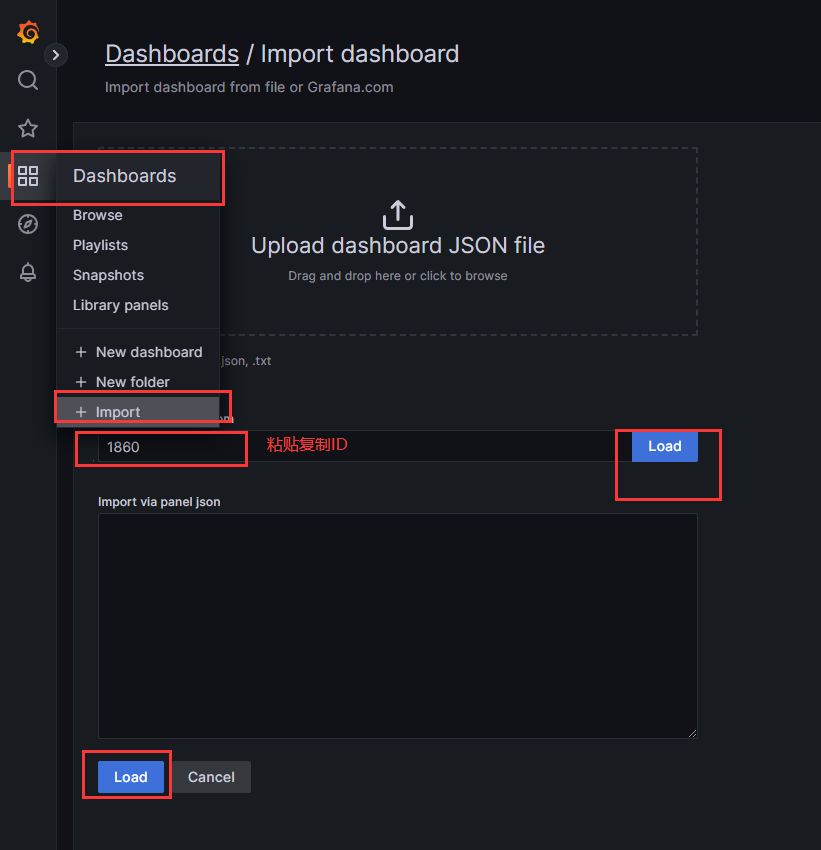
打开grafana web控制台--点击dashbord图标--在点import导入--粘贴之前复制的id--在点load加载
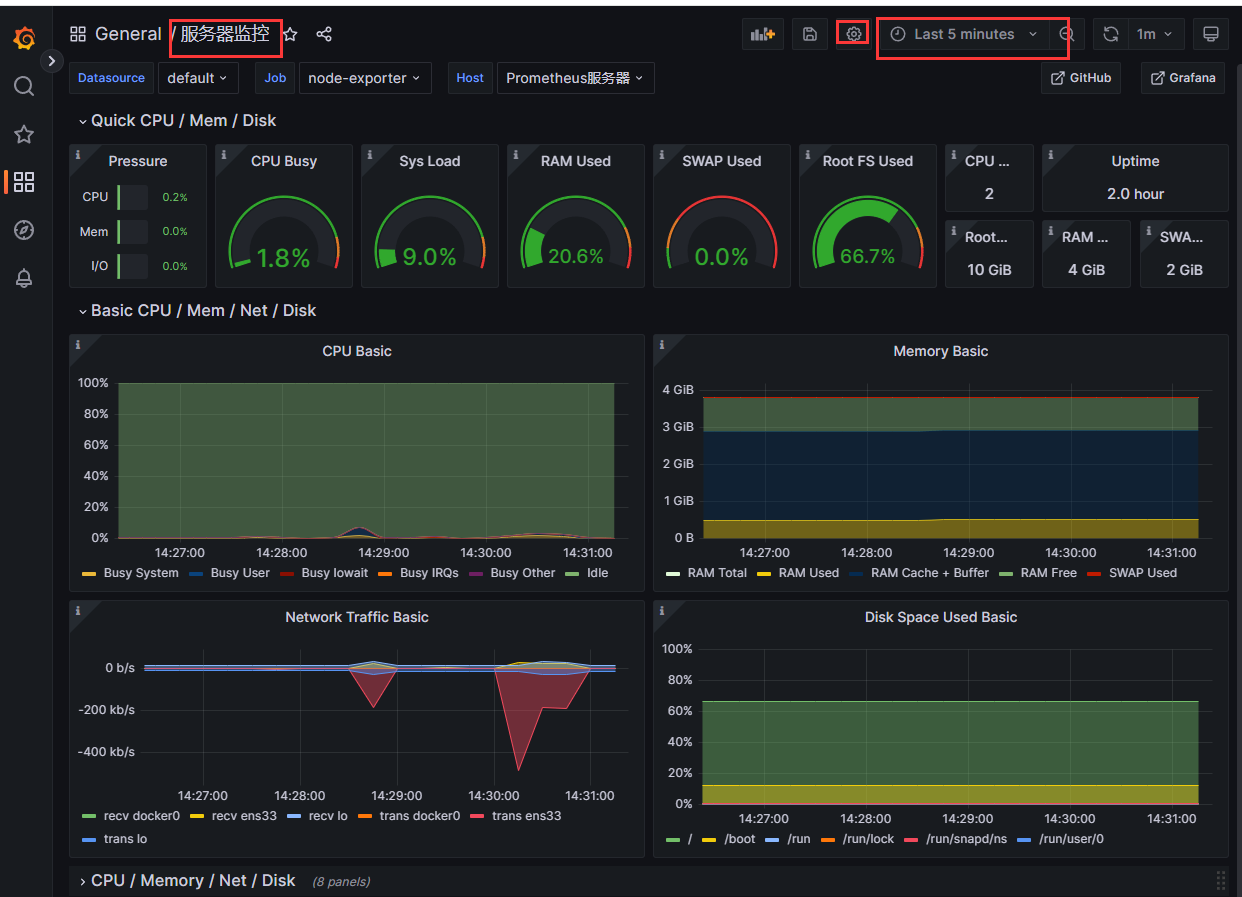
name填写“服务器监控”(根据实际修改),选择“prometheus”--在点import导入
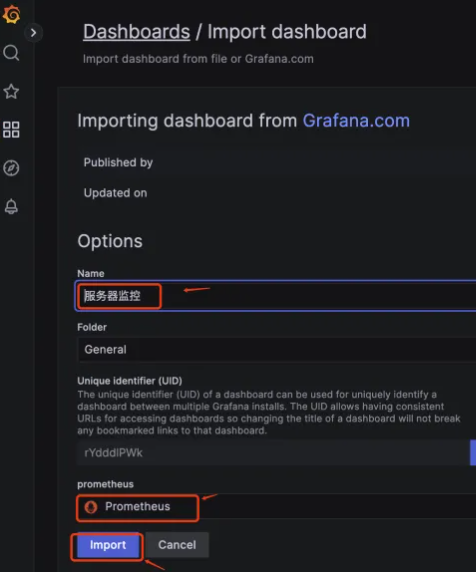
导入dashboard完成后,查看:
1.prometheus源码安装的更多相关文章
- mono-3.4.0 源码安装时出现的问题 [do-install] Error 2 [install-pcl-targets] Error 1 解决方法
Mono 3.4修复了很多bug,继续加强稳定性和性能(其实Mono 3.2.8 已经很稳定,性能也很好了),但是从http://download.mono-project.com/sources/m ...
- 搭建LNAMP环境(七)- PHP7源码安装Memcached和Memcache拓展
上一篇:搭建LNAMP环境(六)- PHP7源码安装MongoDB和MongoDB拓展 一.安装Memcached 1.yum安装libevent事件触发管理器 yum -y install libe ...
- 搭建LNAMP环境(二)- 源码安装Nginx1.10
上一篇:搭建LNAMP环境(一)- 源码安装MySQL5.6 1.yum安装编译nginx需要的包 yum -y install pcre pcre-devel zlib zlib-devel ope ...
- 搭建LNAMP环境(一)- 源码安装MySQL5.6
1.yum安装编译mysql需要的包 yum -y install gcc-c++ make cmake bison-devel ncurses-devel perl 2.为mysql创建一个新的用户 ...
- Greenplum 源码安装教程 —— 以 CentOS 平台为例
Greenplum 源码安装教程 作者:Arthur_Qin 禾众 Greenplum 主体以及orca ( 新一代优化器 ) 的代码以可以从 Github 上下载.如果不打算查看代码,想下载编译好的 ...
- salt源码安装软件和yum安装软件
上面简单列出了源码安装的sls文件书写思路. 涉及到一些固定的思路:如, 1,拷贝 解压安装时候需要依赖tar.gz存在 如果已安装则无需再次安装. 2,启动脚本 加入chk时候需要文件存在,如果已添 ...
- 搭建LNAMP环境(六)- PHP7源码安装MongoDB和MongoDB拓展
上一篇:搭建LNAMP环境(五)- PHP7源码安装Redis和Redis拓展 一.安装MongoDB 1.创建mongodb用户组和用户 groupadd mongodb useradd -r -g ...
- 搭建LNAMP环境(三)- 源码安装Apache2.4
上一篇:搭建LNAMP环境(二)- 源码安装Nginx1.10 1.yum安装编译apache需要的包(如果已经安装,可跳过此步骤) yum -y install pcre pcre-devel zl ...
- Linux MySQL源码安装缺少ncurses-devel包
在Red Hat Enterprise Linux Server release 5.7 上用源码安装MySQL-5.6.23时,遇到了" remove CMakeCache.txt and ...
- centos 6x系统下源码安装mysql操作记录
在运维工作中经常部署各种运维环境,涉及mysql数据库的安装也是时常需要的.mysql数据库安装可以选择yum在线安装,但是这种安装的mysql一般是系统自带的,版本方面可能跟需求不太匹配.可以通过源 ...
随机推荐
- ubuntu18.04如何运行.exe文件
在Ubuntu上安装Wine 到wine官网查看的安装步骤 如果您之前安装过来自其他仓库的 Wine 安装包,请在尝试安装 WineHQ 安装包之前删除它及依赖它的所有安装包(如:wine-mono. ...
- KingbaseES V8R6集群运维案例--cluster模式备份sys_backup.sh init故障
KingbaseES V8R6集群运维案例--cluster模式备份sys_backup.sh init故障 案例说明: 通过脚本方式部署KingbaseES V8R6集群后,在'cluster'模式 ...
- sql分页遍历出现重复数据原因与解决方案
1. 问题描述 有同时反馈,直接通过如下的sql进行分页查询,分页会出现重复数据,于是乎我专门查了相关了资料,整理了一下. -- 根据sort字段对dbname进行排序,每五百条数据一页 SELECT ...
- 《2020年IT行业项目管理调查报告》重磅发布
近年来,IT行业迅速发展,物联网.敏捷.DevOps等已成为行业的热门话题.为更好地了解行业现状,禅道项目管理软件联合各合作伙伴于2021年1月开展了针对IT行业的问卷调查,并推出了<2020年 ...
- 前端问题整理 Vite+Vue3+Ts 创建项目及配置 持续更新
前端问题整理 持续更新 目录 前端问题整理 持续更新 前端 Vue 篇 @项目配置 1.node 版本过高问题 安装nvm 管理node版本 2.镜像证书无效问题 3.npm 版本问题 4.npm i ...
- 6 CSS样式继承
6 样式继承 CSS的样式表继承指的是,特定的CSS属性向下传递到子孙元素.总的来说,一个HTML文档就是一个家族,然后html元素有两个子元素,相当于它的儿子,分别是head和body,然后body ...
- Bootstrap实战 - 评论列表
一.介绍 社交媒体网站盛行,人们常常会使用评论表达自己的观点,评论功能已然成为网站的一部分. 二.知识点 2.1 媒体对象 官方解释:这是一个抽象的样式,用以构建不同类型的组件,这些组件都具有在文本内 ...
- 单元测试篇2-TDD三大法则解密
引言 在我们上一篇文章了解了单元测试的基本概念和用法之后,今天我们来聊一下 TDD(测试驱动开发) 测试驱动开发 (TDD) 测试驱动开发英文全称是Test Driven Development 简称 ...
- 这一次,让我们一起来搞懂MySQL
欢迎加入我的专栏,和我一起开始 MySQL 学习之旅. 从日常的开发和优化中,一步步地从一个数据库小白成为 MySQL 调优的开发人员.回想起来,从我第一次带创建索引至今,已经有十个年头了.在这个过程 ...
- 内容分发策略与 SEO 优化指南
内容分发 内容分发是指通过各种媒介分享.发布或传播内容给受众的过程.这些媒介可以包括不同的渠道,例如社交媒体平台(Facebook.Twitter.LinkedIn.朋友圈.微博.小红书.B 站.抖音 ...