R + ggplot2 Graph Catalog(转)

library(ggplot2)

library(reshape2)

library(grid)

this_base = "fig08-15_population-data-by-county"

my_data = data.frame(

  Race = c("White", "Latino", "Black", "Asian American", "All Others"),

  Bronx = c(194000, 645000, 415000, 38000, 40000),

  Kings = c(855000, 488000, 845000, 184000, 93000),

  New.York = c(703000, 418000, 233000, 143000, 39000),

  Queens = c(733000, 556000, 420000, 392000, 128000),

  Richmond = c(317000, 54000, 40000, 24000, 9000),

  Nassau = c(986000, 133000, 129000, 62000, 24000),

  Suffolk = c(1118000, 149000, 92000, 34000, 26000),

  Westchester = c(592000, 145000, 123000, 41000, 23000),

  Rockland = c(205000, 29000, 30000, 16000, 6000),

  Bergen = c(638000, 91000, 43000, 94000, 18000),

  Hudson = c(215000, 242000, 73000, 57000, 22000),

  Passiac = c(252000, 147000, 60000, 18000, 12000))

my_data_long = melt(my_data, id = "Race",

                     variable.name = "county", value.name = "population")

my_data_long$county = factor(

  my_data_long$county, c("New.York", "Queens", "Kings", "Bronx", "Nassau",

                         "Suffolk", "Hudson", "Bergen", "Westchester",

                         "Rockland", "Richmond", "Passiac"))

my_data_long$Race =

  factor(my_data_long$Race,

         rev(c("White", "Latino", "Black", "Asian American", "All Others")))

p = ggplot(my_data_long, aes(x = population / 1000, y = Race)) +

  geom_point() +

  facet_wrap(~ county, ncol = 3) +

  scale_x_continuous(breaks = seq(0, 1000, 200),

                     labels = c(0, "", 400, "", 800, "")) +

  labs(x = "Population (thousands)", y = NULL) +

  ggtitle("Fig 8.15 Population Data by County") +

  theme_bw() +

  theme(panel.grid.major.y = element_line(colour = "grey60"),

        panel.grid.major.x = element_blank(),

        panel.grid.minor = element_blank(),

        panel.margin = unit(0, "lines"),

        plot.title = element_text(size = rel(1.1), face = "bold", vjust = 2),

        strip.background = element_rect(fill = "grey80"),

        axis.ticks.y = element_blank())

p

ggsave(paste0(this_base, ".png"),

       p, width = 6, height = 8)

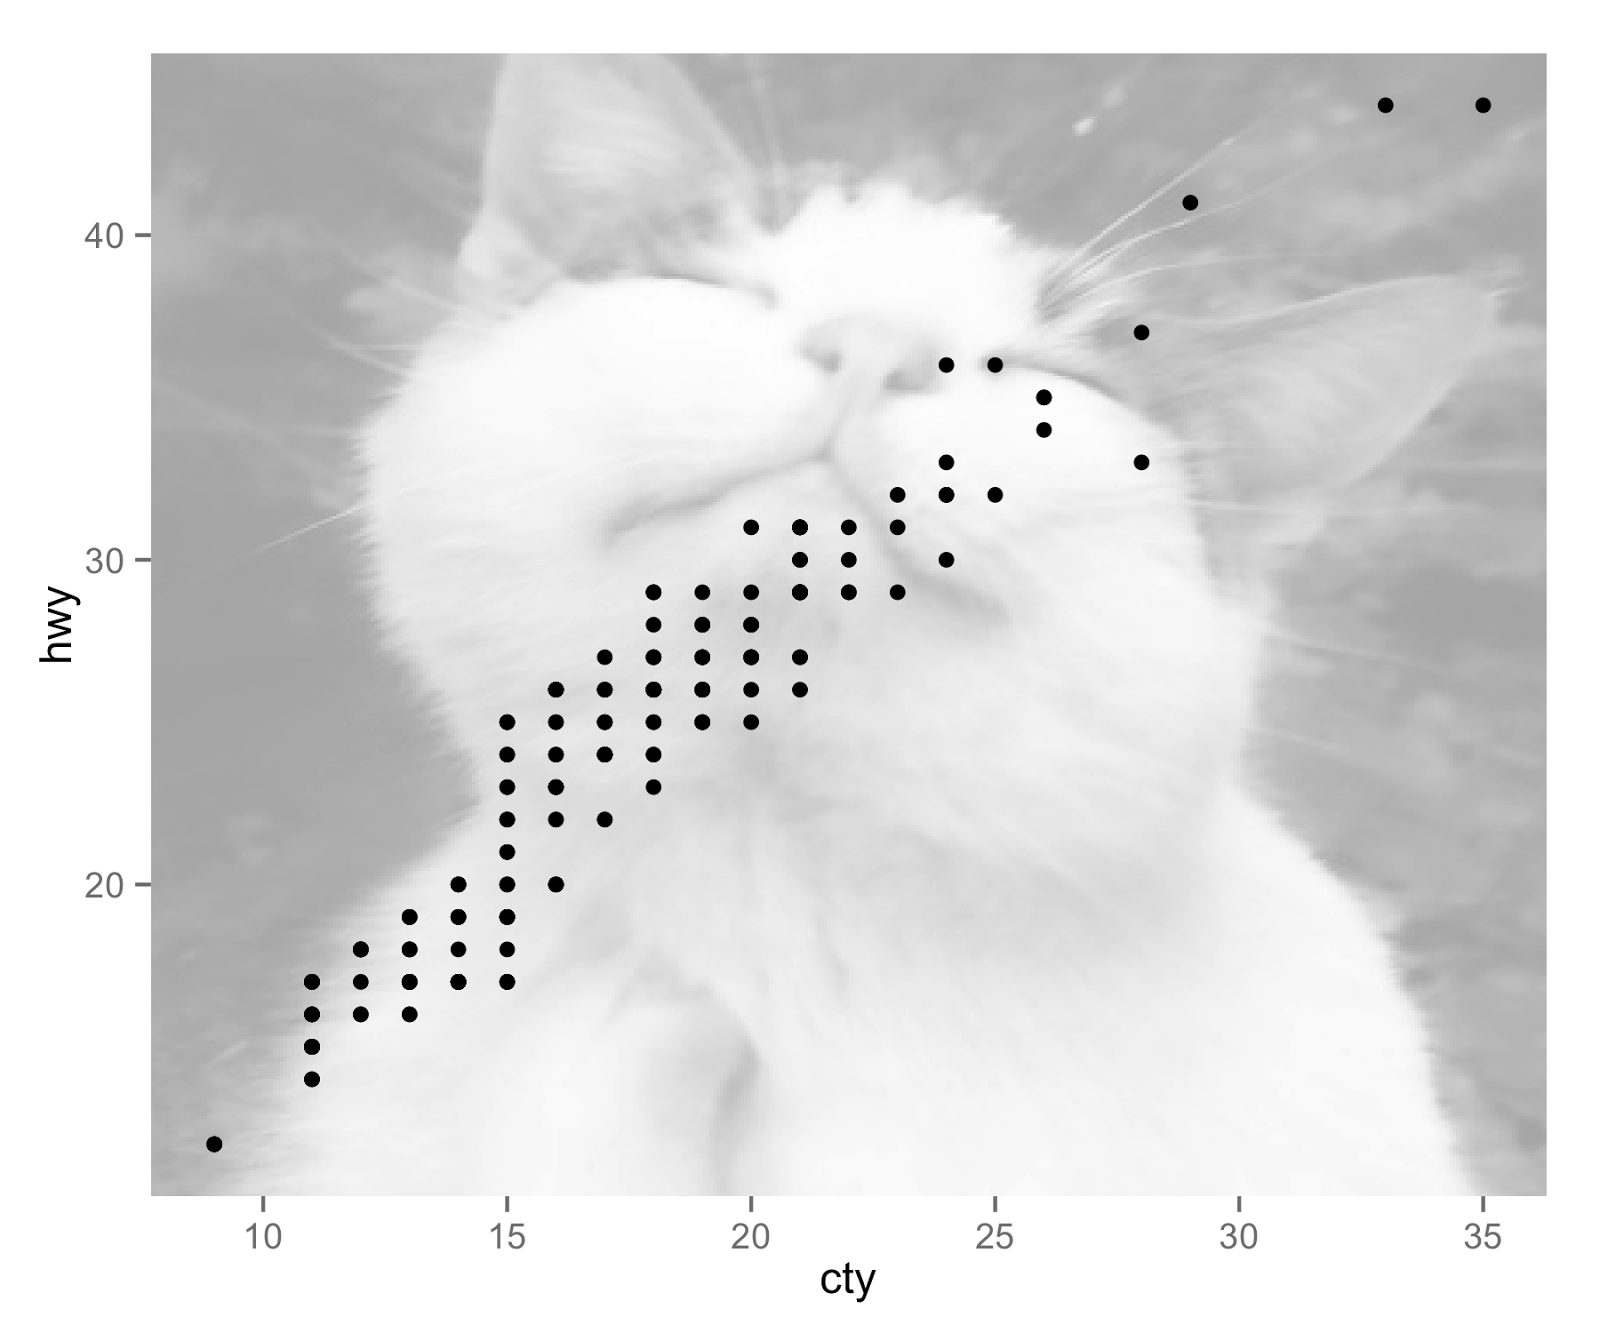
add_cat() function from Hilary Parker’s cats package to fetch a random cat picture from the internet and create an annotation_raster layer to add to your ggplot2 plot, doesn’t necessarily mean you shoulddo such a thing for a publication-quality figure. But if you ever needed to know how, this R graph catalog can help you out.library(ggplot2)
this_base = "0002_add-background-with-cats-package"
## devtools::install_github("hilaryparker/cats")
library(cats)
## library(help = "cats")
p = ggplot(mpg, aes(cty, hwy)) +
add_cat() +
geom_point()
p
ggsave(paste0(this_base, ".png"), p, width = 6, height = 5)
R + ggplot2 Graph Catalog(转)的更多相关文章
- R ggplot2 线性回归
摘自 http://f.dataguru.cn/thread-278300-1-1.html library(ggplot2) x=1:10y=rnorm(10)a=data.frame(x= x, ...
- R & ggplot2 & Excel绘图(直方图/经验分布图/QQ图/茎叶图/箱线图)实例
持续更新~ 散点图 条形图 文氏图 饼图 盒型图 频率直方图 热图 PCA图 3D图 火山图 分面图 分面制作小多组图 地图 练习数据: year count china Ame jap '12 2. ...
- R:ggplot2数据可视化——进阶(1)
,分为三个部分,此篇为Part1,推荐学习一些基础知识后阅读~ Part 1: Introduction to ggplot2, 覆盖构建简单图表并进行修饰的基础知识 Part 2: Customiz ...
- R:ggplot2数据可视化——基础知识
1 安装 # 获取ggplot2 最容易的就是下载整个tidyverse: install.packages("tidyverse") # 也可以选择只下载ggplot2: ins ...
- R:ggplot2数据可视化——进阶(3)
Part 3: Top 50 ggplot2 Visualizations - The Master List, 结合进阶1.2内容构建图形 有效的图形是: 不扭曲事实 传递正确的信息 简洁优雅 美观 ...
- R:ggplot2数据可视化——进阶(2)
Part 2: Customizing the Look and Feel, 更高级的自定义化,比如说操作图例.注记.多图布局等 # Setup options(scipen=999) librar ...
- R ggplot2 翻转坐标
p <- ggplot(mpg, aes(class, hwy)) p + geom_boxplot() p + geom_boxplot() + coord_flip()
- R ggplot2 改变颜色
p<-ggplot(iris,aes(Petal.Length,Petal.Width,color=Species))+geom_point()cols=c("red",&q ...
- R语言中文社区历史文章整理(类型篇)
R语言中文社区历史文章整理(类型篇) R包: R语言交互式绘制杭州市地图:leafletCN包简介 clickpaste包介绍 igraph包快速上手 jiebaR,从入门到喜欢 Catterpl ...
随机推荐
- POJ3592 Instantaneous Transference题解
题意: 给一个矩形,矩形中某些点有一定数量的矿石,有些点为传送点,有些点为障碍.你驾驶采矿车(ore-miner truck,我也不知道是什么),从左上角出发,采尽量多的矿石,矿石不可再生.不能往左边 ...
- Java中ArrayList,Vector,LinkedList,HashMap,HashTable,HashSet对比及总结
1.所有的集合的父类都是Collection的接口 2.Set List Map 区别 A 在Set里面:无法添加元素的顺序,所以Set里面的元素不能重复 B 在List中:有索引号,类似于数组, ...
- windows下用cordova构建android app
最近用到cordova打包apk,总结了下,写下来给大家分享. 一.前期准备工作: 1.安装node 6.2.0 *64 下载地址:链接:http://pan.baidu.com/s/1eS7Ts ...
- 关于binary log一点总结[转]
阅读目录(Content) 1 what's binary log 2 Binary Logging Options and Variables 2.1 基础参数 3 Binary Logging F ...
- Arduino LiquidCrystal Library Bug Report #174181
Arduino LiquidCrystal Character LCD Driver Library BUG Report #174181 by Conmajia Effected Devices H ...
- Unity CommandInvokationFailure: Failed to re-package resources. 解决方案
在导入谷歌的SDK的时候,打包出来报错CommandInvokationFailure: Failed to re-package resources. 把Android SDK更新一下就轻松搞定了, ...
- java进制转换(无视正负数的差别)
最近看了一下学习资料,感觉进制转换其实还是挺有意思的,尤其是对于负数这一方面. 下面和大家分享一下,这里只写了十进制到二进制的转换,其实都是同样的道理 public class Test1 { pub ...
- js基本语法汇总
1.分类 ECMAScript js基本语法与标准 DOM Document Object Model文档对象模型 BOM Browser Object Model浏览器对象模型 tips:DOM和B ...
- PHP环境搭建之PHPstorm9+PHP5开发环境配置
以前写过一篇zend studio+WAMP的:点这里,个人感觉写得不怎么好可是阅读数却上千了... 不过笔者身边好多人开始用PHPStrom了,所以就简单的写个教程 一.下载安装 PHPStrom下 ...
- 实现sticky footer的五种方法
2017-04-19 16:24:48 什么是sticky footer 如果页面内容不够长的时候,页脚块粘贴在视窗底部:如果内容足够长时,页脚块会被内容向下推送. 用position实现? 如果是用 ...