[Optimized Python] 17 - Performance bottle-neck
前言
对于一门编程语言,没接触到“优化”和“库代码”的源码理解程度,不足以谈“掌握”二字。
本篇的学习笔记,同时也意味着自己终于触及到了Python的junior国际水准。(joke)
要学的东西有很多,尤其是年纪大了后对编程语言要有一个“体系”:[Code] 大蛇之数据工程,方便自己复习。
编程语言的理解没大问题后,就是稳固“实践能力”,将编程模块化:[Code] 变态之人键合一,编程变为“堆积木”的效果。
工程能力的最终目的还是迎合市场,解决现实中的问题:[AI] 深度数据 - Data,产出高质量代码。
要学的清楚,走的明白。可见,大致的套路便是这三步走:
- 充分认识一门编程语言特性。
- 大量实践之并达到手脑协调。
- 基于合适平台解决市场问题。
通过性能分析找到程序瓶颈,读完本篇后你将能够回答下列问题:
- 如何找到代码中速度和 RAM 的瓶颈?
- 如何分析 CPU 和内存使用情况?
- 我应该分析到什么深度?
- 如何分析一个长期运行的应用程序?
- 在 CPython 台面下发生了什么?
- 如何在调整性能的同时确保功能的正确?
度量时间
一、程序时间计量
"一次时间" 计量
通过 “装饰器” 方法,只需给所测量的函数“戴个帽子”即可。
import math

import time

from functools import wraps

def fn_timer(function):

    @wraps(function)

    def function_timer(*args, **kwargs):

        start = time.time()

        result = function(*args, **kwargs)

        end   = time.time()

        print ("Total time: %s seconds" % (str(end-start)))

        return result

    return function_timer
“平均时间” 计量
ipython命令行模式可以直接支持,得到更为准确的“平均时间”。
import timeit

%timeit calc_pure_python(desired_width=1000, max_iterations=300)
"运行时细节" 计量
细分为用户、系统时间,貌似意义不大。
$ /usr/bin/time -p python julia1_nopil.py

Length of x: 1000

Total elements: 1000000

calculate_z_serial_purepython took 12.7298331261 seconds

real 13.46

user 13.40

sys 0.04
二、函数时间计量
cProfile 是标准库内建的三个分析工具之一,另外两个是 hotshot 和 profile。
hotshot 还处于实验阶段, profile 则是原始的纯 Python 分析器。
cProfile 具有跟 profile 一样的接口,且是默认的分析工具。
import math

import time

from functools import wraps

def fn_timer(function):

    @wraps(function)

    def function_timer(*args, **kwargs):

        start = time.time()

        result = function(*args, **kwargs)

        end   = time.time()

        print ("Total time: %s seconds" % (str(end-start)))

        return result

    return function_timer

@fn_timer

def check_prime(number):

    sqrt_number = math.sqrt(number)

    number_float = float(number)

    for i in range(2, int(sqrt_number) + 1):

        if (number_float / i).is_integer():

            return False

    return True

if __name__ == "__main__":

    print("check_prime(10000000) = ", check_prime(10000000))

    print("check_prime(10000019) = ", check_prime(10000019))
完整测试代码
函数运行时的详细计量结果。
$  python -m cProfile -s cumulative 70-measure.py

Total time: 1.239776611328125e-05 seconds

check_prime() =  False

Total time: 0.0006530284881591797 seconds

check_prime() =  True

          function calls in 0.001 seconds

   Ordered by: cumulative time

   ncalls  tottime  percall  cumtime  percall filename:lineno(function)

            0.000    0.000    0.001    0.001 {built-in method builtins.exec}

            0.000    0.000    0.001    0.001 -measure.py:(<module>)  # 进入__main__函数

            0.000    0.000    0.001    0.000 -measure.py:(function_timer)

            0.000    0.000    0.001    0.000 -measure.py:(check_prime)

            0.000    0.000    0.001    0.001 <frozen importlib._bootstrap>:(_find_and_load)
可视化 runsnake,安装过程如下:
sudo apt-get update

sudo apt-get install runsnakerun
三、逐行分析
分析CPU密集型的性能问题,速度比较慢,所以一次测试仅考虑部分关键函数。
用修饰器(@profile)标记选中的函数。用 kernprof.py 脚本运行你的代码,被选函数每一行花费的 CPU 时间以及其他信息就会被记录下来。
$ kernprof -l -v 70-measure.py

Total time: 5.10215759277e-05 seconds

('check_prime(10000000) = ', False)

Total time: 0.000823020935059 seconds

('check_prime(10000019) = ', True)

Wrote profile results to 70-measure.py.lprof

Timer unit: 1e-06 s

Total time: 0.000898 s

File: 70-measure.py

Function: function_timer at line 11

Line #      Hits         Time  Per Hit   % Time  Line Contents

==============================================================

    11                                               @wraps(function)

    12                                               def function_timer(*args, **kwargs):

    13         2          2.0      1.0      0.2          start = time.time()

    14         2        870.0    435.0     96.9          result = function(*args, **kwargs)

    15         2          1.0      0.5      0.1          end   = time.time()

    16         2         24.0     12.0      2.7          print ("Total time: %s seconds" % (str(end-start)))

    17         2          1.0      0.5      0.1          return result
度量空间
我们能不能重写这个函数让它使用更少的 RAM 来工作得更有效率?
我们能不能使用更多 RAM 缓存来节省 CPU 周期?
一、进程内存使用
memory_profiler
安装:https://anaconda.org/anaconda/memory_profiler
再强调一遍,这个数字不一定是数组的真实大小,只是进程在创建这些列表的过程中增长的大小。
$ python -m memory_profiler 70-measure.py

Total time: 0.00010919570922851562 seconds

check_prime(10000000) =  False

Total time: 0.0031642913818359375 seconds

check_prime(10000019) =  True

Filename: 70-measure.py

Line #    Mem usage    Increment   Line Contents

================================================

    11   36.855 MiB   36.855 MiB       @wraps(function)

    12                                 def function_timer(*args, **kwargs):

    13   36.855 MiB    0.000 MiB           start = time.time()

    14   36.855 MiB    0.000 MiB           result = function(*args, **kwargs)

    15   36.855 MiB    0.000 MiB           end   = time.time()

    16   36.855 MiB    0.000 MiB           print ("Total time: %s seconds" % (str(end-start)))

    17   36.855 MiB    0.000 MiB           return result
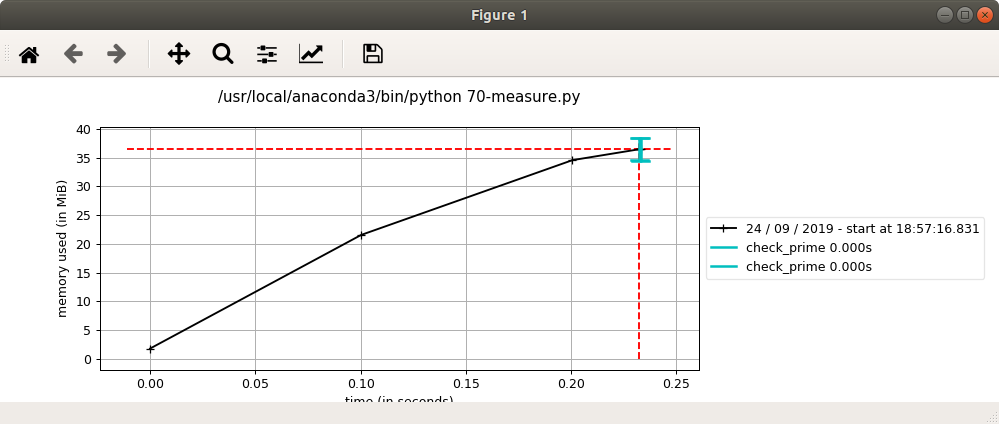
mprof
memory_profiler有一个功能叫 mprof,用于对内存使用情况进行采样和画图。它的采样基于时间而不是代码行,因而不会影响代码的运行时间。
mprof run 70-measure.py

mprof plot

mprof clean
ipython_memory_usage
通过一例子,查看一个模块会吃掉多少内存。
Below you can see an example showing exact memory usage with and without __slots__ done in IPython thanks to https://github.com/ianozsvald/ipython_memory_usage
In [1]: import ipython_memory_usage.ipython_memory_usage as imu

In [2]: imu.start_watching_memory()

In [2] used 0.0000 MiB RAM in 5.31s, peaked 0.00 MiB above current, total RAM usage 15.57 MiB


---------------------------------------------------------------------------------------------

In [3]: %cat slots.py

class MyClass(object):

        __slots__ = ['name', 'identifier']

        def __init__(self, name, identifier):

                self.name = name

                self.identifier = identifier

num = 1024*256

x = [MyClass(1,1) for i in range(num)]

In [3] used 0.2305 MiB RAM in 0.12s, peaked 0.00 MiB above current, total RAM usage 15.80 MiB

In [4]: from slots import *

In [4] used 9.3008 MiB RAM in 0.72s, peaked 0.00 MiB above current, total RAM usage 25.10 MiB


---------------------------------------------------------------------------------------------

In [5]: %cat noslots.py

class MyClass(object):

        def __init__(self, name, identifier):

                self.name = name

                self.identifier = identifier

num = 1024*256

x = [MyClass(1,1) for i in range(num)]

In [5] used 0.1758 MiB RAM in 0.12s, peaked 0.00 MiB above current, total RAM usage 25.28 MiB

In [6]: from noslots import *

In [6] used 22.6680 MiB RAM in 0.80s, peaked 0.00 MiB above current, total RAM usage 47.95 MiB
二、内存堆上的对象
Ref: Getting started with Heapy
In [8]: import sys

In [9]: sys.getsizeof(set())

Out[9]: 224

In [10]: sys.getsizeof({})

Out[10]: 240

In [11]: sys.getsizeof([])

Out[11]: 64
Diagnosing Memory “Leaks” in Python
通过 ”差值" 判断其间代码带来的影响,这里的 “减法” 就是精髓。
from guppy import hpy

hp = hpy()

before = hp.heap()

# critical section here

after = hp.heap()

leftover = after - before
The best heapy tutorial I have found is How to use guppy/heapy for tracking down memory usage. [http://www.smira <dot> ru/wp-content/uploads/2011/08/heapy.html]
三、追踪对象
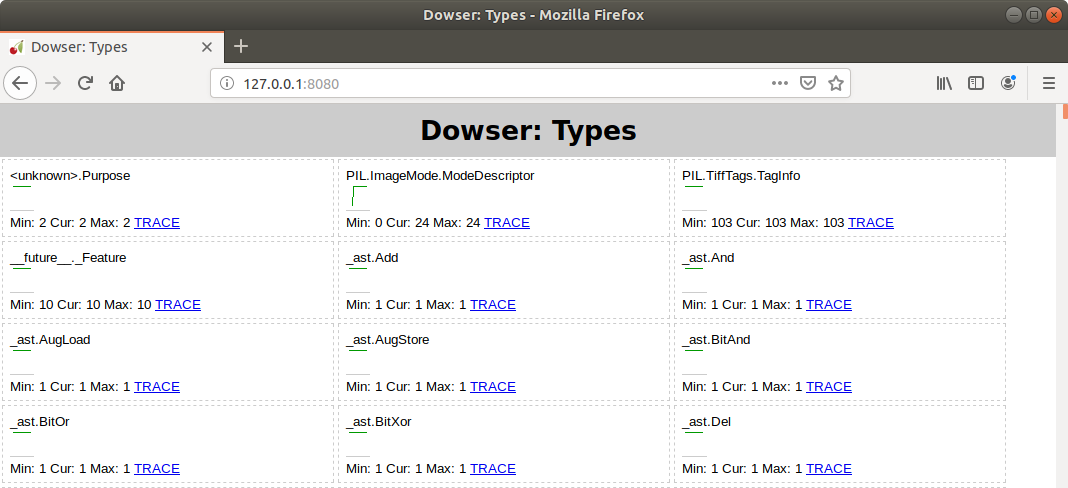
Robert Brewer 的 dowser 可以在代码运行时钩入名字空间并通过 CherryPy 接口 在一个 Web 服务器上提供一个实时的变量实例图。
每个被追踪对象都有一个走势图,让你可以看到某个对象的数量是否在增长,这在分析长期运行的进程时很有用。
安装对应的python3相配的packages。
pip install dowser-py3

pip3 install cherrypy
类似 heapy, 在正式代码开始前加入如下代码:
Ref: Debugging Python’s Memory Usage with Dowser
Then doing launch_memory_usage_server() somewhere early in my code launched the HTTP interface (http://localhost:8080/) to see memory usage while the import process was running. This helped me narrow down where the issue showed up (as we were leaking MySQLdb cursors at an alarming rate), and digging deeper into the structure hinted to the underlying cause (the debug toolbar was active for a console script).
添加如下代码:
def launch_memory_usage_server(port = 8080):

    import cherrypy

    import dowser

    cherrypy.tree.mount(dowser.Root())

    cherrypy.config.update({

        'environment': 'embedded',

        'server.socket_port': port

    })

    cherrypy.engine.start()
在网页端能看到一大片的objects,如下:
系统级性能剖析
Perf是一款综合性分析工具,大到系统全局性性能,再小到进程线程级别,甚至到函数及汇编级别。
Goto: 系统级性能分析工具perf的介绍与使用【非常强大的工具,此处只关注一部分】
一、使用方法
$ sudo perf stat -e cycles,stalled-cycles-frontend,stalled-cycles-backend,instructions,cache-references,cache-misses,branches,branch-misses,task-clock,faults,minor-faults,cs,migrations -r  python diffusion_python_memory.py

 Performance counter stats for 'python diffusion_python_memory.py' ( runs):

               cycles                    #    3.186 GHz                      ( +-  0.71% )  (65.99%)

   <not supported>      stalled-cycles-frontend

   <not supported>      stalled-cycles-backend

               instructions              #    2.97  insn per cycle           ( +-  0.63% )  (83.00%)

                 cache-references          #   24.054 M/sec                    ( +-  6.48% )  (82.99%)

                  cache-misses              #   12.733 % of all cache refs      ( +-  7.12% )  (83.00%)

               branches                  # 1764.388 M/sec                    ( +-  0.94% )  (84.02%)

                  branch-misses             #    0.22% of all branches          ( +-  9.35% )  (84.00%)

             70.54 msec task-clock                #    0.996 CPUs utilized            ( +-  2.57% )

                     faults                    #    0.011 M/sec

                     minor-faults              #    0.011 M/sec

                       cs                        #    0.024 K/sec                    ( +- 20.00% )

                       migrations                #    0.000 K/sec

           0.07081 +- 0.00184 seconds time elapsed  ( +-  2.59% )
二、根据 perf 输出做出抉择
考虑连续内存数据结构 (如下);而 List 实际上是 “指针数组”。
import array
由于实现细节,使用 array 类型来创建数据列表实际上比使用 list 要慢;array 对象不适用于数学计算而更适用于在内存中存放类型固定的数据。
为了解决 perf 发现的分片问题,我们必须找到一个可以进行高效矢量操作的模块。
幸运的是, numpy 拥有我们需要的所有特性——它能将数据连续存储在内存中并支持数据的矢量操作。
结果就是,任何我们对 numpy 数组的数学操作都能自动矢量化而无须我们显式遍历每一个元素。
更多内容,请见:[Pandas] 01 - A guy based on NumPy
单元测试
程序能一次写完并正常运行的概率很小,基本不超过1%。总会有各种各样的bug需要修正。
单元测试部分代码正确性的同时,也可以测试其性能瓶颈。
More details: unittest --- 单元测试框架
一、测试对象 mydict.py
编写一个Dict类,行为和dict一致。
class Dict(dict):

    def __init__(self, **kw):

        super().__init__(**kw)

    def __getattr__(self, key):

        try:

            return self[key]

        except KeyError:

            raise AttributeError(r"'Dict' object has no attribute '%s'" % key)

    def __setattr__(self, key, value):

        self[key] = value
二、测试程序 mydict_test.py
规则:以test开头的方法就是测试方法,不以test开头的方法不被认为是测试方法,测试的时候不会被执行。
设想你的测试需要启动一个数据库,这时,就可以在setUp()方法中连接数据库,在tearDown()方法中关闭数据库,这样,不必在每个测试方法中重复相同的代码。
执行顺序如下:setUp---test_init---setUp---test_key---setUp---test_attr---setUp---test_keyerror---setUp---test_attrerror---tearDown
import unittest

from mydict import Dict

class TestDict(unittest.TestCase):


    def setUp():
        pass

    def tearDown():
        pass

    def test_init(self):

        d = Dict(a=1, b='test')

        self.assertEqual(d.a, 1)

        self.assertEqual(d.b, 'test')

        self.assertTrue(isinstance(d, dict))

    def test_key(self):

        d = Dict()

        d['key'] = 'value'

        self.assertEqual(d.key, 'value')

    def test_attr(self):

        d = Dict()

        d.key = 'value'

        self.assertTrue('key' in d)

        self.assertEqual(d['key'], 'value')

    def test_keyerror(self):

        d = Dict()

        with self.assertRaises(KeyError):

            value = d['empty']          # <---- 访问不存在的key时希望抛出KeyError异常

    def test_attrerror(self):

        d = Dict()

        with self.assertRaises(AttributeError):

            value = d.empty
三、开始测试 unittest.main()
最简单的运行方式是在mydict_test.py的最后加上两行代码:
if __name__ == '__main__':

    unittest.main()
另一种方法是在命令行通过参数-m unittest直接运行单元测试:
$ python -m unittest mydict_test

.....

----------------------------------------------------------------------

Ran 5 tests in 0.000s

OK
四、文档测试
Python内置的“文档测试”(doctest)模块可以直接提取注释中的代码并执行测试。
# mydict2.py

class Dict(dict):

    '''

    Simple dict but also support access as x.y style.

    >>> d1 = Dict()

    >>> d1['x'] = 100

    >>> d1.x

    100

    >>> d1.y = 200

    >>> d1['y']

    200

    >>> d2 = Dict(a=1, b=2, c='3')

    >>> d2.c

    '3'

    >>> d2['empty']

    Traceback (most recent call last):

        ...

    KeyError: 'empty'

    >>> d2.empty

    Traceback (most recent call last):

        ...

    AttributeError: 'Dict' object has no attribute 'empty'

    '''

    def __init__(self, **kw):

        super(Dict, self).__init__(**kw)

    def __getattr__(self, key):

        try:

            return self[key]

        except KeyError:

            raise AttributeError(r"'Dict' object has no attribute '%s'" % key)

    def __setattr__(self, key, value):

        self[key] = value


if __name__=='__main__':

    import doctest

    doctest.testmod()
End.
[Optimized Python] 17 - Performance bottle-neck的更多相关文章
- python web with bottle and session (beaker)
python web with bottle and session (beaker) http://icodesnip.com/snippet/python/python-web-with-bott ...
- 微型 Python Web 框架 Bottle - Heroin blog
微型 Python Web 框架 Bottle - Heroin blog 微型 Python Web 框架 Bottle
- [深度分析] Python Web 开发框架 Bottle
[深度分析] Python Web 开发框架 Bottle(这个真的他妈的经典!!!) 作者:lhf2009913 Bottle 是一个非常精致的WSGI框架,它提供了 Python Web开发中需要 ...
- python微框架Bottle(http)
环境: win7系统 Python2.7 一 背景和概述 眼下项目中须要加入一个激活码功能,打算单独弄一个httpserver来写. 由于之前的游戏中已经有了一套完整的激活码生成工具和验证httpse ...
- Python Web框架 bottle flask
Bottle Bottle是一个快速.简洁.轻量级的基于WSIG的微型Web框架,此框架只由一个 .py 文件,除了Python的标准库外,其不依赖任何其他模块. 1 2 3 4 pip instal ...
- Python开发者须知 —— Bottle框架常见的几个坑
Bottle是一个小巧实用的python框架,整个框架只有一个几十K的文件,但却包含了路径映射.模板.简单的数据库访问等web框架组件,而且语法简单,部署方便,很受python开发者的青睐.Pytho ...
- python 17 内置模块
目录 1. 序列化模块 1.1 json 模块 1.2 pickle 模块 2. os 模块 3. sys 模块 4. hashlib 加密.摘要 4.1 加密 4.2 加盐 4.3 文件一致性校验 ...
- python 17 异常
自 http://www.cnblogs.com/BeginMan/p/3171445.html 一.什么是错误,什么是异常,它们两者区别 这里解释如下:个人觉得很通俗易懂 错误是指在执行代码过程中发 ...
- [LeetCode][Python]17: Letter Combinations of a Phone Number
# -*- coding: utf8 -*-'''__author__ = 'dabay.wang@gmail.com' 17: Letter Combinations of a Phone Numb ...
随机推荐
- 对已经存在的hbase表修改压缩方式
业务上可能会遇到这种情况,在最初创建hbase表时候,未指定压缩方式,当数据导入之后,由rowkey带来的数据膨胀导致hdfs上的数据大小远远大于原始数据大小.所以这时候可能就不得不考虑使用压缩,但是 ...
- Django上线部署之Apache
环境: 1.Windows Server 2016 Datacenter 64位 2.SQL Server 2016 Enterprise 64位 3.Python 3.6.0 64位 4.admin ...
- Spring源码剖析4:其余方式获取Bean的过程分析
原型Bean加载过程 之前的文章,分析了非懒加载的单例Bean整个加载过程,除了非懒加载的单例Bean之外,Spring中还有一种Bean就是原型(Prototype)的Bean,看一下定义方式: 1 ...
- springboot + jedisCluster
如果使用的是redis2.x,在项目中使用客户端分片(Shard)机制. 如果使用的是redis3.x中的集群,在项目中使用jedisCluster. 1.项目结构 2.pom.xml 1 <? ...
- 只需一步,在Spring Boot中统一Restful API返回值格式与统一处理异常
## 统一返回值 在前后端分离大行其道的今天,有一个统一的返回值格式不仅能使我们的接口看起来更漂亮,而且还可以使前端可以统一处理很多东西,避免很多问题的产生. 比较通用的返回值格式如下: ```jav ...
- Ribbon实现客户端负载均衡
什么是Ribbon? 客户端负载均衡组件. 前期准备: 搭建一个Eureka集群和一个注册服务 https://www.cnblogs.com/noneplus/p/11374883.html 创建服 ...
- 关于python的特殊方法
最近在阅读<流畅的python>这本书,在第一章中作者就提到了几个python中的特殊方法,代码入下: class FrenchDuck: ranks = [str(n) for n in ...
- 从零开始搭建Java开发环境第三篇:最新版IDEA常用配置指南,打造你的最酷IDE
刚刚使用IntelliJ IDEA 编辑器的时候,会有很多设置,会方便以后的开发,工欲善其事必先利其器. 比如:设置文件字体大小,代码自动完成提示,版本管理,本地代码历史,自动导入包,修改注释,修改t ...
- iOS仿写下厨房
把之前简书的博客搬到博客园了,还是放在一个地方看着舒服. 先看一下做的效果,是不是还不错?(可以看一下早餐那块的轮播,上面盖着一个都是点点的图片,但是它不是和轮播一起滚动的,是盖在轮播上面的,需要在那 ...
- Linux之Shell编程(16)
读取从控制台输入的值(read): 系统函数: basename:返回完整路径最后/部分,常用于获取文件名 basename [pathname] [suffix] dirname:返回完整路径最后/ ...